
|
|||||
|
 | |
| |
| |
| |
| |
| |
|
Gene: PANO1 |
Gene summary for PANO1 |
| Gene information | Species | Human | Gene symbol | PANO1 | Gene ID | 101927423 |
| Gene name | proapoptotic nucleolar protein 1 | |
| Gene Alias | PANO | |
| Cytomap | 11p15.5 | |
| Gene Type | protein-coding | GO ID | GO:0006508 | UniProtAcc | I0J062 |
Top |
Malignant transformation analysis |
| Identification of the aberrant gene expression in precancerous and cancerous lesions by comparing the gene expression of stem-like cells in diseased tissues with normal stem cells |
| Entrez ID | Symbol | Replicates | Species | Organ | Tissue | Adj P-value | Log2FC | Malignancy |
| 101927423 | PANO1 | HCC1 | Human | Liver | HCC | 1.76e-16 | 1.18e+00 | 0.5336 |
| 101927423 | PANO1 | HCC2 | Human | Liver | HCC | 7.21e-18 | 1.18e+00 | 0.5341 |
| 101927423 | PANO1 | HCC5 | Human | Liver | HCC | 1.25e-18 | 1.47e+00 | 0.4932 |
| Page: 1 |
| Tissue | Expression Dynamics | Abbreviation |
| Liver | 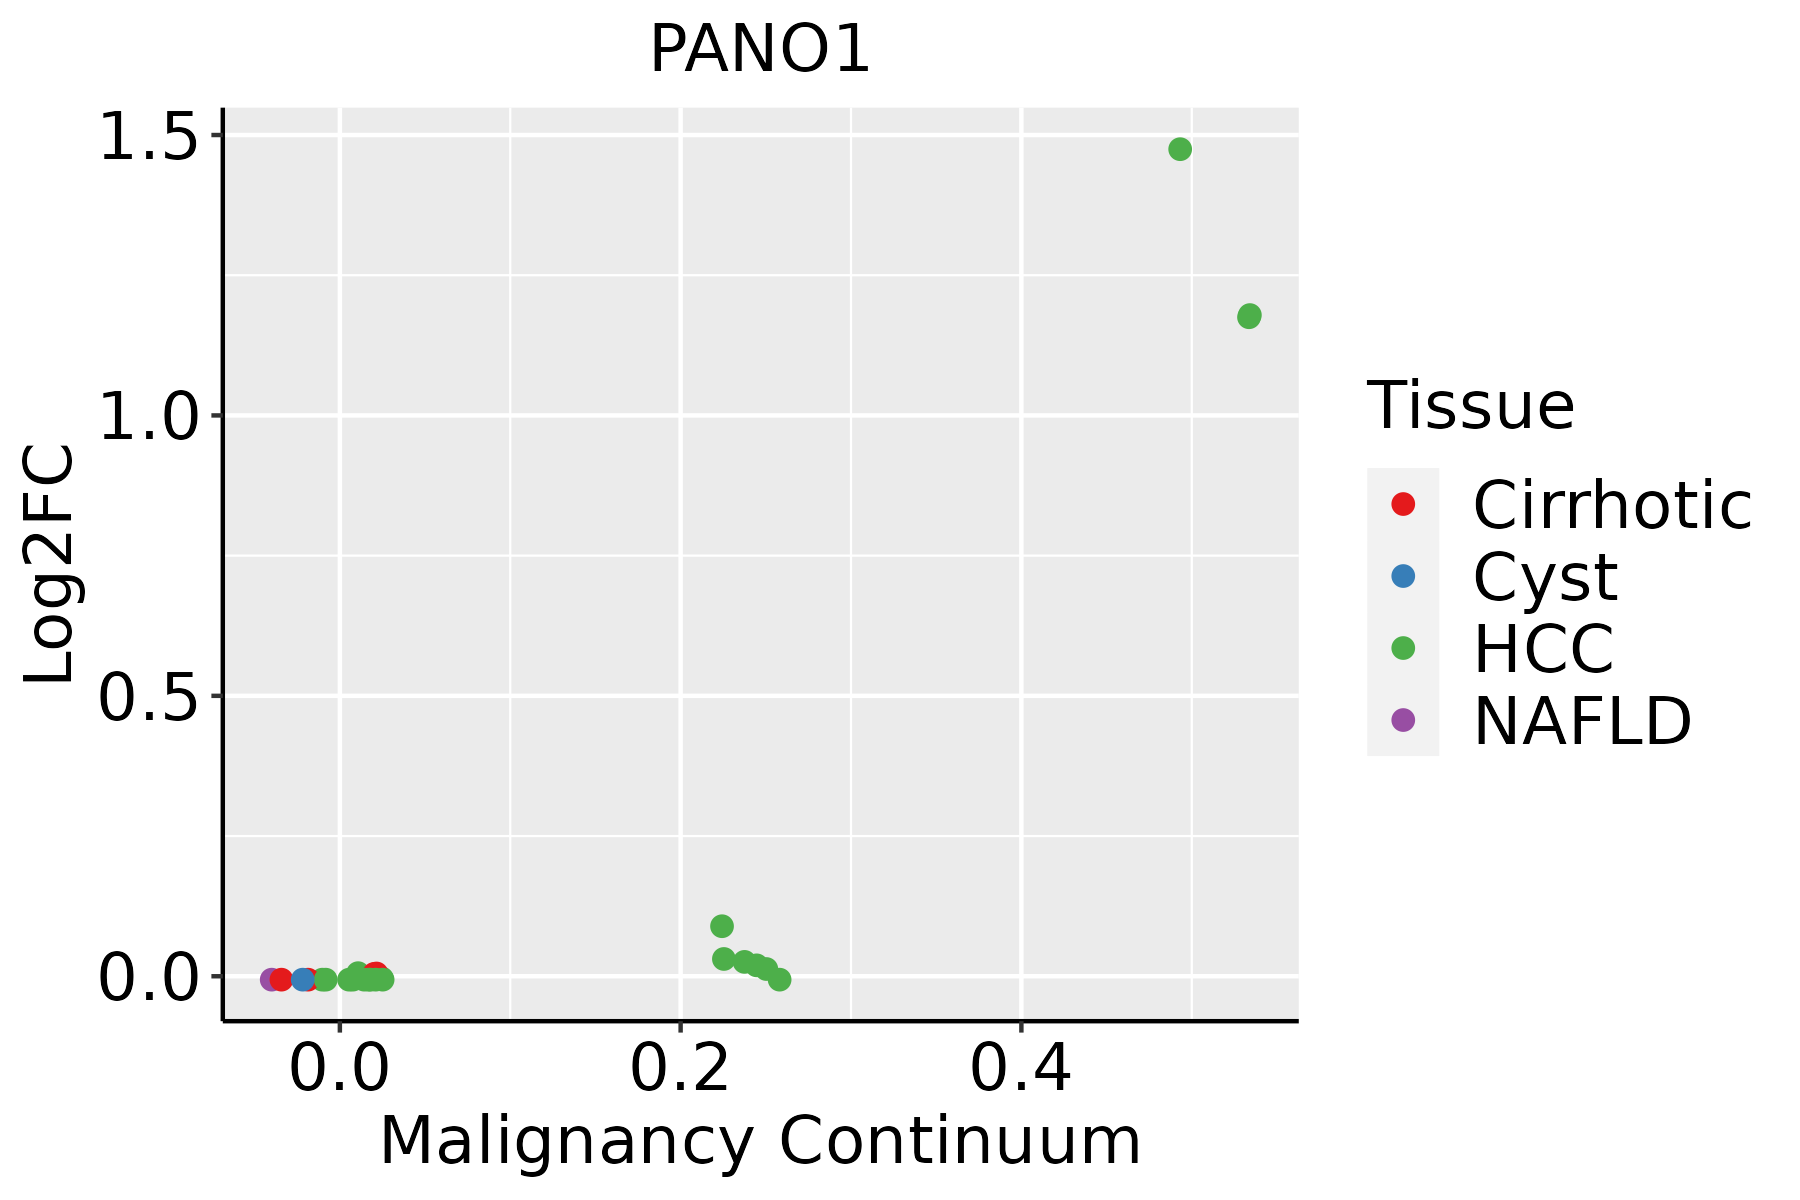 | HCC: Hepatocellular carcinoma |
| NAFLD: Non-alcoholic fatty liver disease |
| ∗log2FC in expression of this searched gene in stem-like cells from each diseased tissue sample relative to stem-like cells in normal samples in each tissue plotted against the malignancy continuum. Samples are colored based on if they are from different disease stage. |
Top |
Malignant transformation related pathway analysis |
| Find out the enriched GO biological processes and KEGG pathways involved in transition from healthy to precancer to cancer |
| Tissue | Disease Stage | Enriched GO biological Processes |
| Colorectum | AD |  |
| Colorectum | SER |  |
| Colorectum | MSS |  |
| Colorectum | MSI-H |  |
| Colorectum | FAP |  |
| ∗Top 15 enriched GO BP terms are showed in the bar plot of each disease state in each tissue. Each row represents a significant GO biological process which is colored according to the -log10(p.adjust). |
| Page: 1 2 3 4 5 6 7 8 9 |
| GO ID | Tissue | Disease Stage | Description | Gene Ratio | Bg Ratio | pvalue | p.adjust | Count |
| GO:001049822 | Liver | HCC | proteasomal protein catabolic process | 351/7958 | 490/18723 | 6.92e-40 | 1.46e-36 | 351 |
| GO:004316122 | Liver | HCC | proteasome-mediated ubiquitin-dependent protein catabolic process | 299/7958 | 412/18723 | 7.82e-36 | 8.27e-33 | 299 |
| GO:004217622 | Liver | HCC | regulation of protein catabolic process | 267/7958 | 391/18723 | 2.45e-25 | 7.38e-23 | 267 |
| GO:003164722 | Liver | HCC | regulation of protein stability | 211/7958 | 298/18723 | 2.29e-23 | 5.01e-21 | 211 |
| GO:190336222 | Liver | HCC | regulation of cellular protein catabolic process | 182/7958 | 255/18723 | 5.91e-21 | 8.52e-19 | 182 |
| GO:190305022 | Liver | HCC | regulation of proteolysis involved in cellular protein catabolic process | 157/7958 | 221/18723 | 5.93e-18 | 6.83e-16 | 157 |
| GO:006113622 | Liver | HCC | regulation of proteasomal protein catabolic process | 134/7958 | 187/18723 | 5.03e-16 | 4.09e-14 | 134 |
| GO:200005822 | Liver | HCC | regulation of ubiquitin-dependent protein catabolic process | 120/7958 | 164/18723 | 1.31e-15 | 9.74e-14 | 120 |
| GO:003243422 | Liver | HCC | regulation of proteasomal ubiquitin-dependent protein catabolic process | 100/7958 | 134/18723 | 3.67e-14 | 2.32e-12 | 100 |
| GO:000989522 | Liver | HCC | negative regulation of catabolic process | 196/7958 | 320/18723 | 7.98e-12 | 3.35e-10 | 196 |
| GO:003133022 | Liver | HCC | negative regulation of cellular catabolic process | 164/7958 | 262/18723 | 3.52e-11 | 1.35e-09 | 164 |
| GO:200005922 | Liver | HCC | negative regulation of ubiquitin-dependent protein catabolic process | 37/7958 | 48/18723 | 1.12e-06 | 1.66e-05 | 37 |
| GO:004217721 | Liver | HCC | negative regulation of protein catabolic process | 76/7958 | 121/18723 | 5.11e-06 | 6.41e-05 | 76 |
| GO:003243521 | Liver | HCC | negative regulation of proteasomal ubiquitin-dependent protein catabolic process | 28/7958 | 35/18723 | 6.54e-06 | 7.88e-05 | 28 |
| GO:004586122 | Liver | HCC | negative regulation of proteolysis | 186/7958 | 351/18723 | 4.19e-05 | 4.11e-04 | 186 |
| GO:190305121 | Liver | HCC | negative regulation of proteolysis involved in cellular protein catabolic process | 42/7958 | 64/18723 | 1.58e-04 | 1.26e-03 | 42 |
| GO:190336321 | Liver | HCC | negative regulation of cellular protein catabolic process | 47/7958 | 75/18723 | 3.36e-04 | 2.35e-03 | 47 |
| GO:19017994 | Liver | HCC | negative regulation of proteasomal protein catabolic process | 32/7958 | 49/18723 | 1.06e-03 | 6.11e-03 | 32 |
| Page: 1 |
| Pathway ID | Tissue | Disease Stage | Description | Gene Ratio | Bg Ratio | pvalue | p.adjust | qvalue | Count |
| Page: 1 |
Top |
Cell-cell communication analysis |
| Identification of potential cell-cell interactions between two cell types and their ligand-receptor pairs for different disease states |
| Ligand | Receptor | LRpair | Pathway | Tissue | Disease Stage |
| Page: 1 |
Top |
Single-cell gene regulatory network inference analysis |
| Find out the significant the regulons (TFs) and the target genes of each regulon across cell types for different disease states |
| TF | Cell Type | Tissue | Disease Stage | Target Gene | RSS | Regulon Activity |
| ∗The dot plots of a searched regulon are shown for all cell subpopulations in each disease state of each tissue based on the regulon specific score inferred using pySCENIC and by calculating the average expression. |
| Page: 1 |
Top |
Somatic mutation of malignant transformation related genes |
| Annotation of somatic variants for genes involved in malignant transformation |
| Hugo Symbol | Variant Class | Variant Classification | dbSNP RS | HGVSc | HGVSp | HGVSp Short | SWISSPROT | BIOTYPE | SIFT | PolyPhen | Tumor Sample Barcode | Tissue | Histology | Sex | Age | Stage | Therapy Types | Drugs | Outcome |
| Page: 1 |
Top |
Related drugs of malignant transformation related genes |
| Identification of chemicals and drugs interact with genes involved in malignant transfromation |
| (DGIdb 4.0) |
| Entrez ID | Symbol | Category | Interaction Types | Drug Claim Name | Drug Name | PMIDs |
| Page: 1 |

Copyright 2023-Present -The University of Texas Health Science Center at Houston |