
|
|||||
|
 | |
| |
| |
| |
| |
| |
|
Gene: PAMR1 |
Gene summary for PAMR1 |
| Gene information | Species | Human | Gene symbol | PAMR1 | Gene ID | 25891 |
| Gene name | peptidase domain containing associated with muscle regeneration 1 | |
| Gene Alias | DKFZP586H2123 | |
| Cytomap | 11p13 | |
| Gene Type | protein-coding | GO ID | GO:0005575 | UniProtAcc | Q6UXH9 |
Top |
Malignant transformation analysis |
| Identification of the aberrant gene expression in precancerous and cancerous lesions by comparing the gene expression of stem-like cells in diseased tissues with normal stem cells |
| Entrez ID | Symbol | Replicates | Species | Organ | Tissue | Adj P-value | Log2FC | Malignancy |
| 25891 | PAMR1 | AEH-subject1 | Human | Endometrium | AEH | 2.58e-31 | -6.35e-01 | -0.3059 |
| 25891 | PAMR1 | AEH-subject2 | Human | Endometrium | AEH | 8.27e-34 | -6.36e-01 | -0.2525 |
| 25891 | PAMR1 | AEH-subject3 | Human | Endometrium | AEH | 1.71e-19 | -5.47e-01 | -0.2576 |
| 25891 | PAMR1 | AEH-subject4 | Human | Endometrium | AEH | 1.51e-05 | -2.48e-01 | -0.2657 |
| 25891 | PAMR1 | AEH-subject5 | Human | Endometrium | AEH | 5.72e-35 | -6.71e-01 | -0.2953 |
| 25891 | PAMR1 | EEC-subject1 | Human | Endometrium | EEC | 4.11e-40 | -6.59e-01 | -0.2682 |
| 25891 | PAMR1 | EEC-subject2 | Human | Endometrium | EEC | 2.45e-36 | -6.81e-01 | -0.2607 |
| 25891 | PAMR1 | EEC-subject3 | Human | Endometrium | EEC | 2.42e-38 | -6.60e-01 | -0.2525 |
| 25891 | PAMR1 | EEC-subject4 | Human | Endometrium | EEC | 5.01e-30 | -5.92e-01 | -0.2571 |
| 25891 | PAMR1 | EEC-subject5 | Human | Endometrium | EEC | 1.23e-39 | -6.79e-01 | -0.249 |
| 25891 | PAMR1 | GSM5276934 | Human | Endometrium | EEC | 1.23e-04 | -3.22e-01 | -0.0913 |
| 25891 | PAMR1 | GSM5276935 | Human | Endometrium | EEC | 1.36e-43 | -6.87e-01 | -0.123 |
| 25891 | PAMR1 | GSM6177620_NYU_UCEC1_lib1_lib1 | Human | Endometrium | EEC | 1.08e-34 | -6.89e-01 | -0.1869 |
| 25891 | PAMR1 | GSM6177620_NYU_UCEC1_lib2_lib2 | Human | Endometrium | EEC | 4.28e-31 | -6.89e-01 | -0.1875 |
| 25891 | PAMR1 | GSM6177620_NYU_UCEC1_lib3_lib3 | Human | Endometrium | EEC | 7.56e-36 | -6.89e-01 | -0.1883 |
| 25891 | PAMR1 | GSM6177621_NYU_UCEC2_lib1_lib1 | Human | Endometrium | EEC | 1.03e-42 | -6.89e-01 | -0.1934 |
| 25891 | PAMR1 | GSM6177622_NYU_UCEC3_lib1_lib1 | Human | Endometrium | EEC | 1.36e-43 | -6.89e-01 | -0.1917 |
| 25891 | PAMR1 | GSM6177622_NYU_UCEC3_lib2_lib2 | Human | Endometrium | EEC | 1.05e-45 | -6.89e-01 | -0.1916 |
| 25891 | PAMR1 | GSM6177623_NYU_UCEC3_Vis | Human | Endometrium | EEC | 9.60e-08 | -3.48e-01 | -0.1269 |
| 25891 | PAMR1 | C38 | Human | Oral cavity | OSCC | 1.28e-11 | 8.20e-01 | 0.172 |
| Page: 1 2 |
| Tissue | Expression Dynamics | Abbreviation |
| Endometrium | 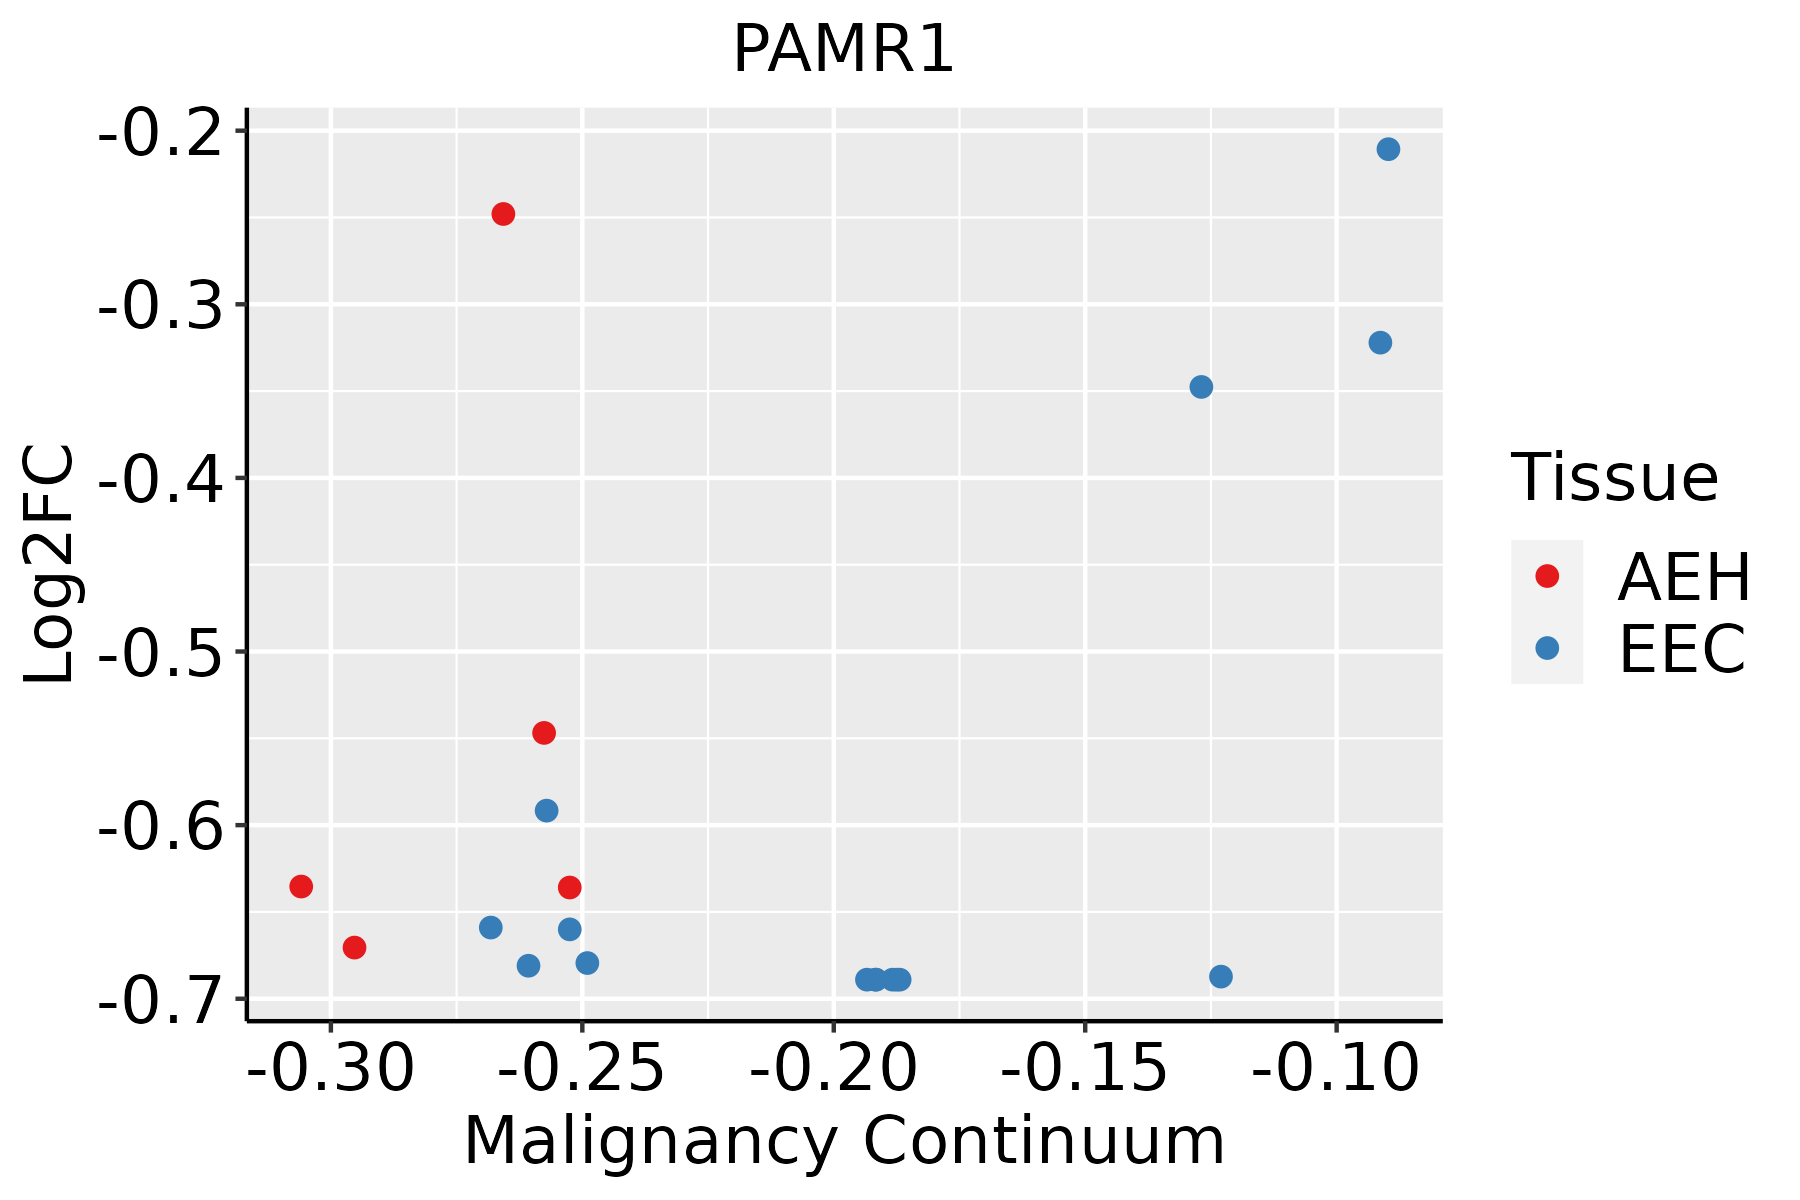 | AEH: Atypical endometrial hyperplasia |
| EEC: Endometrioid Cancer | ||
| Oral Cavity |  | EOLP: Erosive Oral lichen planus |
| LP: leukoplakia | ||
| NEOLP: Non-erosive oral lichen planus | ||
| OSCC: Oral squamous cell carcinoma |
| ∗log2FC in expression of this searched gene in stem-like cells from each diseased tissue sample relative to stem-like cells in normal samples in each tissue plotted against the malignancy continuum. Samples are colored based on if they are from different disease stage. |
Top |
Malignant transformation related pathway analysis |
| Find out the enriched GO biological processes and KEGG pathways involved in transition from healthy to precancer to cancer |
| Tissue | Disease Stage | Enriched GO biological Processes |
| Colorectum | AD |  |
| Colorectum | SER |  |
| Colorectum | MSS |  |
| Colorectum | MSI-H |  |
| Colorectum | FAP |  |
| ∗Top 15 enriched GO BP terms are showed in the bar plot of each disease state in each tissue. Each row represents a significant GO biological process which is colored according to the -log10(p.adjust). |
| Page: 1 2 3 4 5 6 7 8 9 |
| GO ID | Tissue | Disease Stage | Description | Gene Ratio | Bg Ratio | pvalue | p.adjust | Count |
| Page: 1 |
| Pathway ID | Tissue | Disease Stage | Description | Gene Ratio | Bg Ratio | pvalue | p.adjust | qvalue | Count |
| Page: 1 |
Top |
Cell-cell communication analysis |
| Identification of potential cell-cell interactions between two cell types and their ligand-receptor pairs for different disease states |
| Ligand | Receptor | LRpair | Pathway | Tissue | Disease Stage |
| Page: 1 |
Top |
Single-cell gene regulatory network inference analysis |
| Find out the significant the regulons (TFs) and the target genes of each regulon across cell types for different disease states |
| TF | Cell Type | Tissue | Disease Stage | Target Gene | RSS | Regulon Activity |
| ∗The dot plots of a searched regulon are shown for all cell subpopulations in each disease state of each tissue based on the regulon specific score inferred using pySCENIC and by calculating the average expression. |
| Page: 1 |
Top |
Somatic mutation of malignant transformation related genes |
| Annotation of somatic variants for genes involved in malignant transformation |
| Hugo Symbol | Variant Class | Variant Classification | dbSNP RS | HGVSc | HGVSp | HGVSp Short | SWISSPROT | BIOTYPE | SIFT | PolyPhen | Tumor Sample Barcode | Tissue | Histology | Sex | Age | Stage | Therapy Types | Drugs | Outcome |
| PAMR1 | SNV | Missense_Mutation | c.1788N>G | p.Ile596Met | p.I596M | Q6UXH9 | protein_coding | deleterious(0) | benign(0.366) | TCGA-A2-A0EQ-01 | Breast | breast invasive carcinoma | Female | <65 | I/II | Chemotherapy | adriamycin | SD | |
| PAMR1 | SNV | Missense_Mutation | c.2071N>T | p.Pro691Ser | p.P691S | Q6UXH9 | protein_coding | tolerated(0.18) | possibly_damaging(0.796) | TCGA-B6-A0RL-01 | Breast | breast invasive carcinoma | Female | <65 | I/II | Unknown | Unknown | SD | |
| PAMR1 | SNV | Missense_Mutation | rs763793747 | c.1363N>T | p.Arg455Trp | p.R455W | Q6UXH9 | protein_coding | deleterious(0) | probably_damaging(0.994) | TCGA-BH-A18G-01 | Breast | breast invasive carcinoma | Female | >=65 | I/II | Unknown | Unknown | SD |
| PAMR1 | SNV | Missense_Mutation | rs146022451 | c.91G>A | p.Glu31Lys | p.E31K | Q6UXH9 | protein_coding | deleterious(0.02) | possibly_damaging(0.57) | TCGA-BH-A18P-01 | Breast | breast invasive carcinoma | Female | <65 | I/II | Unknown | Unknown | PD |
| PAMR1 | SNV | Missense_Mutation | c.1074N>G | p.Ile358Met | p.I358M | Q6UXH9 | protein_coding | tolerated(0.2) | benign(0.366) | TCGA-E2-A1LG-01 | Breast | breast invasive carcinoma | Female | <65 | I/II | Chemotherapy | doxorubicin | SD | |
| PAMR1 | SNV | Missense_Mutation | novel | c.1429N>G | p.Leu477Val | p.L477V | Q6UXH9 | protein_coding | tolerated(0.1) | benign(0.007) | TCGA-OK-A5Q2-01 | Breast | breast invasive carcinoma | Female | <65 | I/II | Unknown | Unknown | SD |
| PAMR1 | insertion | Nonsense_Mutation | novel | c.866_867insTACACAAATTGTAGCCCTTTAAT | p.Leu289PhefsTer8 | p.L289Ffs*8 | Q6UXH9 | protein_coding | TCGA-A2-A0EY-01 | Breast | breast invasive carcinoma | Female | <65 | I/II | Chemotherapy | adriamycin | SD | ||
| PAMR1 | insertion | Frame_Shift_Ins | novel | c.1661_1662insTCTTAACAAATTTACAATATATGTCTGTCTTTCCCTGACT | p.Ile555LeufsTer29 | p.I555Lfs*29 | Q6UXH9 | protein_coding | TCGA-AN-A0FX-01 | Breast | breast invasive carcinoma | Female | <65 | I/II | Unknown | Unknown | SD | ||
| PAMR1 | insertion | Frame_Shift_Ins | rs751755759 | c.302_303insG | p.Thr102TyrfsTer4 | p.T102Yfs*4 | Q6UXH9 | protein_coding | TCGA-AN-A0FY-01 | Breast | breast invasive carcinoma | Female | <65 | I/II | Unknown | Unknown | SD | ||
| PAMR1 | SNV | Missense_Mutation | rs368802780 | c.1903N>T | p.Arg635Cys | p.R635C | Q6UXH9 | protein_coding | deleterious(0) | possibly_damaging(0.629) | TCGA-2W-A8YY-01 | Cervix | cervical & endocervical cancer | Female | <65 | I/II | Chemotherapy | cisplatin | CR |
| Page: 1 2 3 4 5 6 7 8 9 10 11 |
Top |
Related drugs of malignant transformation related genes |
| Identification of chemicals and drugs interact with genes involved in malignant transfromation |
| (DGIdb 4.0) |
| Entrez ID | Symbol | Category | Interaction Types | Drug Claim Name | Drug Name | PMIDs |
| Page: 1 |

Copyright 2023-Present -The University of Texas Health Science Center at Houston |