
|
|||||
|
 | |
| |
| |
| |
| |
| |
|
Gene: PAM16 |
Gene summary for PAM16 |
| Gene information | Species | Human | Gene symbol | PAM16 | Gene ID | 51025 |
| Gene name | presequence translocase associated motor 16 | |
| Gene Alias | CGI-136 | |
| Cytomap | 16p13.3 | |
| Gene Type | protein-coding | GO ID | GO:0000737 | UniProtAcc | Q9Y3D7 |
Top |
Malignant transformation analysis |
| Identification of the aberrant gene expression in precancerous and cancerous lesions by comparing the gene expression of stem-like cells in diseased tissues with normal stem cells |
| Entrez ID | Symbol | Replicates | Species | Organ | Tissue | Adj P-value | Log2FC | Malignancy |
| 51025 | PAM16 | LZE2D | Human | Esophagus | HGIN | 3.04e-02 | 3.05e-01 | 0.0642 |
| 51025 | PAM16 | LZE2T | Human | Esophagus | ESCC | 7.48e-04 | 8.76e-01 | 0.082 |
| 51025 | PAM16 | LZE4T | Human | Esophagus | ESCC | 2.02e-14 | 4.49e-01 | 0.0811 |
| 51025 | PAM16 | LZE5T | Human | Esophagus | ESCC | 1.21e-07 | 5.45e-01 | 0.0514 |
| 51025 | PAM16 | LZE7T | Human | Esophagus | ESCC | 4.78e-21 | 8.52e-01 | 0.0667 |
| 51025 | PAM16 | LZE8T | Human | Esophagus | ESCC | 4.86e-17 | 5.17e-01 | 0.067 |
| 51025 | PAM16 | LZE20T | Human | Esophagus | ESCC | 6.52e-15 | 4.91e-01 | 0.0662 |
| 51025 | PAM16 | LZE21D1 | Human | Esophagus | HGIN | 3.15e-02 | 5.26e-01 | 0.0632 |
| 51025 | PAM16 | LZE22D1 | Human | Esophagus | HGIN | 7.46e-10 | 3.26e-01 | 0.0595 |
| 51025 | PAM16 | LZE22T | Human | Esophagus | ESCC | 1.51e-07 | 6.57e-01 | 0.068 |
| 51025 | PAM16 | LZE24T | Human | Esophagus | ESCC | 2.53e-44 | 9.63e-01 | 0.0596 |
| 51025 | PAM16 | LZE21T | Human | Esophagus | ESCC | 2.99e-11 | 6.23e-01 | 0.0655 |
| 51025 | PAM16 | LZE6T | Human | Esophagus | ESCC | 8.98e-16 | 6.45e-01 | 0.0845 |
| 51025 | PAM16 | P1T-E | Human | Esophagus | ESCC | 6.98e-24 | 8.46e-01 | 0.0875 |
| 51025 | PAM16 | P2T-E | Human | Esophagus | ESCC | 5.94e-62 | 9.88e-01 | 0.1177 |
| 51025 | PAM16 | P4T-E | Human | Esophagus | ESCC | 6.27e-50 | 1.09e+00 | 0.1323 |
| 51025 | PAM16 | P5T-E | Human | Esophagus | ESCC | 1.67e-63 | 1.18e+00 | 0.1327 |
| 51025 | PAM16 | P8T-E | Human | Esophagus | ESCC | 8.11e-31 | 6.00e-01 | 0.0889 |
| 51025 | PAM16 | P9T-E | Human | Esophagus | ESCC | 1.43e-34 | 7.66e-01 | 0.1131 |
| 51025 | PAM16 | P10T-E | Human | Esophagus | ESCC | 2.78e-38 | 5.52e-01 | 0.116 |
| Page: 1 2 3 4 |
| Tissue | Expression Dynamics | Abbreviation |
| Esophagus | 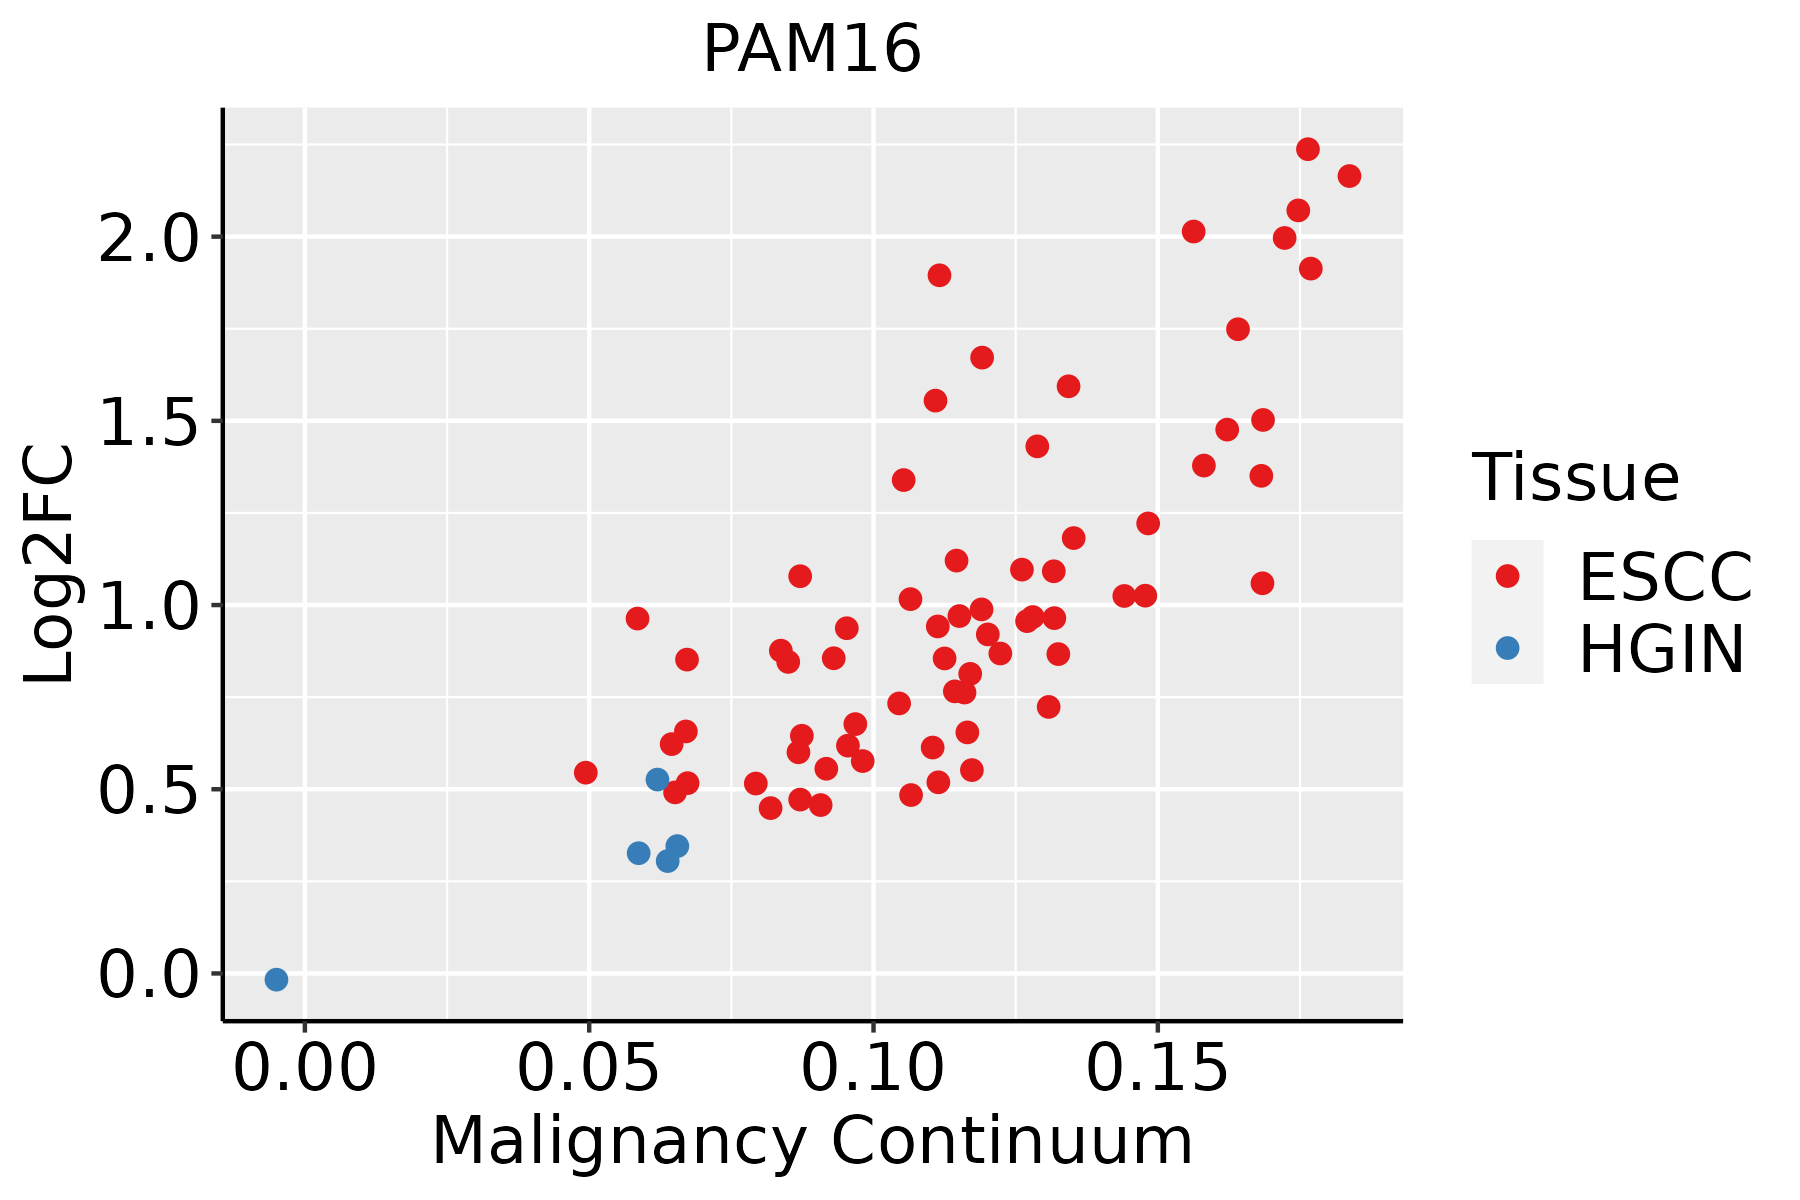 | ESCC: Esophageal squamous cell carcinoma |
| HGIN: High-grade intraepithelial neoplasias | ||
| LGIN: Low-grade intraepithelial neoplasias | ||
| Liver | 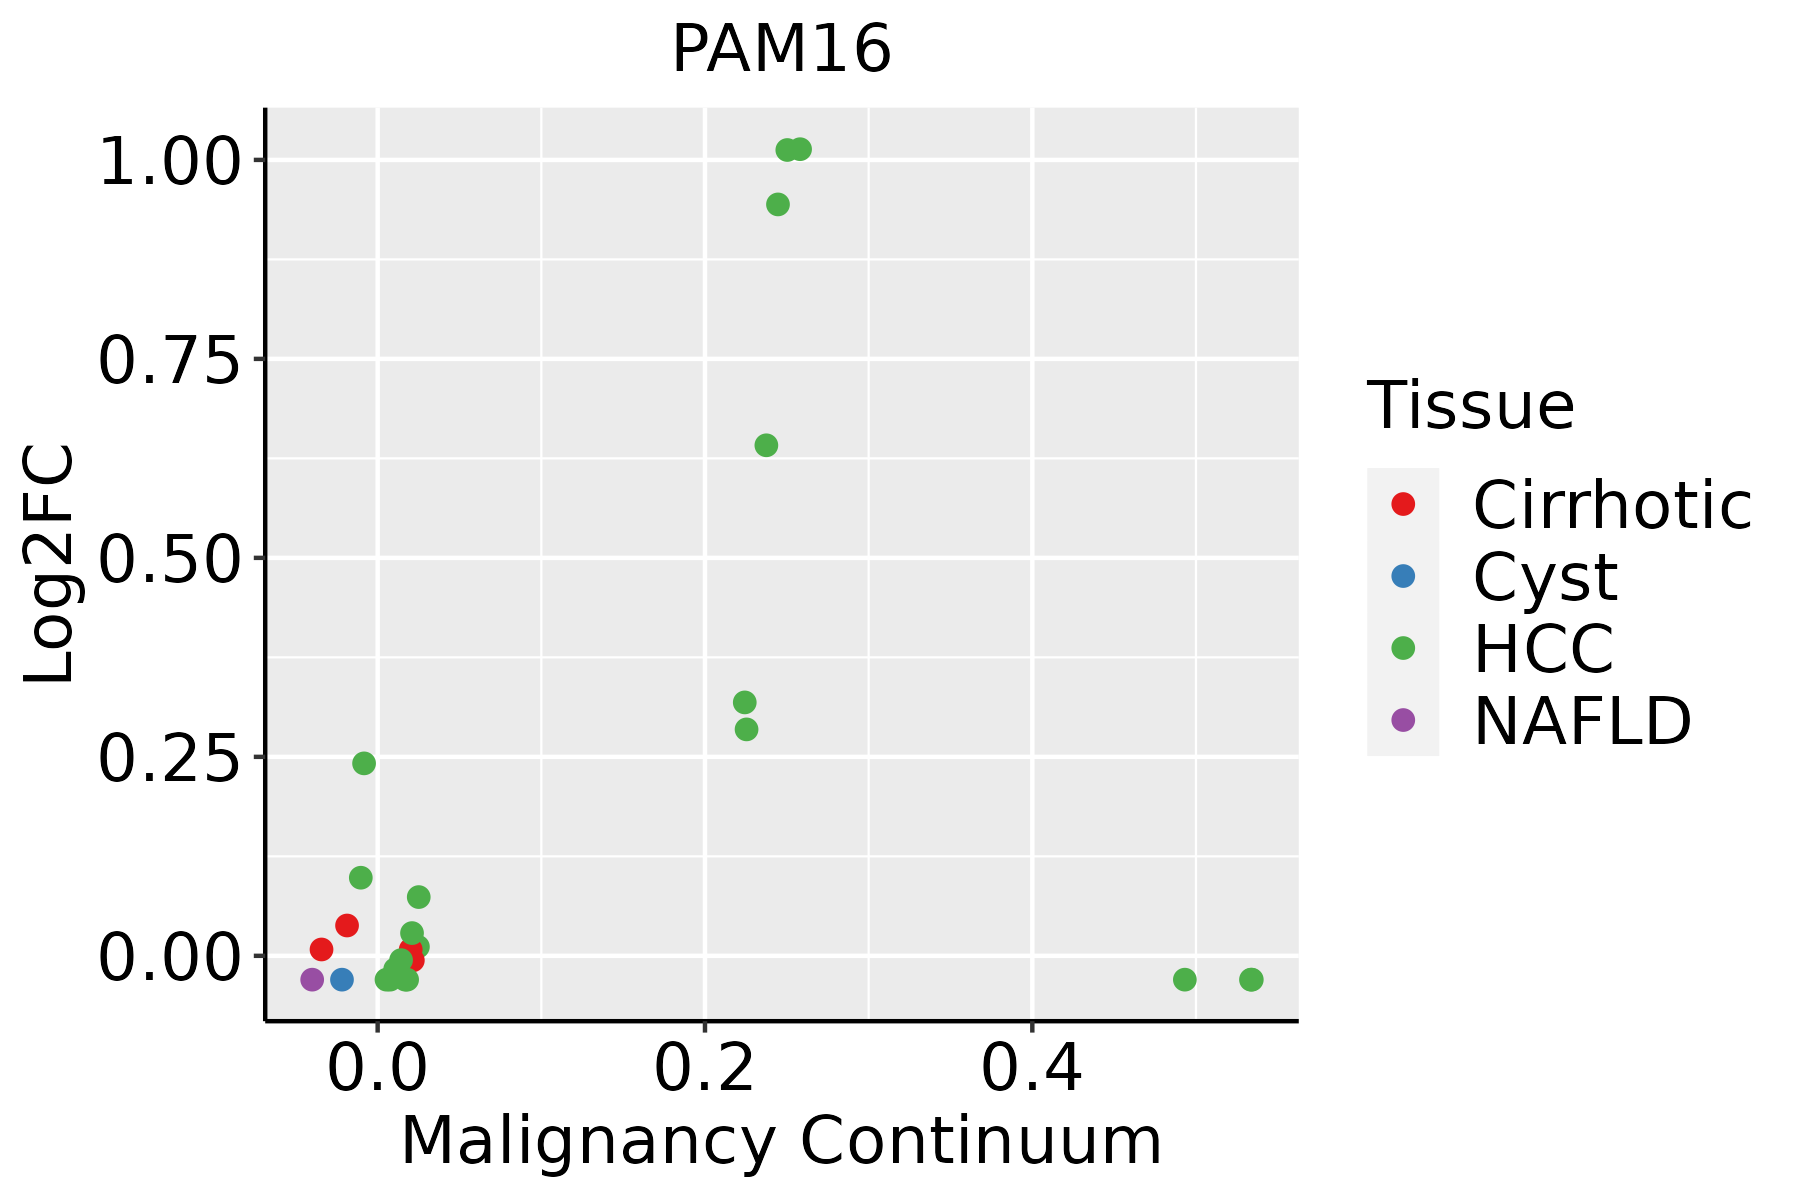 | HCC: Hepatocellular carcinoma |
| NAFLD: Non-alcoholic fatty liver disease |
| ∗log2FC in expression of this searched gene in stem-like cells from each diseased tissue sample relative to stem-like cells in normal samples in each tissue plotted against the malignancy continuum. Samples are colored based on if they are from different disease stage. |
Top |
Malignant transformation related pathway analysis |
| Find out the enriched GO biological processes and KEGG pathways involved in transition from healthy to precancer to cancer |
| Tissue | Disease Stage | Enriched GO biological Processes |
| Colorectum | AD |  |
| Colorectum | SER |  |
| Colorectum | MSS |  |
| Colorectum | MSI-H |  |
| Colorectum | FAP |  |
| ∗Top 15 enriched GO BP terms are showed in the bar plot of each disease state in each tissue. Each row represents a significant GO biological process which is colored according to the -log10(p.adjust). |
| Page: 1 2 3 4 5 6 7 8 9 |
| GO ID | Tissue | Disease Stage | Description | Gene Ratio | Bg Ratio | pvalue | p.adjust | Count |
| GO:007259420 | Esophagus | HGIN | establishment of protein localization to organelle | 120/2587 | 422/18723 | 1.73e-15 | 4.00e-13 | 120 |
| GO:200123327 | Esophagus | HGIN | regulation of apoptotic signaling pathway | 97/2587 | 356/18723 | 1.36e-11 | 1.57e-09 | 97 |
| GO:000683920 | Esophagus | HGIN | mitochondrial transport | 74/2587 | 254/18723 | 1.32e-10 | 1.32e-08 | 74 |
| GO:000989520 | Esophagus | HGIN | negative regulation of catabolic process | 87/2587 | 320/18723 | 1.74e-10 | 1.68e-08 | 87 |
| GO:003133026 | Esophagus | HGIN | negative regulation of cellular catabolic process | 74/2587 | 262/18723 | 6.27e-10 | 5.30e-08 | 74 |
| GO:007058520 | Esophagus | HGIN | protein localization to mitochondrion | 43/2587 | 125/18723 | 4.43e-09 | 3.03e-07 | 43 |
| GO:007265520 | Esophagus | HGIN | establishment of protein localization to mitochondrion | 41/2587 | 120/18723 | 1.26e-08 | 7.96e-07 | 41 |
| GO:003465519 | Esophagus | HGIN | nucleobase-containing compound catabolic process | 98/2587 | 407/18723 | 1.44e-08 | 8.94e-07 | 98 |
| GO:004670017 | Esophagus | HGIN | heterocycle catabolic process | 103/2587 | 445/18723 | 5.44e-08 | 2.99e-06 | 103 |
| GO:002241120 | Esophagus | HGIN | cellular component disassembly | 102/2587 | 443/18723 | 8.31e-08 | 4.33e-06 | 102 |
| GO:000660525 | Esophagus | HGIN | protein targeting | 78/2587 | 314/18723 | 1.08e-07 | 5.47e-06 | 78 |
| GO:004427018 | Esophagus | HGIN | cellular nitrogen compound catabolic process | 103/2587 | 451/18723 | 1.10e-07 | 5.56e-06 | 103 |
| GO:001943917 | Esophagus | HGIN | aromatic compound catabolic process | 105/2587 | 467/18723 | 1.89e-07 | 9.31e-06 | 105 |
| GO:200123427 | Esophagus | HGIN | negative regulation of apoptotic signaling pathway | 59/2587 | 224/18723 | 4.68e-07 | 2.07e-05 | 59 |
| GO:000662620 | Esophagus | HGIN | protein targeting to mitochondrion | 33/2587 | 100/18723 | 7.99e-07 | 3.35e-05 | 33 |
| GO:001082119 | Esophagus | HGIN | regulation of mitochondrion organization | 42/2587 | 144/18723 | 1.20e-06 | 4.68e-05 | 42 |
| GO:190136117 | Esophagus | HGIN | organic cyclic compound catabolic process | 106/2587 | 495/18723 | 1.94e-06 | 7.13e-05 | 106 |
| GO:001063920 | Esophagus | HGIN | negative regulation of organelle organization | 79/2587 | 348/18723 | 4.12e-06 | 1.37e-04 | 79 |
| GO:000863720 | Esophagus | HGIN | apoptotic mitochondrial changes | 33/2587 | 107/18723 | 4.32e-06 | 1.42e-04 | 33 |
| GO:005105214 | Esophagus | HGIN | regulation of DNA metabolic process | 79/2587 | 359/18723 | 1.38e-05 | 3.85e-04 | 79 |
| Page: 1 2 3 4 5 |
| Pathway ID | Tissue | Disease Stage | Description | Gene Ratio | Bg Ratio | pvalue | p.adjust | qvalue | Count |
| Page: 1 |
Top |
Cell-cell communication analysis |
| Identification of potential cell-cell interactions between two cell types and their ligand-receptor pairs for different disease states |
| Ligand | Receptor | LRpair | Pathway | Tissue | Disease Stage |
| Page: 1 |
Top |
Single-cell gene regulatory network inference analysis |
| Find out the significant the regulons (TFs) and the target genes of each regulon across cell types for different disease states |
| TF | Cell Type | Tissue | Disease Stage | Target Gene | RSS | Regulon Activity |
| ∗The dot plots of a searched regulon are shown for all cell subpopulations in each disease state of each tissue based on the regulon specific score inferred using pySCENIC and by calculating the average expression. |
| Page: 1 |
Top |
Somatic mutation of malignant transformation related genes |
| Annotation of somatic variants for genes involved in malignant transformation |
| Hugo Symbol | Variant Class | Variant Classification | dbSNP RS | HGVSc | HGVSp | HGVSp Short | SWISSPROT | BIOTYPE | SIFT | PolyPhen | Tumor Sample Barcode | Tissue | Histology | Sex | Age | Stage | Therapy Types | Drugs | Outcome |
| PAM16 | SNV | Missense_Mutation | novel | c.337N>T | p.Ala113Ser | p.A113S | Q9Y3D7 | protein_coding | tolerated(0.32) | benign(0.011) | TCGA-E9-A295-01 | Breast | breast invasive carcinoma | Female | >=65 | I/II | Hormone Therapy | tamoxiphen | SD |
| PAM16 | SNV | Missense_Mutation | rs775983589 | c.299G>A | p.Arg100His | p.R100H | Q9Y3D7 | protein_coding | deleterious(0) | probably_damaging(0.995) | TCGA-MY-A5BF-01 | Cervix | cervical & endocervical cancer | Female | >=65 | I/II | Chemotherapy | cisplatin | CR |
| PAM16 | SNV | Missense_Mutation | rs774768218 | c.113N>A | p.Arg38Gln | p.R38Q | Q9Y3D7 | protein_coding | tolerated(0.6) | benign(0.075) | TCGA-CM-6674-01 | Colorectum | colon adenocarcinoma | Male | <65 | I/II | Unknown | Unknown | SD |
| PAM16 | SNV | Missense_Mutation | rs143616972 | c.121N>A | p.Ala41Thr | p.A41T | Q9Y3D7 | protein_coding | tolerated(0.25) | benign(0.009) | TCGA-AJ-A2QO-01 | Endometrium | uterine corpus endometrioid carcinoma | Female | >=65 | I/II | Unknown | Unknown | SD |
| PAM16 | SNV | Missense_Mutation | novel | c.229N>C | p.Tyr77His | p.Y77H | Q9Y3D7 | protein_coding | deleterious(0.01) | probably_damaging(0.992) | TCGA-AJ-A3EK-01 | Endometrium | uterine corpus endometrioid carcinoma | Female | <65 | I/II | Chemotherapy | carboplatin | CR |
| PAM16 | SNV | Missense_Mutation | c.330N>C | p.Lys110Asn | p.K110N | Q9Y3D7 | protein_coding | deleterious(0.04) | benign(0.231) | TCGA-AP-A0LM-01 | Endometrium | uterine corpus endometrioid carcinoma | Female | <65 | III/IV | Chemotherapy | cisplatin | SD | |
| PAM16 | SNV | Missense_Mutation | rs563328958 | c.301N>A | p.Ala101Thr | p.A101T | Q9Y3D7 | protein_coding | deleterious(0) | probably_damaging(0.996) | TCGA-AX-A2HD-01 | Endometrium | uterine corpus endometrioid carcinoma | Female | >=65 | III/IV | Unknown | Unknown | SD |
| PAM16 | SNV | Missense_Mutation | rs771420576 | c.115N>A | p.Gly39Arg | p.G39R | Q9Y3D7 | protein_coding | deleterious(0.04) | probably_damaging(0.914) | TCGA-B5-A3FC-01 | Endometrium | uterine corpus endometrioid carcinoma | Female | <65 | I/II | Unknown | Unknown | SD |
| PAM16 | SNV | Missense_Mutation | c.5N>T | p.Ala2Val | p.A2V | Q9Y3D7 | protein_coding | deleterious(0) | probably_damaging(1) | TCGA-BG-A0VW-01 | Endometrium | uterine corpus endometrioid carcinoma | Female | >=65 | I/II | Unknown | Unknown | SD | |
| PAM16 | SNV | Missense_Mutation | novel | c.342G>T | p.Gln114His | p.Q114H | Q9Y3D7 | protein_coding | tolerated(0.09) | benign(0.018) | TCGA-BG-A220-01 | Endometrium | uterine corpus endometrioid carcinoma | Female | >=65 | I/II | Unknown | Unknown | SD |
| Page: 1 2 |
Top |
Related drugs of malignant transformation related genes |
| Identification of chemicals and drugs interact with genes involved in malignant transfromation |
| (DGIdb 4.0) |
| Entrez ID | Symbol | Category | Interaction Types | Drug Claim Name | Drug Name | PMIDs |
| Page: 1 |

Copyright 2023-Present -The University of Texas Health Science Center at Houston |