Schematic overview of the cellular and molecular mechanisms involved in the cancer progression, including the proposed cellular and molecular mechanisms in cancer cells trajectory. AT1: alveolar type 1 cells; AT2: alveolar type 2 cells; AAH: atypical adenomatous hyperplasia; AIS: adenocarcinoma in situ; MIA: minimally invasive adenocarcinoma; IA: invasive adenocarcinoma; EMT: epithelial-mesenchymal transition

Home

Download

Statistics

Help

Contact

Center for Computational Systems Medicine
leaf

Gene summary

leaf

Malignant transformation analysis

leaf

Malignant transformation related pathway analysis

leaf

Cell-cell communication analysis

leaf

Single-cell gene regulatory network inference analysis

leaf

Somatic mutation of malignant transformation related genes

leaf

Related drugs of malignant transformation related genes

Gene: PAM

Gene summary for PAM

check button Gene summary.

Gene informationSpeciesHuman
Gene symbol

PAM

Gene ID

5066

Gene namepeptidylglycine alpha-amidating monooxygenase
Gene AliasPAL
Cytomap5q21.1
Gene Typeprotein-coding
GO ID

GO:0000003

UniProtAcc

P19021


Top

Malignant transformation analysis

check button Identification of the aberrant gene expression in precancerous and cancerous lesions by comparing the gene expression of stem-like cells in diseased tissues with normal stem cells
check button Malignant transformation involving gene list.
Entrez IDSymbolReplicatesSpeciesOrganTissueAdj P-valueLog2FCMalignancy
5066PAMGSM4909281HumanBreastIDC4.72e-267.25e-010.21
5066PAMGSM4909285HumanBreastIDC1.30e-206.12e-010.21
5066PAMGSM4909286HumanBreastIDC3.52e-11-1.61e-010.1081
5066PAMGSM4909287HumanBreastIDC9.18e-033.09e-010.2057
5066PAMGSM4909290HumanBreastIDC3.17e-04-1.62e-010.2096
5066PAMGSM4909294HumanBreastIDC6.42e-09-1.43e-010.2022
5066PAMGSM4909296HumanBreastIDC5.78e-03-2.23e-030.1524
5066PAMGSM4909297HumanBreastIDC2.74e-03-1.19e-010.1517
5066PAMGSM4909301HumanBreastIDC2.79e-03-1.08e-010.1577
5066PAMGSM4909304HumanBreastIDC2.24e-02-1.18e-010.1636
5066PAMGSM4909308HumanBreastIDC3.04e-094.15e-010.158
5066PAMGSM4909311HumanBreastIDC4.84e-12-6.92e-030.1534
5066PAMGSM4909312HumanBreastIDC1.09e-03-5.47e-020.1552
5066PAMGSM4909315HumanBreastIDC2.51e-08-1.51e-010.21
5066PAMGSM4909319HumanBreastIDC8.04e-10-1.59e-010.1563
5066PAMGSM4909321HumanBreastIDC5.17e-054.83e-020.1559
5066PAMNCCBC14HumanBreastDCIS4.04e-02-1.36e-010.2021
5066PAMNCCBC5HumanBreastDCIS2.12e-03-1.45e-010.2046
5066PAMP1HumanBreastIDC4.05e-03-1.49e-010.1527
5066PAMDCIS2HumanBreastDCIS9.75e-503.99e-010.0085
Page: 1 2 3 4 5 6 7 8 9 

check button Transcriptomic changes along malignancy continuum.
TissueExpression DynamicsAbbreviation
BreastThe image shows the transcriptomic changes along malignancy continuum.log2FC in expression of this searched gene in stem-like cells from each diseased tissue sample relative to stem-like cells in normal samples in each tissue plotted against the malignancy continuum. Samples are colored based on if they are from different disease stage.
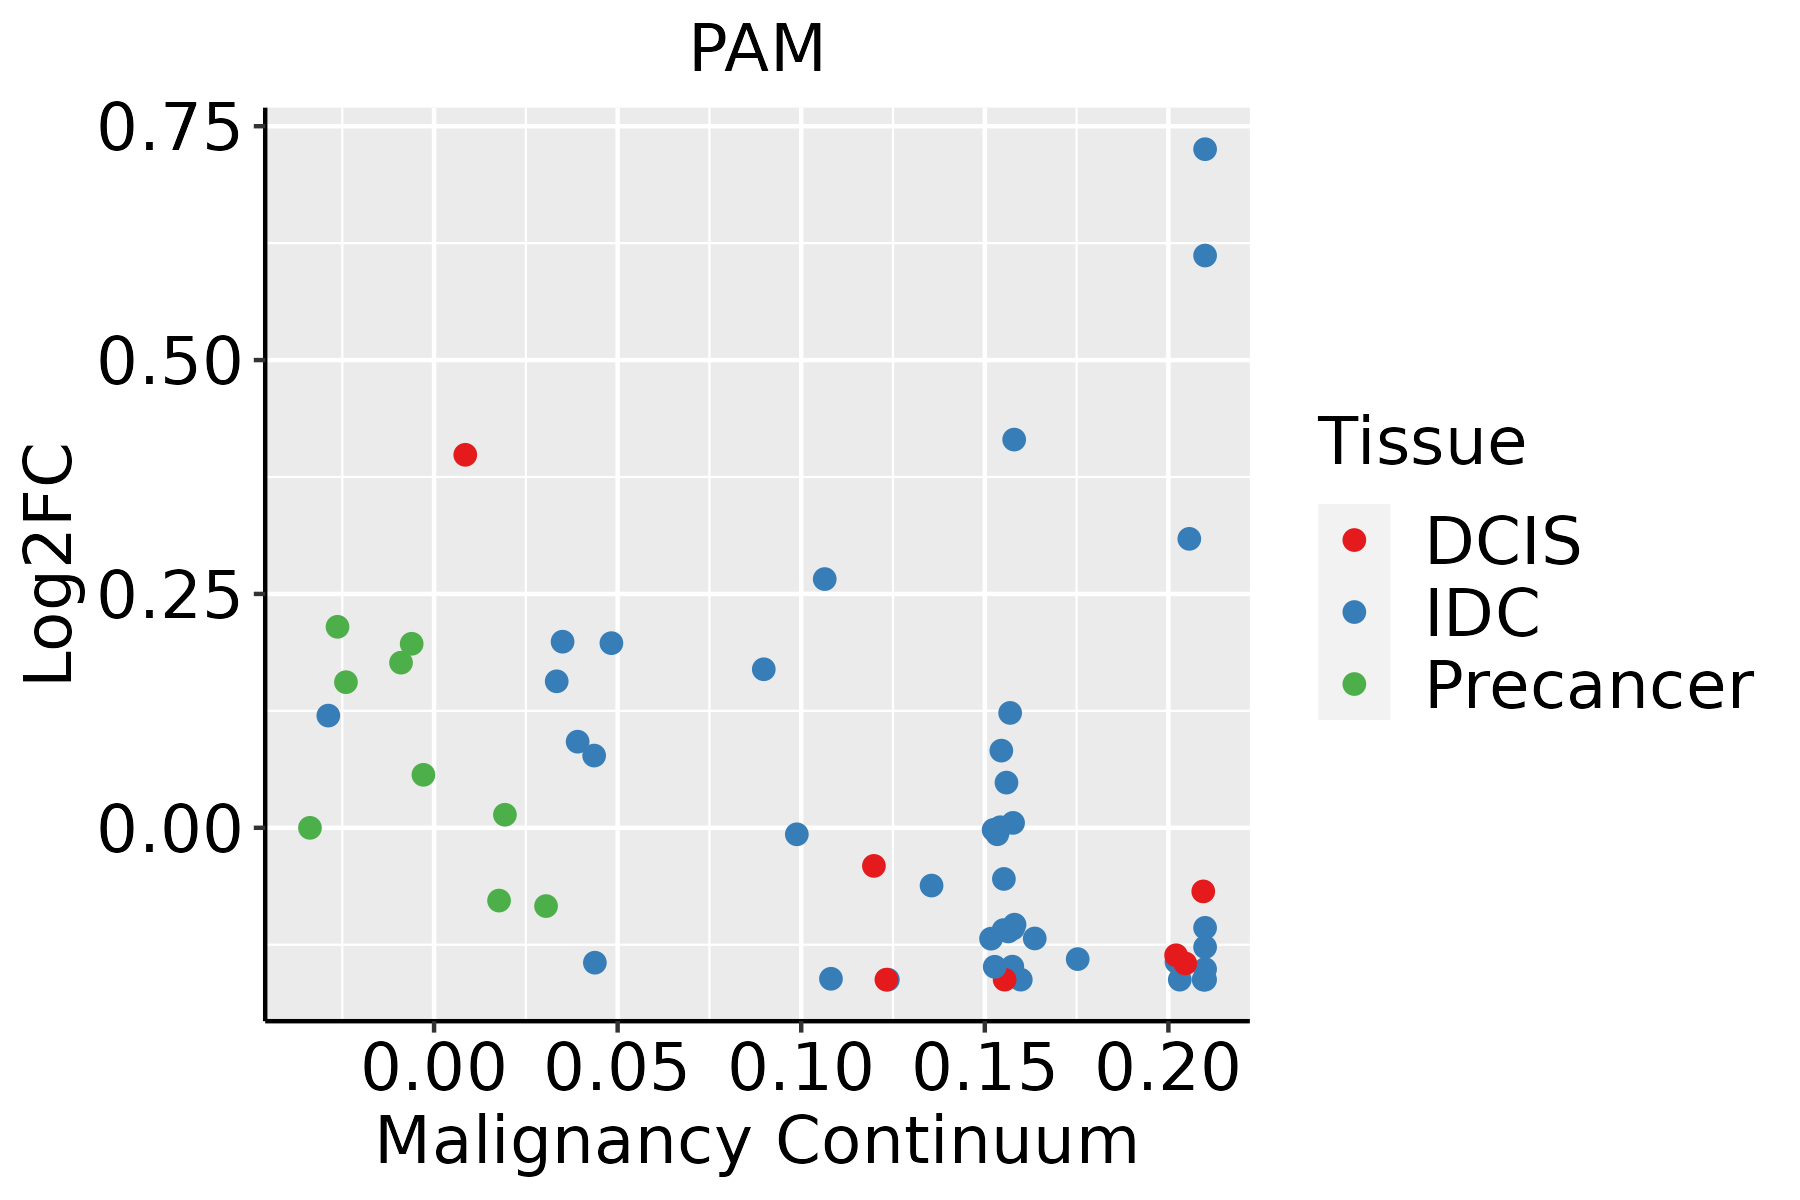
IDC: Invasive ductal carcinoma
DCIS: Ductal carcinoma in situ
Precancer(BRCA1-mut): Precancerous lesion from BRCA1 mutation carriers
CervixThe image shows the transcriptomic changes along malignancy continuum.log2FC in expression of this searched gene in stem-like cells from each diseased tissue sample relative to stem-like cells in normal samples in each tissue plotted against the malignancy continuum. Samples are colored based on if they are from different disease stage.CC: Cervix cancer
HSIL_HPV: HPV-infected high-grade squamous intraepithelial lesions
N_HPV: HPV-infected normal cervix
EndometriumThe image shows the transcriptomic changes along malignancy continuum.log2FC in expression of this searched gene in stem-like cells from each diseased tissue sample relative to stem-like cells in normal samples in each tissue plotted against the malignancy continuum. Samples are colored based on if they are from different disease stage.
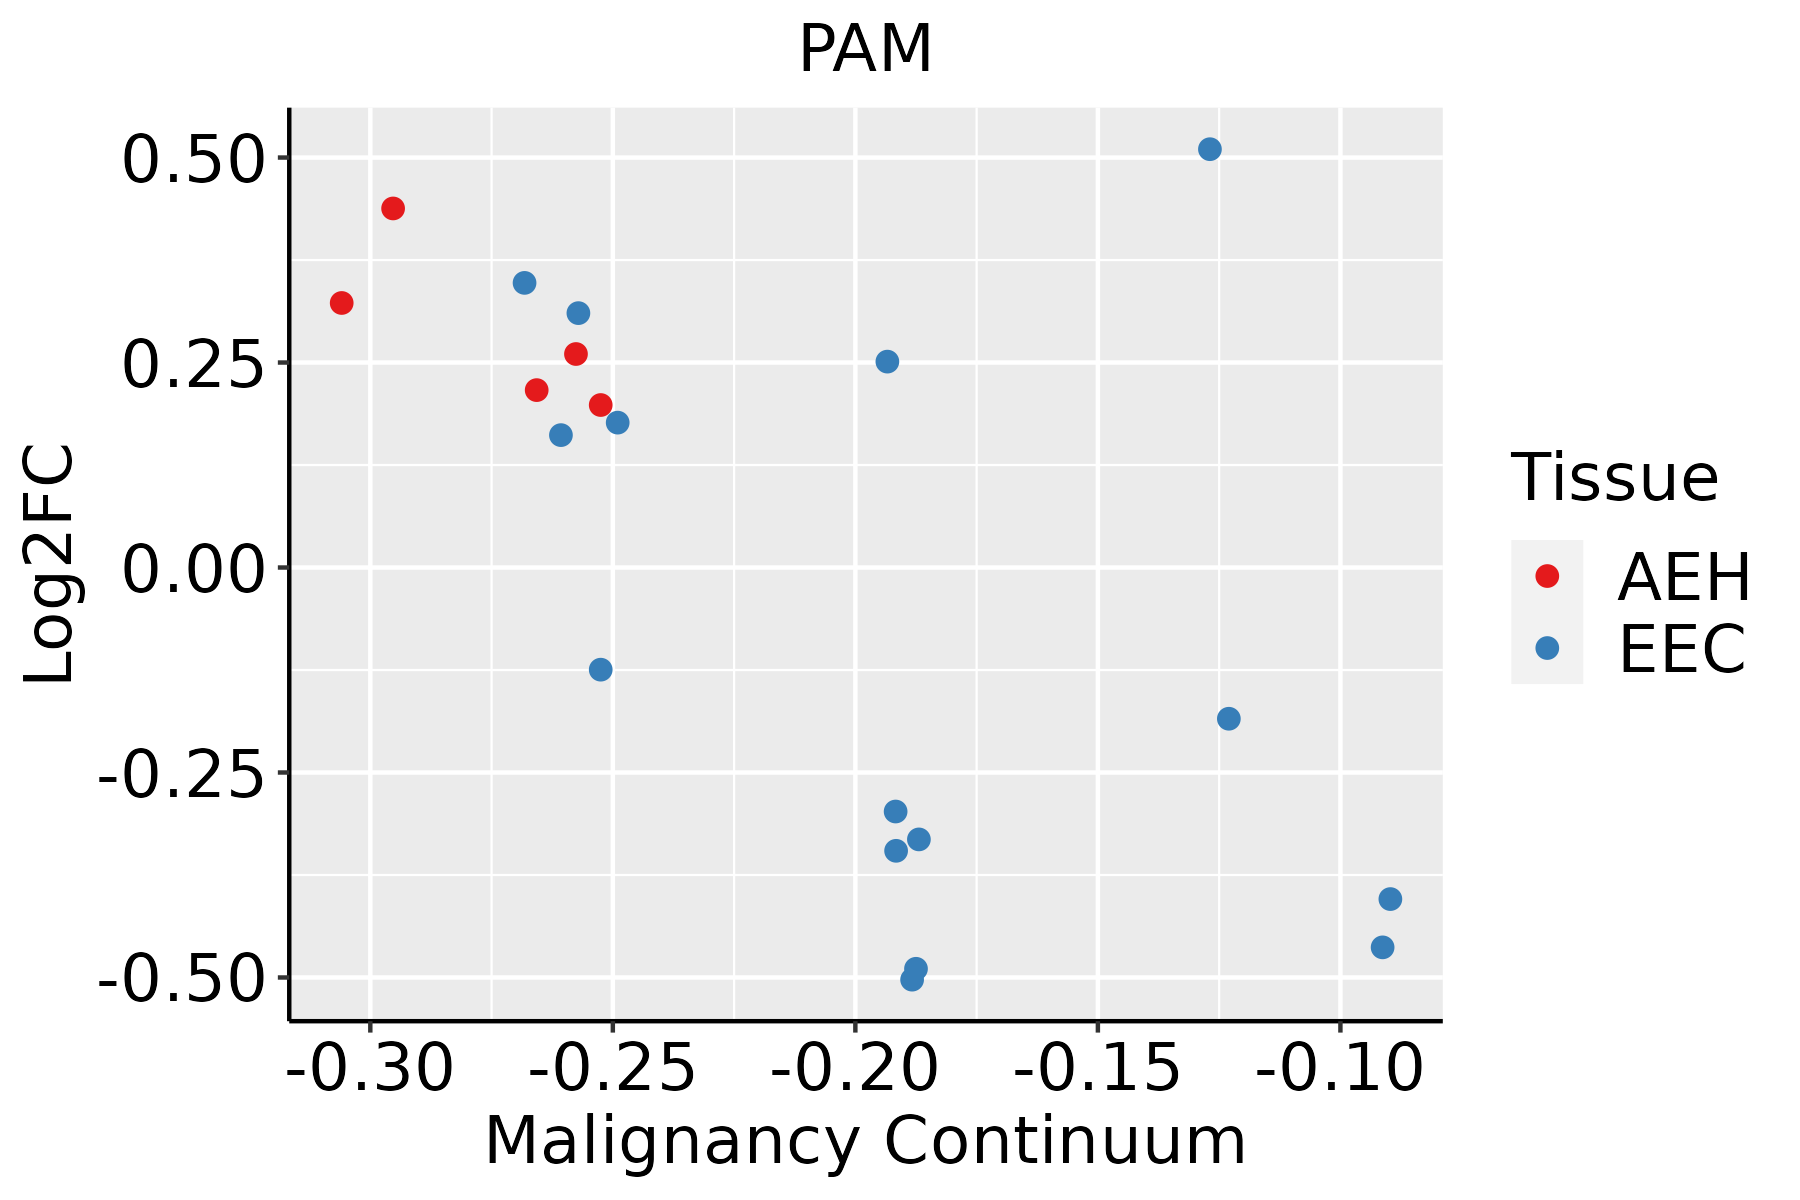
AEH: Atypical endometrial hyperplasia
EEC: Endometrioid Cancer
EsophagusThe image shows the transcriptomic changes along malignancy continuum.log2FC in expression of this searched gene in stem-like cells from each diseased tissue sample relative to stem-like cells in normal samples in each tissue plotted against the malignancy continuum. Samples are colored based on if they are from different disease stage.ESCC: Esophageal squamous cell carcinoma
HGIN: High-grade intraepithelial neoplasias
LGIN: Low-grade intraepithelial neoplasias
LiverThe image shows the transcriptomic changes along malignancy continuum.log2FC in expression of this searched gene in stem-like cells from each diseased tissue sample relative to stem-like cells in normal samples in each tissue plotted against the malignancy continuum. Samples are colored based on if they are from different disease stage.HCC: Hepatocellular carcinoma
NAFLD: Non-alcoholic fatty liver disease
LungThe image shows the transcriptomic changes along malignancy continuum.log2FC in expression of this searched gene in stem-like cells from each diseased tissue sample relative to stem-like cells in normal samples in each tissue plotted against the malignancy continuum. Samples are colored based on if they are from different disease stage.
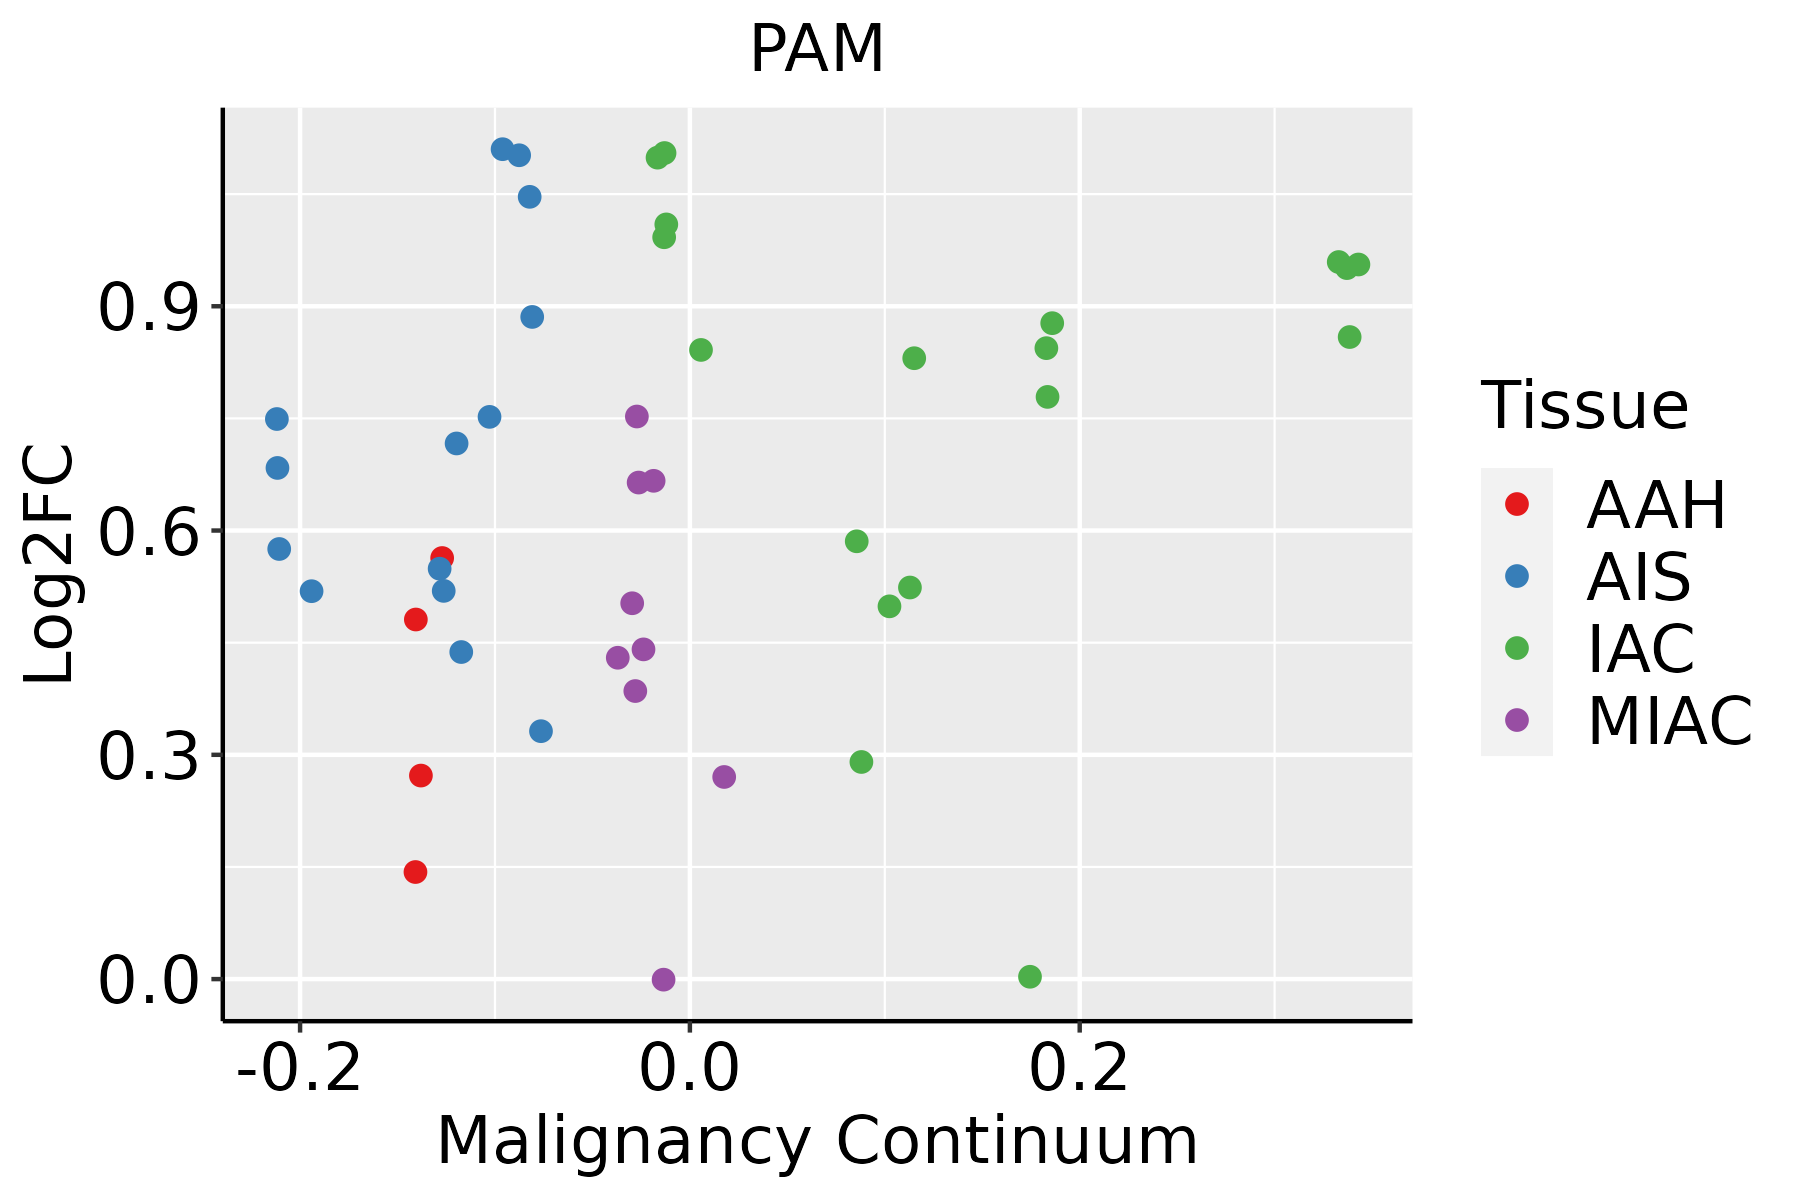
AAH: Atypical adenomatous hyperplasia
AIS: Adenocarcinoma in situ
IAC: Invasive lung adenocarcinoma
MIA: Minimally invasive adenocarcinoma
Oral CavityThe image shows the transcriptomic changes along malignancy continuum.log2FC in expression of this searched gene in stem-like cells from each diseased tissue sample relative to stem-like cells in normal samples in each tissue plotted against the malignancy continuum. Samples are colored based on if they are from different disease stage.EOLP: Erosive Oral lichen planus
LP: leukoplakia
NEOLP: Non-erosive oral lichen planus
OSCC: Oral squamous cell carcinoma
ProstateThe image shows the transcriptomic changes along malignancy continuum.log2FC in expression of this searched gene in stem-like cells from each diseased tissue sample relative to stem-like cells in normal samples in each tissue plotted against the malignancy continuum. Samples are colored based on if they are from different disease stage.
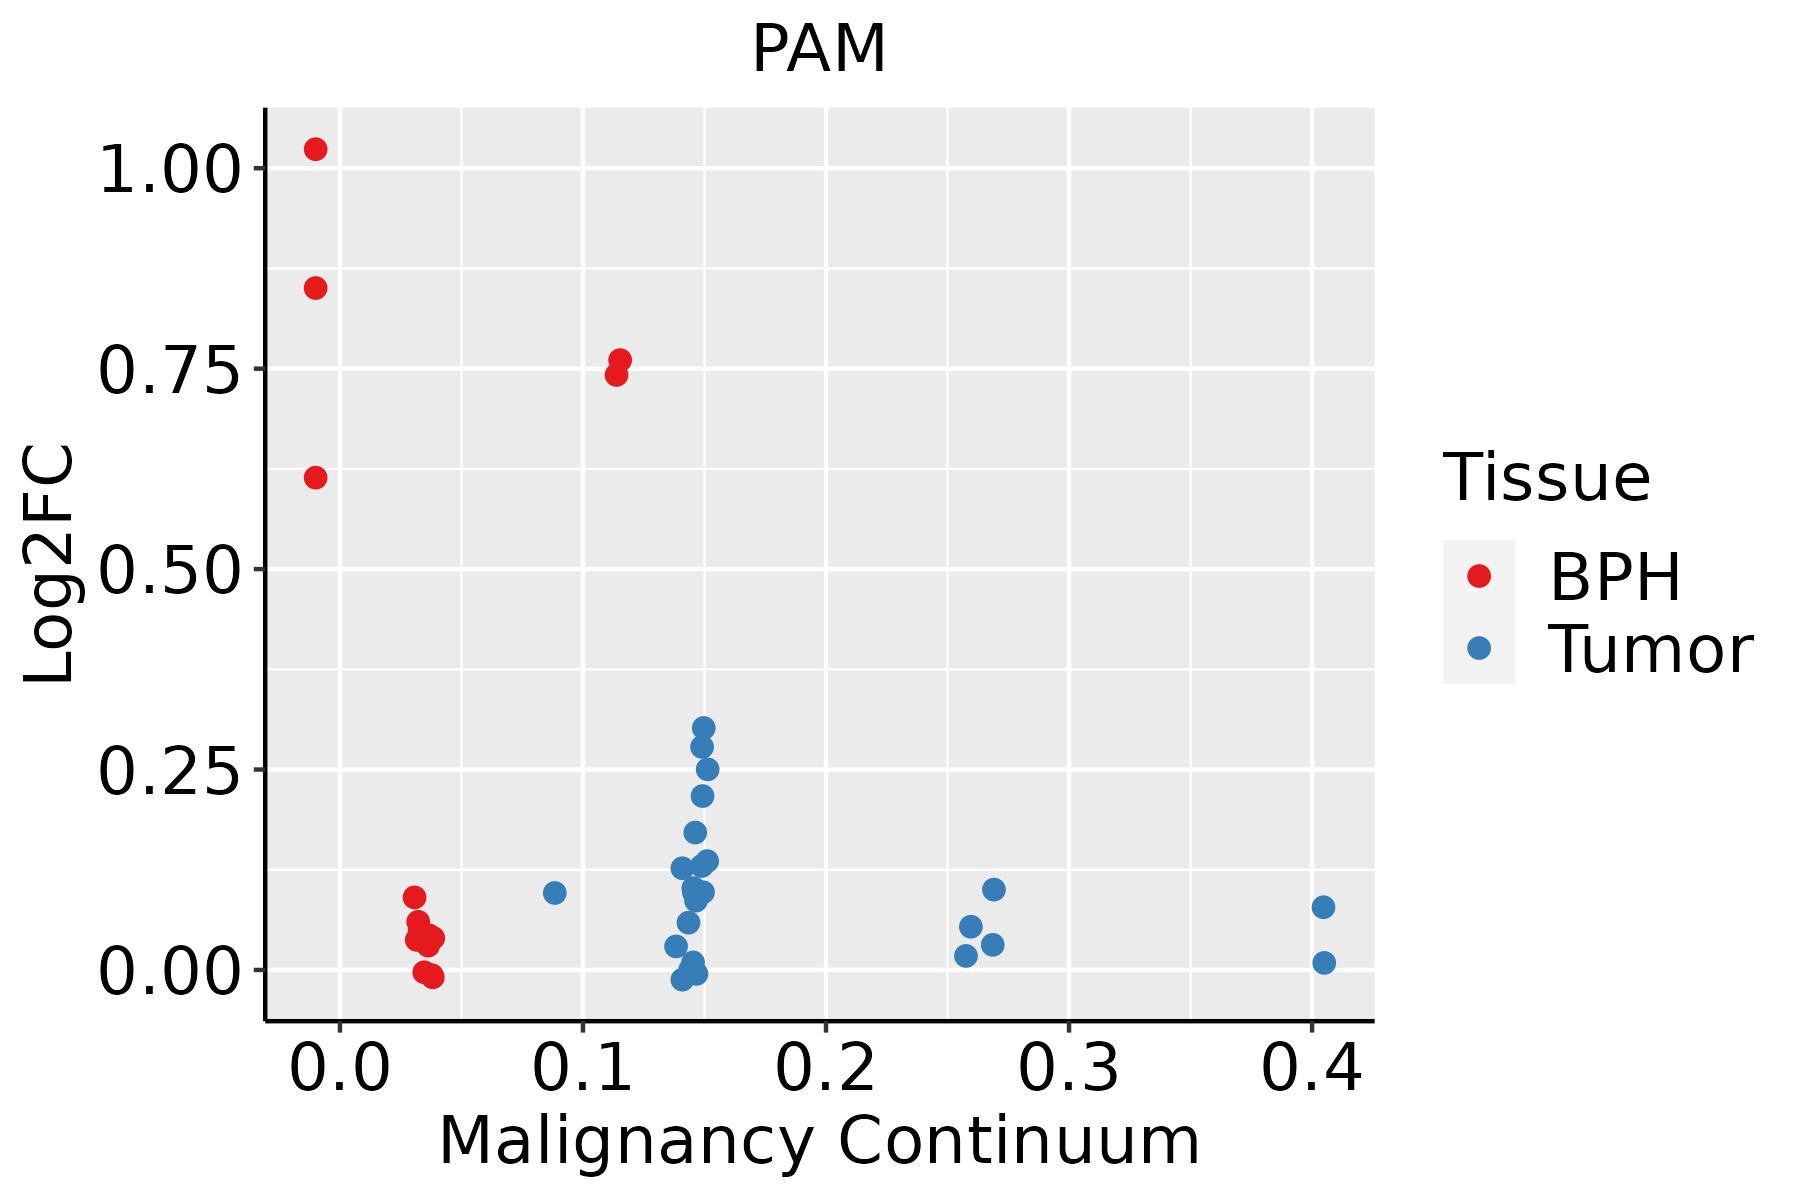
BPH: Benign Prostatic Hyperplasia
ThyroidThe image shows the transcriptomic changes along malignancy continuum.log2FC in expression of this searched gene in stem-like cells from each diseased tissue sample relative to stem-like cells in normal samples in each tissue plotted against the malignancy continuum. Samples are colored based on if they are from different disease stage.ATC: Anaplastic thyroid cancer
HT: Hashimoto's thyroiditis
PTC: Papillary thyroid cancer
∗log2FC in expression of this searched gene in stem-like cells from each diseased tissue sample relative to stem-like cells in normal samples in each tissue plotted against the malignancy continuum. Samples are colored based on if they are from different disease stage.

Top

Malignant transformation related pathway analysis

check buttonFind out the enriched GO biological processes and KEGG pathways involved in transition from healthy to precancer to cancer
check button Figure of enriched GO biological processes.
TissueDisease StageEnriched GO biological Processes
ColorectumADGO analysis - Figure of enriched GO biological processes: Top 15 enriched GO BP terms are showed in the bar plot of each disease state in each tissue. Each row represents a significant GO biological process which is colored according to the -log10(p.adjust).
ColorectumSERGO analysis - Figure of enriched GO biological processes: Top 15 enriched GO BP terms are showed in the bar plot of each disease state in each tissue. Each row represents a significant GO biological process which is colored according to the -log10(p.adjust).
ColorectumMSSGO analysis - Figure of enriched GO biological processes: Top 15 enriched GO BP terms are showed in the bar plot of each disease state in each tissue. Each row represents a significant GO biological process which is colored according to the -log10(p.adjust).
ColorectumMSI-HGO analysis - Figure of enriched GO biological processes: Top 15 enriched GO BP terms are showed in the bar plot of each disease state in each tissue. Each row represents a significant GO biological process which is colored according to the -log10(p.adjust).
ColorectumFAPGO analysis - Figure of enriched GO biological processes: Top 15 enriched GO BP terms are showed in the bar plot of each disease state in each tissue. Each row represents a significant GO biological process which is colored according to the -log10(p.adjust).
∗Top 15 enriched GO BP terms are showed in the bar plot of each disease state in each tissue. Each row represents a significant GO biological process which is colored according to the -log10(p.adjust).
Page: 1 2 3 4 5 6 7 8 9 

check button Enriched GO biological processes.
GO IDTissueDisease StageDescriptionGene RatioBg Ratiopvaluep.adjustCount
GO:004854514BreastIDCresponse to steroid hormone70/1434339/187231.34e-144.23e-1270
GO:007048214BreastIDCresponse to oxygen levels64/1434347/187233.45e-115.57e-0964
GO:003629314BreastIDCresponse to decreased oxygen levels60/1434322/187239.26e-111.25e-0860
GO:000166614BreastIDCresponse to hypoxia58/1434307/187231.09e-101.38e-0858
GO:001003814BreastIDCresponse to metal ion65/1434373/187232.95e-103.42e-0865
GO:003196013BreastIDCresponse to corticosteroid37/1434167/187233.10e-092.63e-0737
GO:000756511BreastIDCfemale pregnancy39/1434193/187231.81e-081.27e-0639
GO:005138413BreastIDCresponse to glucocorticoid32/1434148/187236.52e-084.07e-0632
GO:00447061BreastIDCmulti-multicellular organism process41/1434220/187238.58e-085.19e-0641
GO:004873214BreastIDCgland development64/1434436/187233.47e-071.74e-0564
GO:003297014BreastIDCregulation of actin filament-based process56/1434397/187236.37e-061.99e-0456
GO:003235512BreastIDCresponse to estradiol27/1434141/187237.87e-062.35e-0427
GO:000941013BreastIDCresponse to xenobiotic stimulus62/1434462/187231.05e-052.88e-0462
GO:00601352BreastIDCmaternal process involved in female pregnancy16/143462/187231.20e-053.17e-0416
GO:003295614BreastIDCregulation of actin cytoskeleton organization48/1434358/187231.03e-041.96e-0348
GO:005087813BreastIDCregulation of body fluid levels50/1434379/187231.12e-042.10e-0350
GO:003087911BreastIDCmammary gland development23/1434137/187232.87e-044.37e-0323
GO:001004311BreastIDCresponse to zinc ion13/143458/187233.59e-045.18e-0313
GO:005070812BreastIDCregulation of protein secretion36/1434268/187236.93e-048.50e-0336
GO:00466887BreastIDCresponse to copper ion10/143442/187231.03e-031.14e-0210
Page: 1 2 3 4 5 6 7 8 9 10 11 12 13 14 15 16 17 18 19 20 21 22 23 24 25 26 27 28 

check button Enriched KEGG pathways.
Pathway IDTissueDisease StageDescriptionGene RatioBg Ratiopvaluep.adjustqvalueCount
Page: 1 

Top

Cell-cell communication analysis

check buttonIdentification of potential cell-cell interactions between two cell types and their ligand-receptor pairs for different disease states
LigandReceptorLRpairPathwayTissueDisease Stage
Page: 1 

Top

Single-cell gene regulatory network inference analysis

check buttonFind out the significant the regulons (TFs) and the target genes of each regulon across cell types for different disease states
TFCell TypeTissueDisease StageTarget GeneRSSRegulon Activity
∗The dot plots of a searched regulon are shown for all cell subpopulations in each disease state of each tissue based on the regulon specific score inferred using pySCENIC and by calculating the average expression.
Page: 1 

Top

Somatic mutation of malignant transformation related genes

check buttonAnnotation of somatic variants for genes involved in malignant transformation
Hugo SymbolVariant ClassVariant ClassificationdbSNP RSHGVScHGVSpHGVSp ShortSWISSPROTBIOTYPESIFTPolyPhenTumor Sample BarcodeTissueHistologySexAgeStageTherapy TypesDrugsOutcome
PAMSNVMissense_Mutationnovelc.371N>Tp.Gly124Valp.G124VP19021protein_codingdeleterious(0)probably_damaging(1)TCGA-5L-AAT1-01Breastbreast invasive carcinomaFemale<65III/IVHormone TherapyletrozolSD
PAMSNVMissense_Mutationrs752414913c.2119C>Tp.Arg707Trpp.R707WP19021protein_codingdeleterious(0)probably_damaging(1)TCGA-A8-A09C-01Breastbreast invasive carcinomaFemale>=65I/IIUnknownUnknownSD
PAMSNVMissense_Mutationrs771873156c.2710N>Ap.Glu904Lysp.E904KP19021protein_codingtolerated(0.06)benign(0.308)TCGA-AC-A23H-01Breastbreast invasive carcinomaFemale>=65I/IIUnknownUnknownPD
PAMSNVMissense_Mutationc.239N>Cp.Arg80Prop.R80PP19021protein_codingtolerated(0.95)benign(0.007)TCGA-BH-A0AW-01Breastbreast invasive carcinomaFemale<65I/IIChemotherapycarboplatinSD
PAMSNVMissense_Mutationc.2333A>Gp.His778Argp.H778RP19021protein_codingtolerated(0.34)benign(0)TCGA-C8-A1HK-01Breastbreast invasive carcinomaFemale<65I/IIUnknownUnknownSD
PAMSNVMissense_Mutationnovelc.2433N>Cp.Lys811Asnp.K811NP19021protein_codingtolerated(0.05)benign(0.018)TCGA-EW-A1PC-01Breastbreast invasive carcinomaFemale>=65I/IIHormone TherapytamoxiphenSD
PAMdeletionFrame_Shift_Delnovelc.673delNp.Asn226IlefsTer16p.N226Ifs*16P19021protein_codingTCGA-EW-A2FV-01Breastbreast invasive carcinomaFemale<65III/IVChemotherapydocetaxelSD
PAMSNVMissense_Mutationnovelc.304C>Tp.His102Tyrp.H102YP19021protein_codingdeleterious(0)possibly_damaging(0.899)TCGA-2W-A8YY-01Cervixcervical & endocervical cancerFemale<65I/IIChemotherapycisplatinCR
PAMSNVMissense_Mutationc.1175N>Tp.Ser392Leup.S392LP19021protein_codingtolerated(0.07)probably_damaging(0.992)TCGA-Q1-A73O-01Cervixcervical & endocervical cancerFemale<65I/IIChemotherapycisplatinCR
PAMSNVMissense_Mutationc.2038N>Tp.Pro680Serp.P680SP19021protein_codingdeleterious(0.05)possibly_damaging(0.632)TCGA-AA-3510-01Colorectumcolon adenocarcinomaMale>=65I/IIUnknownUnknownSD
Page: 1 2 3 4 5 6 7 8 9 10 

Top

Related drugs of malignant transformation related genes

check buttonIdentification of chemicals and drugs interact with genes involved in malignant transfromation
(DGIdb 4.0)
Entrez IDSymbolCategoryInteraction TypesDrug Claim NameDrug NamePMIDs
Page: 1