
|
|||||
|
 | |
| |
| |
| |
| |
| |
|
Gene: PALMD |
Gene summary for PALMD |
| Gene information | Species | Human | Gene symbol | PALMD | Gene ID | 54873 |
| Gene name | palmdelphin | |
| Gene Alias | C1orf11 | |
| Cytomap | 1p21.2 | |
| Gene Type | protein-coding | GO ID | GO:0000902 | UniProtAcc | A0A0S2Z5E7 |
Top |
Malignant transformation analysis |
| Identification of the aberrant gene expression in precancerous and cancerous lesions by comparing the gene expression of stem-like cells in diseased tissues with normal stem cells |
| Entrez ID | Symbol | Replicates | Species | Organ | Tissue | Adj P-value | Log2FC | Malignancy |
| 54873 | PALMD | LZE4T | Human | Esophagus | ESCC | 4.10e-02 | 2.77e-01 | 0.0811 |
| 54873 | PALMD | P2T-E | Human | Esophagus | ESCC | 9.37e-20 | 4.04e-01 | 0.1177 |
| 54873 | PALMD | P5T-E | Human | Esophagus | ESCC | 4.09e-03 | -5.89e-02 | 0.1327 |
| 54873 | PALMD | P8T-E | Human | Esophagus | ESCC | 1.05e-02 | 1.61e-01 | 0.0889 |
| 54873 | PALMD | P10T-E | Human | Esophagus | ESCC | 3.30e-15 | 4.75e-01 | 0.116 |
| 54873 | PALMD | P11T-E | Human | Esophagus | ESCC | 1.72e-03 | 3.17e-01 | 0.1426 |
| 54873 | PALMD | P12T-E | Human | Esophagus | ESCC | 1.87e-06 | 7.94e-03 | 0.1122 |
| 54873 | PALMD | P16T-E | Human | Esophagus | ESCC | 5.31e-07 | 2.55e-02 | 0.1153 |
| 54873 | PALMD | P17T-E | Human | Esophagus | ESCC | 1.93e-02 | 4.82e-01 | 0.1278 |
| 54873 | PALMD | P20T-E | Human | Esophagus | ESCC | 2.93e-16 | 4.23e-01 | 0.1124 |
| 54873 | PALMD | P21T-E | Human | Esophagus | ESCC | 1.26e-07 | 1.88e-01 | 0.1617 |
| 54873 | PALMD | P22T-E | Human | Esophagus | ESCC | 1.13e-08 | 7.37e-02 | 0.1236 |
| 54873 | PALMD | P26T-E | Human | Esophagus | ESCC | 8.98e-09 | -4.01e-02 | 0.1276 |
| 54873 | PALMD | P27T-E | Human | Esophagus | ESCC | 1.75e-02 | -1.43e-01 | 0.1055 |
| 54873 | PALMD | P30T-E | Human | Esophagus | ESCC | 2.26e-04 | 3.69e-01 | 0.137 |
| 54873 | PALMD | P31T-E | Human | Esophagus | ESCC | 1.03e-50 | 1.33e+00 | 0.1251 |
| 54873 | PALMD | P32T-E | Human | Esophagus | ESCC | 2.55e-15 | 3.22e-01 | 0.1666 |
| 54873 | PALMD | P37T-E | Human | Esophagus | ESCC | 4.68e-13 | 2.69e-01 | 0.1371 |
| 54873 | PALMD | P39T-E | Human | Esophagus | ESCC | 7.87e-06 | -1.57e-01 | 0.0894 |
| 54873 | PALMD | P40T-E | Human | Esophagus | ESCC | 1.05e-06 | 1.59e-01 | 0.109 |
| Page: 1 2 3 4 |
| Tissue | Expression Dynamics | Abbreviation |
| Esophagus | 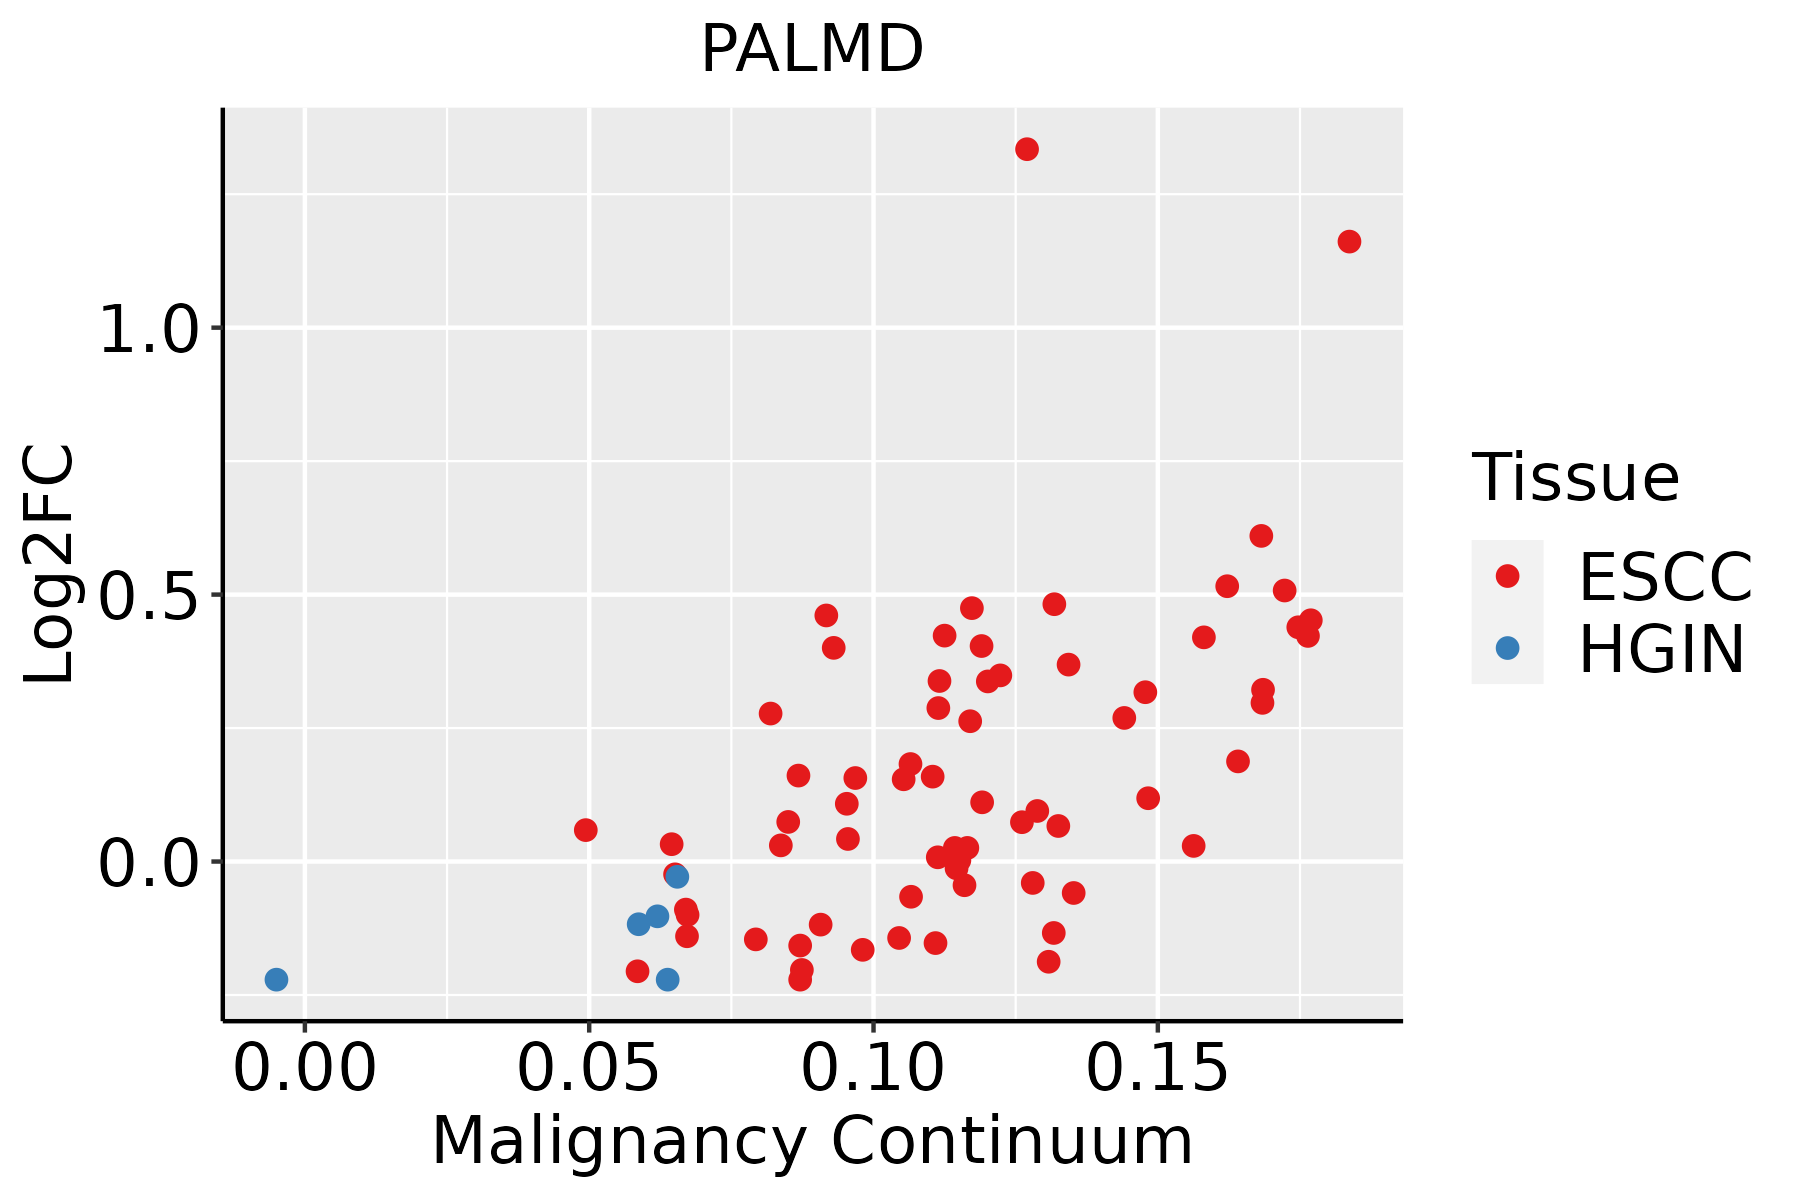 | ESCC: Esophageal squamous cell carcinoma |
| HGIN: High-grade intraepithelial neoplasias | ||
| LGIN: Low-grade intraepithelial neoplasias | ||
| Oral Cavity | 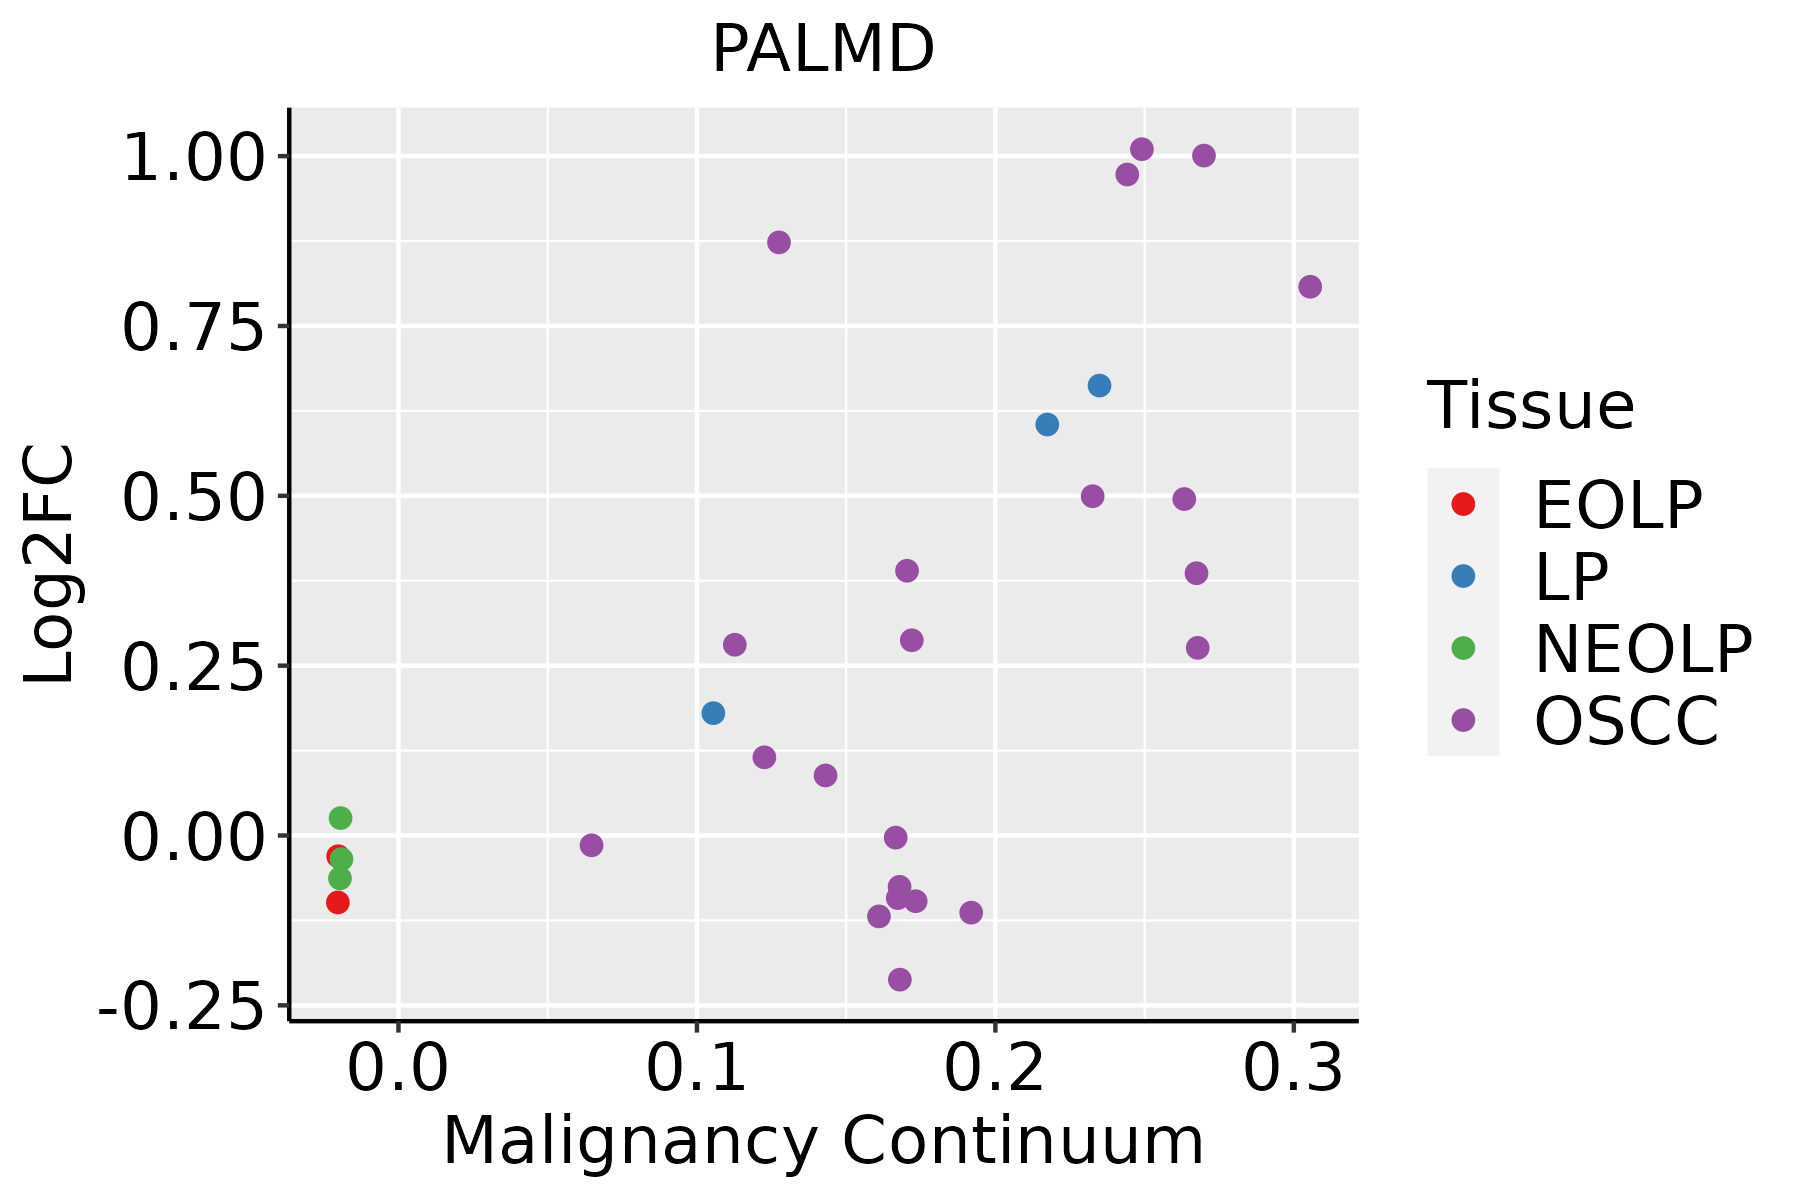 | EOLP: Erosive Oral lichen planus |
| LP: leukoplakia | ||
| NEOLP: Non-erosive oral lichen planus | ||
| OSCC: Oral squamous cell carcinoma | ||
| Prostate |  | BPH: Benign Prostatic Hyperplasia |
| Skin | 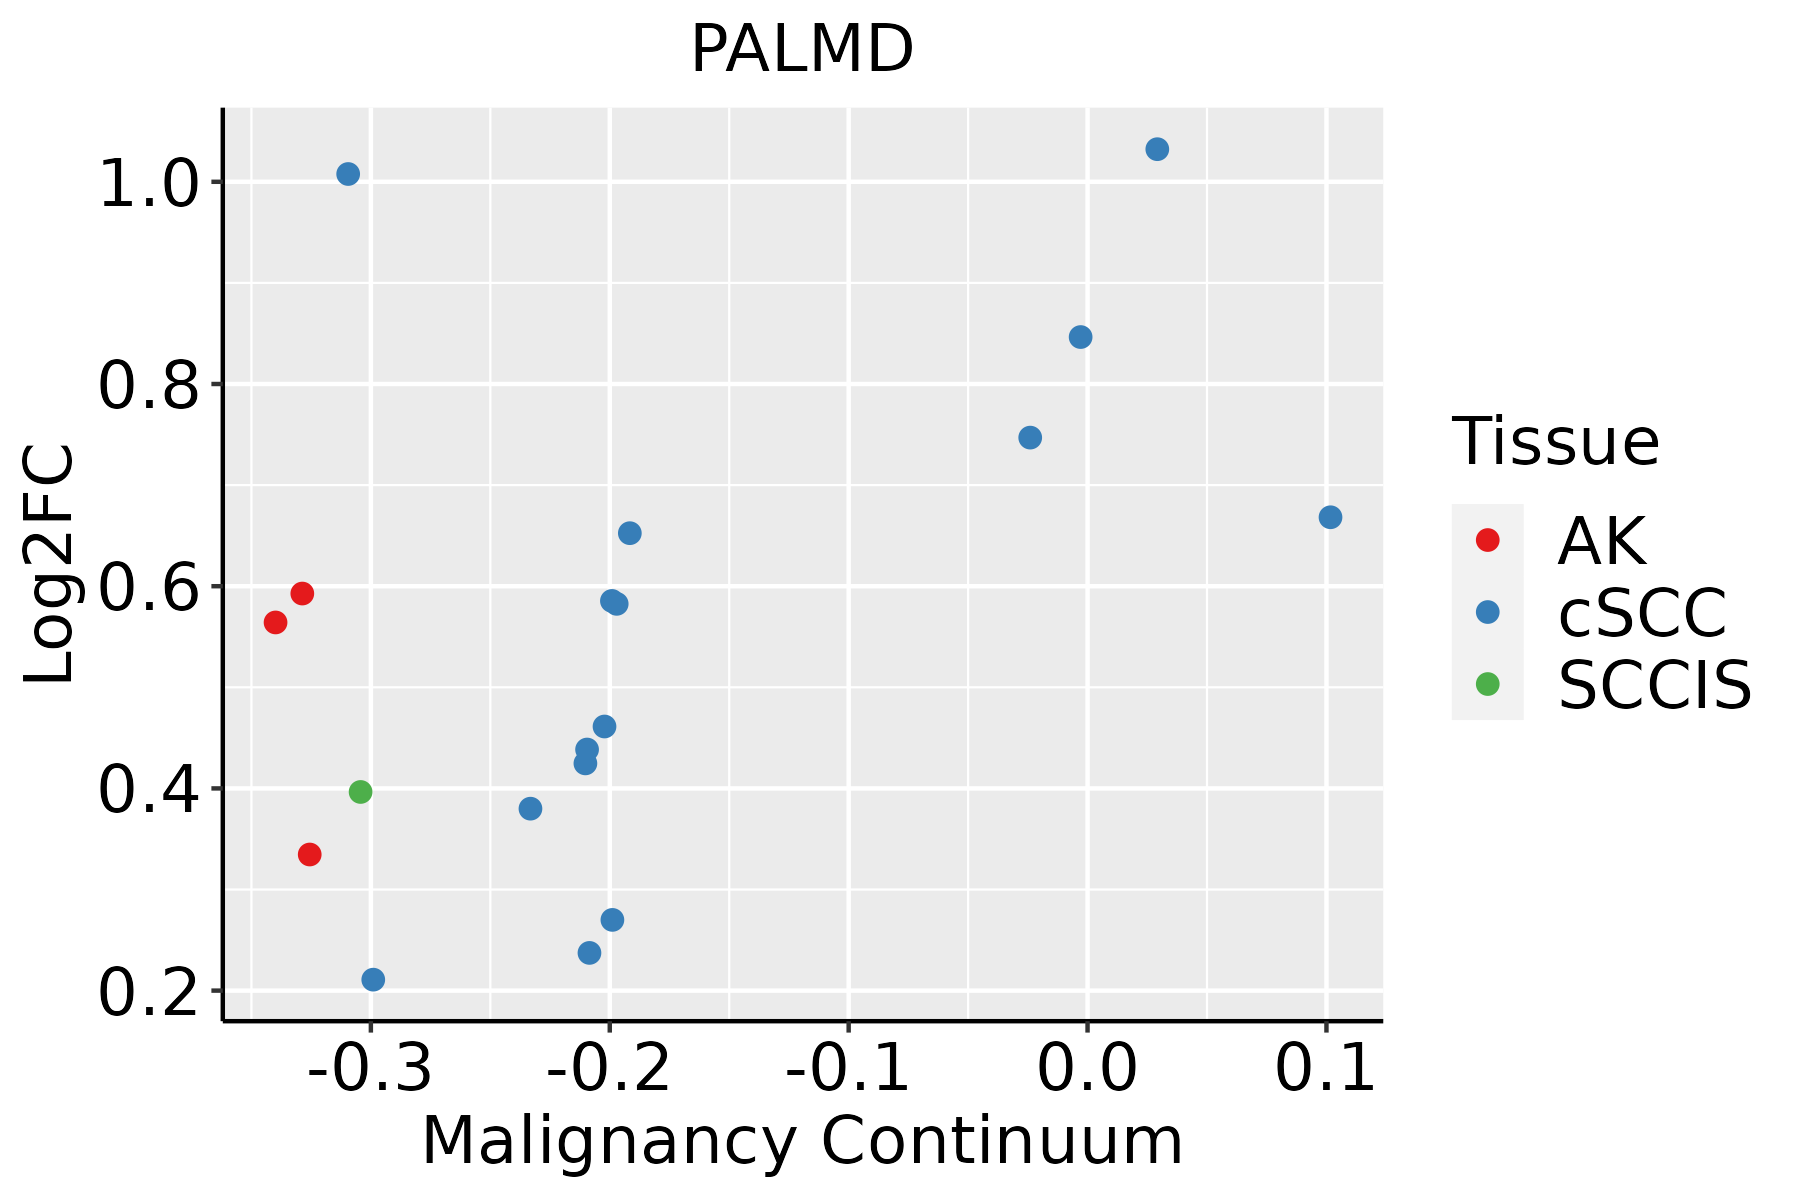 | AK: Actinic keratosis |
| cSCC: Cutaneous squamous cell carcinoma | ||
| SCCIS:squamous cell carcinoma in situ |
| ∗log2FC in expression of this searched gene in stem-like cells from each diseased tissue sample relative to stem-like cells in normal samples in each tissue plotted against the malignancy continuum. Samples are colored based on if they are from different disease stage. |
Top |
Malignant transformation related pathway analysis |
| Find out the enriched GO biological processes and KEGG pathways involved in transition from healthy to precancer to cancer |
| Tissue | Disease Stage | Enriched GO biological Processes |
| Colorectum | AD |  |
| Colorectum | SER |  |
| Colorectum | MSS |  |
| Colorectum | MSI-H |  |
| Colorectum | FAP |  |
| ∗Top 15 enriched GO BP terms are showed in the bar plot of each disease state in each tissue. Each row represents a significant GO biological process which is colored according to the -log10(p.adjust). |
| Page: 1 2 3 4 5 6 7 8 9 |
| GO ID | Tissue | Disease Stage | Description | Gene Ratio | Bg Ratio | pvalue | p.adjust | Count |
| GO:002260420 | Esophagus | ESCC | regulation of cell morphogenesis | 180/8552 | 309/18723 | 5.19e-06 | 5.45e-05 | 180 |
| GO:000836018 | Esophagus | ESCC | regulation of cell shape | 92/8552 | 154/18723 | 3.00e-04 | 1.81e-03 | 92 |
| GO:002260419 | Oral cavity | OSCC | regulation of cell morphogenesis | 163/7305 | 309/18723 | 5.66e-07 | 8.19e-06 | 163 |
| GO:000836016 | Oral cavity | OSCC | regulation of cell shape | 88/7305 | 154/18723 | 3.73e-06 | 4.42e-05 | 88 |
| GO:002260417 | Prostate | BPH | regulation of cell morphogenesis | 99/3107 | 309/18723 | 1.30e-11 | 9.72e-10 | 99 |
| GO:000836010 | Prostate | BPH | regulation of cell shape | 47/3107 | 154/18723 | 1.27e-05 | 1.70e-04 | 47 |
| GO:002260418 | Prostate | Tumor | regulation of cell morphogenesis | 102/3246 | 309/18723 | 1.25e-11 | 9.49e-10 | 102 |
| GO:000836015 | Prostate | Tumor | regulation of cell shape | 51/3246 | 154/18723 | 1.42e-06 | 2.56e-05 | 51 |
| GO:002260426 | Skin | AK | regulation of cell morphogenesis | 66/1910 | 309/18723 | 4.34e-09 | 3.30e-07 | 66 |
| GO:000836019 | Skin | AK | regulation of cell shape | 33/1910 | 154/18723 | 2.85e-05 | 4.97e-04 | 33 |
| GO:0022604111 | Skin | SCCIS | regulation of cell morphogenesis | 36/919 | 309/18723 | 1.41e-06 | 8.79e-05 | 36 |
| GO:0008360110 | Skin | SCCIS | regulation of cell shape | 18/919 | 154/18723 | 5.64e-04 | 8.52e-03 | 18 |
| GO:002260427 | Skin | cSCC | regulation of cell morphogenesis | 114/4864 | 309/18723 | 1.34e-05 | 1.68e-04 | 114 |
| GO:000836025 | Skin | cSCC | regulation of cell shape | 57/4864 | 154/18723 | 1.61e-03 | 9.90e-03 | 57 |
| Page: 1 |
| Pathway ID | Tissue | Disease Stage | Description | Gene Ratio | Bg Ratio | pvalue | p.adjust | qvalue | Count |
| Page: 1 |
Top |
Cell-cell communication analysis |
| Identification of potential cell-cell interactions between two cell types and their ligand-receptor pairs for different disease states |
| Ligand | Receptor | LRpair | Pathway | Tissue | Disease Stage |
| Page: 1 |
Top |
Single-cell gene regulatory network inference analysis |
| Find out the significant the regulons (TFs) and the target genes of each regulon across cell types for different disease states |
| TF | Cell Type | Tissue | Disease Stage | Target Gene | RSS | Regulon Activity |
| ∗The dot plots of a searched regulon are shown for all cell subpopulations in each disease state of each tissue based on the regulon specific score inferred using pySCENIC and by calculating the average expression. |
| Page: 1 |
Top |
Somatic mutation of malignant transformation related genes |
| Annotation of somatic variants for genes involved in malignant transformation |
| Hugo Symbol | Variant Class | Variant Classification | dbSNP RS | HGVSc | HGVSp | HGVSp Short | SWISSPROT | BIOTYPE | SIFT | PolyPhen | Tumor Sample Barcode | Tissue | Histology | Sex | Age | Stage | Therapy Types | Drugs | Outcome |
| PALMD | SNV | Missense_Mutation | c.1172A>T | p.Asp391Val | p.D391V | Q9NP74 | protein_coding | tolerated(0.14) | benign(0.096) | TCGA-BH-A0BZ-01 | Breast | breast invasive carcinoma | Female | <65 | III/IV | Chemotherapy | doxorubicin | CR | |
| PALMD | SNV | Missense_Mutation | novel | c.100G>A | p.Asp34Asn | p.D34N | Q9NP74 | protein_coding | deleterious(0) | benign(0.006) | TCGA-BH-A42V-01 | Breast | breast invasive carcinoma | Female | <65 | I/II | Unknown | Unknown | SD |
| PALMD | SNV | Missense_Mutation | novel | c.1623G>T | p.Met541Ile | p.M541I | Q9NP74 | protein_coding | tolerated(0.36) | benign(0) | TCGA-C8-A26Y-01 | Breast | breast invasive carcinoma | Female | >=65 | I/II | Unknown | Unknown | SD |
| PALMD | SNV | Missense_Mutation | novel | c.1313N>T | p.Gly438Val | p.G438V | Q9NP74 | protein_coding | deleterious(0) | probably_damaging(1) | TCGA-EW-A3E8-01 | Breast | breast invasive carcinoma | Female | <65 | I/II | Hormone Therapy | anastrozole | SD |
| PALMD | SNV | Missense_Mutation | novel | c.333G>T | p.Lys111Asn | p.K111N | Q9NP74 | protein_coding | deleterious(0) | probably_damaging(0.911) | TCGA-LL-A440-01 | Breast | breast invasive carcinoma | Female | <65 | I/II | Chemotherapy | cytoxan | CR |
| PALMD | insertion | Frame_Shift_Ins | novel | c.1406_1407insAACACACCTC | p.His469GlnfsTer5 | p.H469Qfs*5 | Q9NP74 | protein_coding | TCGA-AN-A046-01 | Breast | breast invasive carcinoma | Female | >=65 | I/II | Unknown | Unknown | SD | ||
| PALMD | insertion | Frame_Shift_Ins | novel | c.1408_1409insTAAT | p.Ser470IlefsTer15 | p.S470Ifs*15 | Q9NP74 | protein_coding | TCGA-AN-A046-01 | Breast | breast invasive carcinoma | Female | >=65 | I/II | Unknown | Unknown | SD | ||
| PALMD | SNV | Missense_Mutation | c.481N>A | p.Glu161Lys | p.E161K | Q9NP74 | protein_coding | tolerated(0.71) | benign(0.018) | TCGA-IR-A3LH-01 | Cervix | cervical & endocervical cancer | Female | <65 | I/II | Chemotherapy | cisplatin | CR | |
| PALMD | SNV | Missense_Mutation | novel | c.1091N>T | p.Ser364Phe | p.S364F | Q9NP74 | protein_coding | tolerated(0.61) | benign(0.007) | TCGA-MA-AA41-01 | Cervix | cervical & endocervical cancer | Female | <65 | I/II | Unknown | Unknown | SD |
| PALMD | SNV | Missense_Mutation | c.775G>C | p.Glu259Gln | p.E259Q | Q9NP74 | protein_coding | tolerated(0.06) | possibly_damaging(0.853) | TCGA-Q1-A73O-01 | Cervix | cervical & endocervical cancer | Female | <65 | I/II | Chemotherapy | cisplatin | CR |
| Page: 1 2 3 4 5 6 |
Top |
Related drugs of malignant transformation related genes |
| Identification of chemicals and drugs interact with genes involved in malignant transfromation |
| (DGIdb 4.0) |
| Entrez ID | Symbol | Category | Interaction Types | Drug Claim Name | Drug Name | PMIDs |
| Page: 1 |

Copyright 2023-Present -The University of Texas Health Science Center at Houston |