
|
|||||
|
 | |
| |
| |
| |
| |
| |
|
Gene: PALM2-AKAP2 |
Gene summary for PALM2-AKAP2 |
| Gene information | Species | Human | Gene symbol | PALM2-AKAP2 | Gene ID | 445815 |
| Gene name | PALM2 and AKAP2 fusion | |
| Gene Alias | AKAP-2 | |
| Cytomap | 9q31.3 | |
| Gene Type | protein-coding | GO ID | GO:0000902 | UniProtAcc | Q9Y2D5 |
Top |
Malignant transformation analysis |
| Identification of the aberrant gene expression in precancerous and cancerous lesions by comparing the gene expression of stem-like cells in diseased tissues with normal stem cells |
| Entrez ID | Symbol | Replicates | Species | Organ | Tissue | Adj P-value | Log2FC | Malignancy |
| 445815 | PALM2-AKAP2 | NAFLD1 | Human | Liver | NAFLD | 1.88e-05 | 7.39e-01 | -0.04 |
| 445815 | PALM2-AKAP2 | S41 | Human | Liver | Cirrhotic | 1.67e-08 | 7.86e-01 | -0.0343 |
| 445815 | PALM2-AKAP2 | S43 | Human | Liver | Cirrhotic | 1.08e-03 | 2.04e-01 | -0.0187 |
| 445815 | PALM2-AKAP2 | HCC1_Meng | Human | Liver | HCC | 1.91e-05 | -1.45e-01 | 0.0246 |
| 445815 | PALM2-AKAP2 | HCC2_Meng | Human | Liver | HCC | 4.78e-05 | -1.46e-01 | 0.0107 |
| 445815 | PALM2-AKAP2 | cirrhotic1 | Human | Liver | Cirrhotic | 1.05e-05 | -1.47e-01 | 0.0202 |
| 445815 | PALM2-AKAP2 | cirrhotic2 | Human | Liver | Cirrhotic | 4.78e-05 | -1.47e-01 | 0.0201 |
| 445815 | PALM2-AKAP2 | Pt13.a | Human | Liver | HCC | 8.52e-03 | -1.38e-01 | 0.021 |
| 445815 | PALM2-AKAP2 | Pt14.d | Human | Liver | HCC | 1.05e-05 | -1.47e-01 | 0.0143 |
| 445815 | PALM2-AKAP2 | C21 | Human | Oral cavity | OSCC | 7.49e-05 | -3.54e-01 | 0.2678 |
| 445815 | PALM2-AKAP2 | C43 | Human | Oral cavity | OSCC | 4.27e-09 | -3.54e-01 | 0.1704 |
| 445815 | PALM2-AKAP2 | C46 | Human | Oral cavity | OSCC | 2.47e-09 | -3.54e-01 | 0.1673 |
| 445815 | PALM2-AKAP2 | C57 | Human | Oral cavity | OSCC | 6.72e-06 | -3.54e-01 | 0.1679 |
| 445815 | PALM2-AKAP2 | C08 | Human | Oral cavity | OSCC | 4.14e-10 | -3.54e-01 | 0.1919 |
| 445815 | PALM2-AKAP2 | C09 | Human | Oral cavity | OSCC | 1.26e-06 | -3.54e-01 | 0.1431 |
| 445815 | PALM2-AKAP2 | LN46 | Human | Oral cavity | OSCC | 2.51e-03 | -3.54e-01 | 0.1666 |
| 445815 | PALM2-AKAP2 | EOLP-1 | Human | Oral cavity | EOLP | 5.95e-27 | 7.38e-01 | -0.0202 |
| 445815 | PALM2-AKAP2 | EOLP-2 | Human | Oral cavity | EOLP | 1.43e-08 | 5.80e-01 | -0.0203 |
| 445815 | PALM2-AKAP2 | NEOLP-1 | Human | Oral cavity | NEOLP | 8.26e-24 | 8.30e-01 | -0.0194 |
| 445815 | PALM2-AKAP2 | NEOLP-2 | Human | Oral cavity | NEOLP | 9.98e-12 | 5.13e-01 | -0.0196 |
| Page: 1 2 |
| Tissue | Expression Dynamics | Abbreviation |
| Liver |  | HCC: Hepatocellular carcinoma |
| NAFLD: Non-alcoholic fatty liver disease | ||
| Oral Cavity | 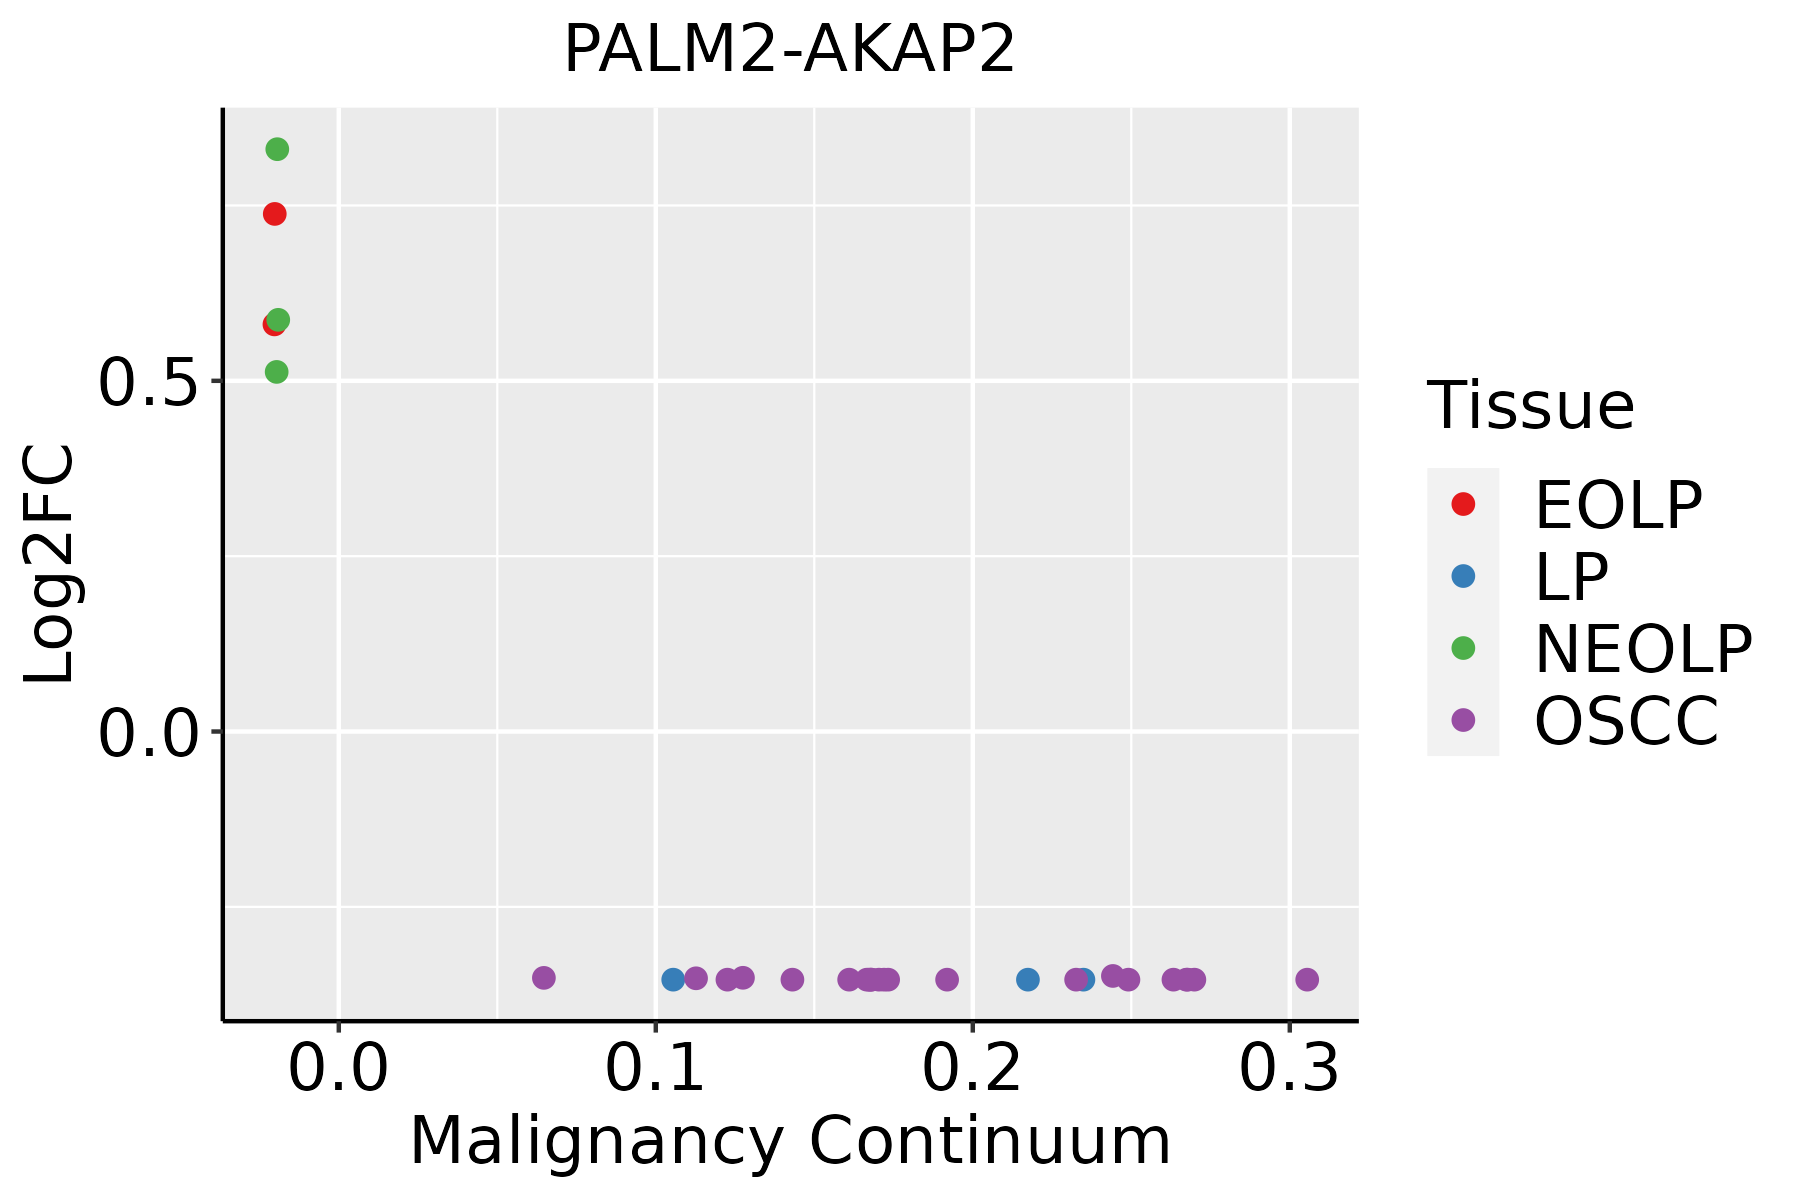 | EOLP: Erosive Oral lichen planus |
| LP: leukoplakia | ||
| NEOLP: Non-erosive oral lichen planus | ||
| OSCC: Oral squamous cell carcinoma |
| ∗log2FC in expression of this searched gene in stem-like cells from each diseased tissue sample relative to stem-like cells in normal samples in each tissue plotted against the malignancy continuum. Samples are colored based on if they are from different disease stage. |
Top |
Malignant transformation related pathway analysis |
| Find out the enriched GO biological processes and KEGG pathways involved in transition from healthy to precancer to cancer |
| Tissue | Disease Stage | Enriched GO biological Processes |
| Colorectum | AD |  |
| Colorectum | SER |  |
| Colorectum | MSS |  |
| Colorectum | MSI-H |  |
| Colorectum | FAP |  |
| ∗Top 15 enriched GO BP terms are showed in the bar plot of each disease state in each tissue. Each row represents a significant GO biological process which is colored according to the -log10(p.adjust). |
| Page: 1 2 3 4 5 6 7 8 9 |
| GO ID | Tissue | Disease Stage | Description | Gene Ratio | Bg Ratio | pvalue | p.adjust | Count |
| Page: 1 |
| Pathway ID | Tissue | Disease Stage | Description | Gene Ratio | Bg Ratio | pvalue | p.adjust | qvalue | Count |
| Page: 1 |
Top |
Cell-cell communication analysis |
| Identification of potential cell-cell interactions between two cell types and their ligand-receptor pairs for different disease states |
| Ligand | Receptor | LRpair | Pathway | Tissue | Disease Stage |
| Page: 1 |
Top |
Single-cell gene regulatory network inference analysis |
| Find out the significant the regulons (TFs) and the target genes of each regulon across cell types for different disease states |
| TF | Cell Type | Tissue | Disease Stage | Target Gene | RSS | Regulon Activity |
| ∗The dot plots of a searched regulon are shown for all cell subpopulations in each disease state of each tissue based on the regulon specific score inferred using pySCENIC and by calculating the average expression. |
| Page: 1 |
Top |
Somatic mutation of malignant transformation related genes |
| Annotation of somatic variants for genes involved in malignant transformation |
| Hugo Symbol | Variant Class | Variant Classification | dbSNP RS | HGVSc | HGVSp | HGVSp Short | SWISSPROT | BIOTYPE | SIFT | PolyPhen | Tumor Sample Barcode | Tissue | Histology | Sex | Age | Stage | Therapy Types | Drugs | Outcome |
| PALM2-AKAP2 | SNV | Missense_Mutation | c.463N>A | p.Ser155Thr | p.S155T | protein_coding | tolerated(0.38) | benign(0.229) | TCGA-A8-A09K-01 | Breast | breast invasive carcinoma | Female | >=65 | I/II | Unknown | Unknown | SD | ||
| PALM2-AKAP2 | SNV | Missense_Mutation | rs140234906 | c.3211N>A | p.Glu1071Lys | p.E1071K | protein_coding | tolerated(0.08) | probably_damaging(0.997) | TCGA-AC-A23H-01 | Breast | breast invasive carcinoma | Female | >=65 | I/II | Unknown | Unknown | PD | |
| PALM2-AKAP2 | SNV | Missense_Mutation | novel | c.612C>G | p.Ile204Met | p.I204M | protein_coding | deleterious(0.03) | benign(0.165) | TCGA-EW-A3E8-01 | Breast | breast invasive carcinoma | Female | <65 | I/II | Hormone Therapy | anastrozole | SD | |
| PALM2-AKAP2 | SNV | Missense_Mutation | c.443N>A | p.Cys148Tyr | p.C148Y | protein_coding | tolerated(1) | benign(0) | TCGA-AA-3966-01 | Colorectum | colon adenocarcinoma | Female | >=65 | I/II | Unknown | Unknown | SD | ||
| PALM2-AKAP2 | SNV | Missense_Mutation | rs748723983 | c.466N>T | p.Pro156Ser | p.P156S | protein_coding | tolerated(0.89) | benign(0.02) | TCGA-AZ-4684-01 | Colorectum | colon adenocarcinoma | Male | <65 | I/II | Chemotherapy | folfox | PD | |
| PALM2-AKAP2 | SNV | Missense_Mutation | c.662N>T | p.Ala221Val | p.A221V | protein_coding | tolerated(0.3) | benign(0.003) | TCGA-G4-6302-01 | Colorectum | colon adenocarcinoma | Female | >=65 | I/II | Unknown | Unknown | SD | ||
| PALM2-AKAP2 | SNV | Missense_Mutation | novel | c.140N>A | p.Arg47Gln | p.R47Q | protein_coding | deleterious_low_confidence(0.02) | probably_damaging(0.995) | TCGA-A5-A0G1-01 | Endometrium | uterine corpus endometrioid carcinoma | Female | >=65 | I/II | Unknown | Unknown | SD | |
| PALM2-AKAP2 | SNV | Missense_Mutation | novel | c.361N>T | p.Asp121Tyr | p.D121Y | protein_coding | deleterious(0) | probably_damaging(0.983) | TCGA-A5-A1OF-01 | Endometrium | uterine corpus endometrioid carcinoma | Female | <65 | I/II | Unknown | Unknown | SD | |
| PALM2-AKAP2 | SNV | Missense_Mutation | novel | c.403N>C | p.Asn135His | p.N135H | protein_coding | tolerated(0.08) | possibly_damaging(0.694) | TCGA-AJ-A3EL-01 | Endometrium | uterine corpus endometrioid carcinoma | Female | <65 | I/II | Unknown | Unknown | SD | |
| PALM2-AKAP2 | SNV | Missense_Mutation | novel | c.676N>C | p.Ser226Pro | p.S226P | protein_coding | tolerated(0.48) | benign(0) | TCGA-AJ-A3EL-01 | Endometrium | uterine corpus endometrioid carcinoma | Female | <65 | I/II | Unknown | Unknown | SD |
| Page: 1 2 3 |
Top |
Related drugs of malignant transformation related genes |
| Identification of chemicals and drugs interact with genes involved in malignant transfromation |
| (DGIdb 4.0) |
| Entrez ID | Symbol | Category | Interaction Types | Drug Claim Name | Drug Name | PMIDs |
| Page: 1 |

Copyright 2023-Present -The University of Texas Health Science Center at Houston |