
|
|||||
|
 | |
| |
| |
| |
| |
| |
|
Gene: PALM |
Gene summary for PALM |
| Gene information | Species | Human | Gene symbol | PALM | Gene ID | 5064 |
| Gene name | paralemmin | |
| Gene Alias | PALM1 | |
| Cytomap | 19p13.3 | |
| Gene Type | protein-coding | GO ID | GO:0000902 | UniProtAcc | A0A024R207 |
Top |
Malignant transformation analysis |
| Identification of the aberrant gene expression in precancerous and cancerous lesions by comparing the gene expression of stem-like cells in diseased tissues with normal stem cells |
| Entrez ID | Symbol | Replicates | Species | Organ | Tissue | Adj P-value | Log2FC | Malignancy |
| 5064 | PALM | C38 | Human | Oral cavity | OSCC | 1.60e-03 | 5.41e-01 | 0.172 |
| 5064 | PALM | C08 | Human | Oral cavity | OSCC | 3.15e-07 | 1.83e-01 | 0.1919 |
| 5064 | PALM | LN38 | Human | Oral cavity | OSCC | 4.81e-04 | 9.24e-01 | 0.168 |
| 5064 | PALM | male-WTA | Human | Thyroid | PTC | 3.25e-34 | 3.89e-01 | 0.1037 |
| 5064 | PALM | PTC01 | Human | Thyroid | PTC | 3.83e-10 | 2.36e-01 | 0.1899 |
| 5064 | PALM | PTC03 | Human | Thyroid | PTC | 1.71e-03 | 1.81e-01 | 0.1784 |
| 5064 | PALM | PTC04 | Human | Thyroid | PTC | 2.69e-11 | 1.79e-01 | 0.1927 |
| 5064 | PALM | PTC05 | Human | Thyroid | PTC | 9.75e-24 | 6.93e-01 | 0.2065 |
| 5064 | PALM | PTC06 | Human | Thyroid | PTC | 6.60e-34 | 6.76e-01 | 0.2057 |
| 5064 | PALM | PTC07 | Human | Thyroid | PTC | 4.92e-23 | 3.95e-01 | 0.2044 |
| 5064 | PALM | ATC11 | Human | Thyroid | ATC | 3.82e-02 | 8.98e-01 | 0.3386 |
| 5064 | PALM | ATC13 | Human | Thyroid | ATC | 4.42e-31 | 7.07e-01 | 0.34 |
| 5064 | PALM | ATC5 | Human | Thyroid | ATC | 6.18e-44 | 7.58e-01 | 0.34 |
| Page: 1 |
| Tissue | Expression Dynamics | Abbreviation |
| Oral Cavity |  | EOLP: Erosive Oral lichen planus |
| LP: leukoplakia | ||
| NEOLP: Non-erosive oral lichen planus | ||
| OSCC: Oral squamous cell carcinoma | ||
| Thyroid | 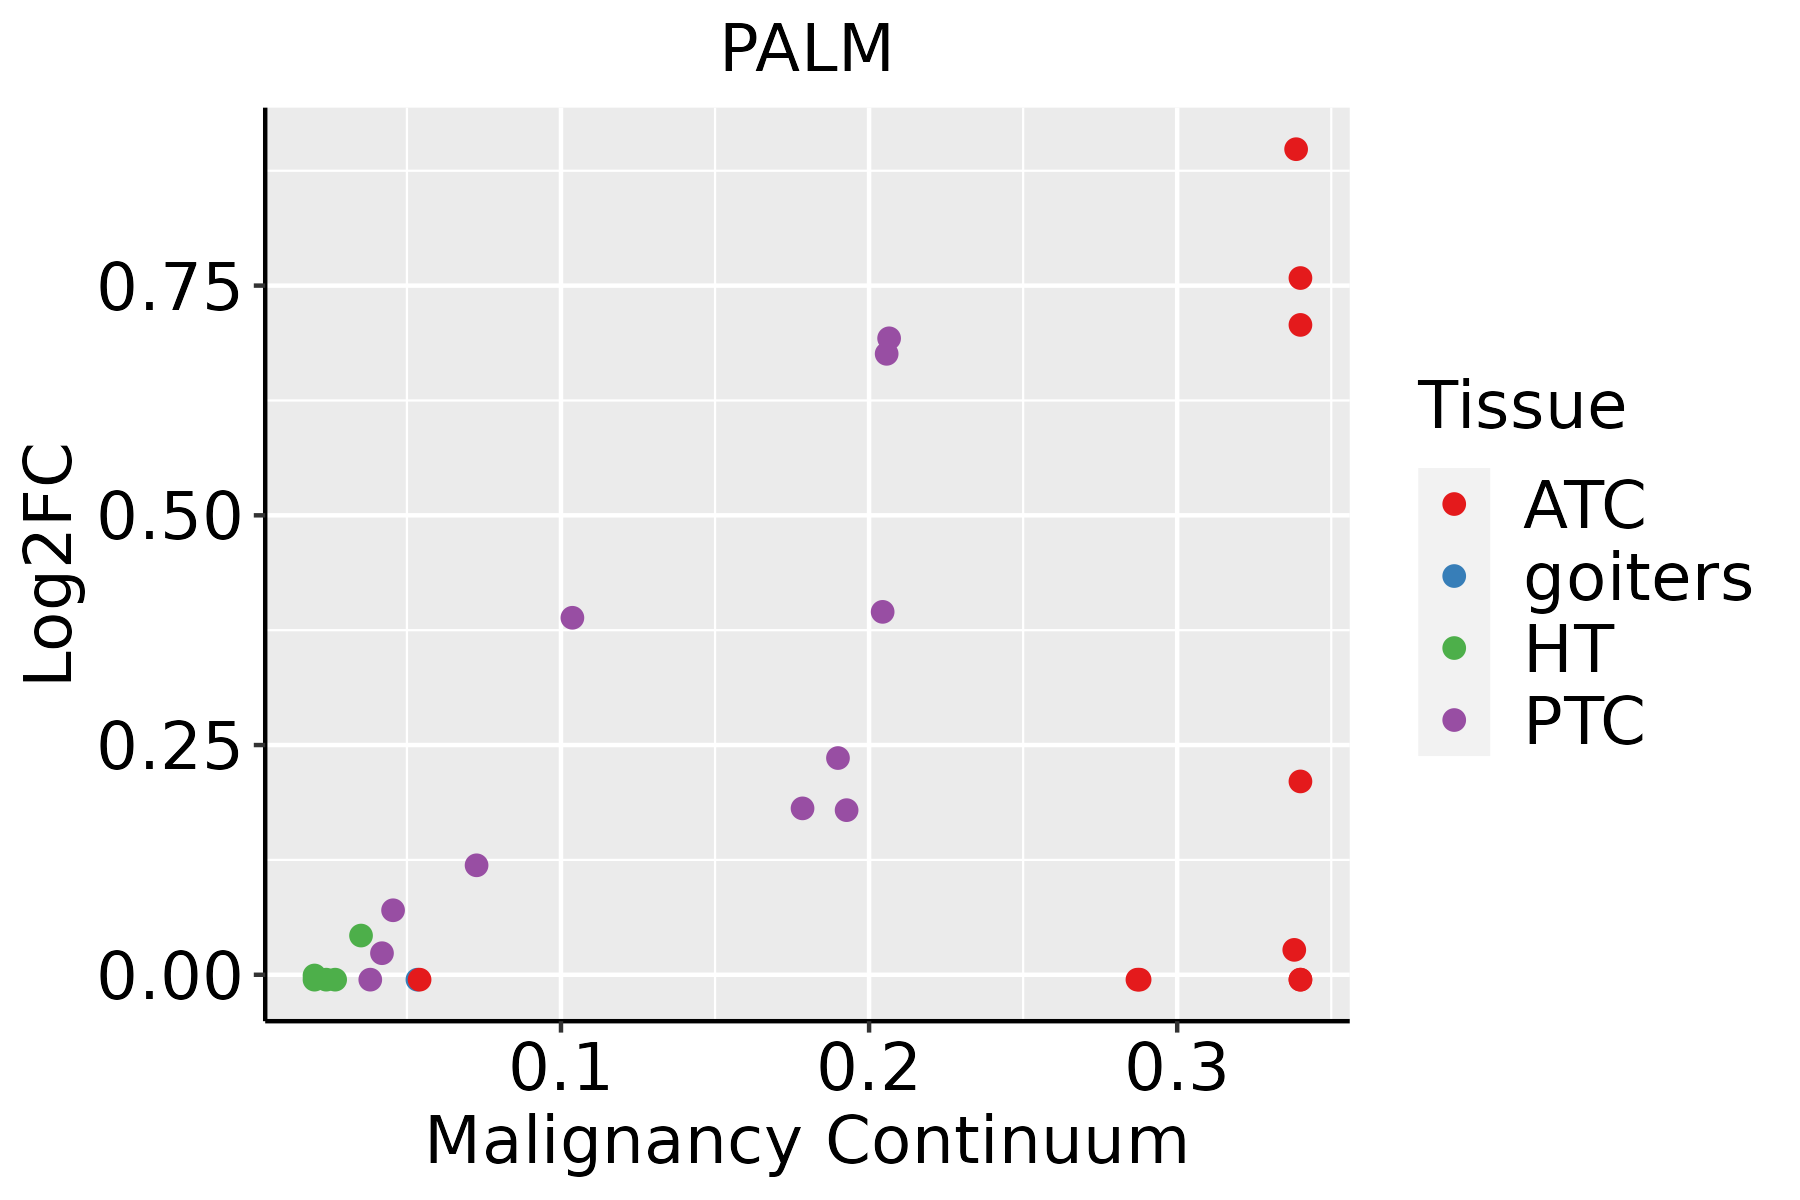 | ATC: Anaplastic thyroid cancer |
| HT: Hashimoto's thyroiditis | ||
| PTC: Papillary thyroid cancer |
| ∗log2FC in expression of this searched gene in stem-like cells from each diseased tissue sample relative to stem-like cells in normal samples in each tissue plotted against the malignancy continuum. Samples are colored based on if they are from different disease stage. |
Top |
Malignant transformation related pathway analysis |
| Find out the enriched GO biological processes and KEGG pathways involved in transition from healthy to precancer to cancer |
| Tissue | Disease Stage | Enriched GO biological Processes |
| Colorectum | AD |  |
| Colorectum | SER |  |
| Colorectum | MSS |  |
| Colorectum | MSI-H |  |
| Colorectum | FAP |  |
| ∗Top 15 enriched GO BP terms are showed in the bar plot of each disease state in each tissue. Each row represents a significant GO biological process which is colored according to the -log10(p.adjust). |
| Page: 1 2 3 4 5 6 7 8 9 |
| GO ID | Tissue | Disease Stage | Description | Gene Ratio | Bg Ratio | pvalue | p.adjust | Count |
| GO:002260420 | Esophagus | ESCC | regulation of cell morphogenesis | 180/8552 | 309/18723 | 5.19e-06 | 5.45e-05 | 180 |
| GO:000836018 | Esophagus | ESCC | regulation of cell shape | 92/8552 | 154/18723 | 3.00e-04 | 1.81e-03 | 92 |
| GO:007265918 | Oral cavity | OSCC | protein localization to plasma membrane | 169/7305 | 284/18723 | 1.69e-12 | 7.21e-11 | 169 |
| GO:199077816 | Oral cavity | OSCC | protein localization to cell periphery | 190/7305 | 333/18723 | 1.46e-11 | 5.13e-10 | 190 |
| GO:007121416 | Oral cavity | OSCC | cellular response to abiotic stimulus | 186/7305 | 331/18723 | 1.38e-10 | 4.10e-09 | 186 |
| GO:010400416 | Oral cavity | OSCC | cellular response to environmental stimulus | 186/7305 | 331/18723 | 1.38e-10 | 4.10e-09 | 186 |
| GO:002260419 | Oral cavity | OSCC | regulation of cell morphogenesis | 163/7305 | 309/18723 | 5.66e-07 | 8.19e-06 | 163 |
| GO:000836016 | Oral cavity | OSCC | regulation of cell shape | 88/7305 | 154/18723 | 3.73e-06 | 4.42e-05 | 88 |
| GO:003134610 | Oral cavity | OSCC | positive regulation of cell projection organization | 176/7305 | 353/18723 | 1.94e-05 | 1.87e-04 | 176 |
| GO:006049110 | Oral cavity | OSCC | regulation of cell projection assembly | 100/7305 | 188/18723 | 5.27e-05 | 4.38e-04 | 100 |
| GO:012003216 | Oral cavity | OSCC | regulation of plasma membrane bounded cell projection assembly | 98/7305 | 186/18723 | 1.00e-04 | 7.54e-04 | 98 |
| GO:01200346 | Oral cavity | OSCC | positive regulation of plasma membrane bounded cell projection assembly | 55/7305 | 105/18723 | 3.64e-03 | 1.51e-02 | 55 |
| GO:002260417 | Prostate | BPH | regulation of cell morphogenesis | 99/3107 | 309/18723 | 1.30e-11 | 9.72e-10 | 99 |
| GO:000836010 | Prostate | BPH | regulation of cell shape | 47/3107 | 154/18723 | 1.27e-05 | 1.70e-04 | 47 |
| GO:002260418 | Prostate | Tumor | regulation of cell morphogenesis | 102/3246 | 309/18723 | 1.25e-11 | 9.49e-10 | 102 |
| GO:000836015 | Prostate | Tumor | regulation of cell shape | 51/3246 | 154/18723 | 1.42e-06 | 2.56e-05 | 51 |
| GO:002260426 | Skin | AK | regulation of cell morphogenesis | 66/1910 | 309/18723 | 4.34e-09 | 3.30e-07 | 66 |
| GO:000836019 | Skin | AK | regulation of cell shape | 33/1910 | 154/18723 | 2.85e-05 | 4.97e-04 | 33 |
| GO:0022604111 | Skin | SCCIS | regulation of cell morphogenesis | 36/919 | 309/18723 | 1.41e-06 | 8.79e-05 | 36 |
| GO:0008360110 | Skin | SCCIS | regulation of cell shape | 18/919 | 154/18723 | 5.64e-04 | 8.52e-03 | 18 |
| Page: 1 2 3 |
| Pathway ID | Tissue | Disease Stage | Description | Gene Ratio | Bg Ratio | pvalue | p.adjust | qvalue | Count |
| Page: 1 |
Top |
Cell-cell communication analysis |
| Identification of potential cell-cell interactions between two cell types and their ligand-receptor pairs for different disease states |
| Ligand | Receptor | LRpair | Pathway | Tissue | Disease Stage |
| Page: 1 |
Top |
Single-cell gene regulatory network inference analysis |
| Find out the significant the regulons (TFs) and the target genes of each regulon across cell types for different disease states |
| TF | Cell Type | Tissue | Disease Stage | Target Gene | RSS | Regulon Activity |
| ∗The dot plots of a searched regulon are shown for all cell subpopulations in each disease state of each tissue based on the regulon specific score inferred using pySCENIC and by calculating the average expression. |
| Page: 1 |
Top |
Somatic mutation of malignant transformation related genes |
| Annotation of somatic variants for genes involved in malignant transformation |
| Hugo Symbol | Variant Class | Variant Classification | dbSNP RS | HGVSc | HGVSp | HGVSp Short | SWISSPROT | BIOTYPE | SIFT | PolyPhen | Tumor Sample Barcode | Tissue | Histology | Sex | Age | Stage | Therapy Types | Drugs | Outcome |
| PALM | SNV | Missense_Mutation | rs370222652 | c.977N>T | p.Ala326Val | p.A326V | O75781 | protein_coding | deleterious(0) | probably_damaging(1) | TCGA-AC-A6IW-01 | Breast | breast invasive carcinoma | Female | >=65 | I/II | Unknown | Unknown | SD |
| PALM | SNV | Missense_Mutation | c.289N>T | p.Val97Leu | p.V97L | O75781 | protein_coding | tolerated(0.32) | benign(0.003) | TCGA-D8-A1JD-01 | Breast | breast invasive carcinoma | Female | <65 | I/II | Chemotherapy | adriamycin | SD | |
| PALM | SNV | Missense_Mutation | rs372771354 | c.14C>T | p.Ala5Val | p.A5V | O75781 | protein_coding | tolerated_low_confidence(0.39) | benign(0) | TCGA-C5-A7CO-01 | Cervix | cervical & endocervical cancer | Female | >=65 | I/II | Chemotherapy | cisplatin | SD |
| PALM | SNV | Missense_Mutation | c.202N>A | p.Glu68Lys | p.E68K | O75781 | protein_coding | deleterious(0.02) | benign(0.093) | TCGA-EK-A2PG-01 | Cervix | cervical & endocervical cancer | Female | >=65 | I/II | Unknown | Unknown | SD | |
| PALM | SNV | Missense_Mutation | c.232N>A | p.Glu78Lys | p.E78K | O75781 | protein_coding | deleterious(0.01) | probably_damaging(0.933) | TCGA-WL-A834-01 | Cervix | cervical & endocervical cancer | Female | <65 | I/II | Chemotherapy | paclitaxel | SD | |
| PALM | insertion | Frame_Shift_Ins | novel | c.953_954insCAGG | p.Gly319ArgfsTer19 | p.G319Rfs*19 | O75781 | protein_coding | TCGA-DS-A1OB-01 | Cervix | cervical & endocervical cancer | Female | <65 | I/II | Chemotherapy | carboplatin | PD | ||
| PALM | SNV | Missense_Mutation | rs763907757 | c.55G>A | p.Ala19Thr | p.A19T | O75781 | protein_coding | deleterious(0.03) | possibly_damaging(0.64) | TCGA-AA-A00N-01 | Colorectum | colon adenocarcinoma | Male | >=65 | I/II | Unknown | Unknown | PD |
| PALM | SNV | Missense_Mutation | novel | c.1135C>T | p.His379Tyr | p.H379Y | O75781 | protein_coding | deleterious(0) | benign(0.187) | TCGA-AA-A010-01 | Colorectum | colon adenocarcinoma | Female | <65 | I/II | Chemotherapy | folinic | CR |
| PALM | SNV | Missense_Mutation | c.199N>A | p.Asp67Asn | p.D67N | O75781 | protein_coding | deleterious(0.03) | benign(0.025) | TCGA-CK-5914-01 | Colorectum | colon adenocarcinoma | Male | >=65 | III/IV | Unknown | Unknown | SD | |
| PALM | SNV | Missense_Mutation | c.65G>A | p.Arg22Gln | p.R22Q | O75781 | protein_coding | deleterious(0.01) | possibly_damaging(0.836) | TCGA-G4-6309-01 | Colorectum | colon adenocarcinoma | Female | <65 | III/IV | Chemotherapy | xeloda | PD |
| Page: 1 2 3 4 |
Top |
Related drugs of malignant transformation related genes |
| Identification of chemicals and drugs interact with genes involved in malignant transfromation |
| (DGIdb 4.0) |
| Entrez ID | Symbol | Category | Interaction Types | Drug Claim Name | Drug Name | PMIDs |
| Page: 1 |

Copyright 2023-Present -The University of Texas Health Science Center at Houston |