
|
|||||
|
 | |
| |
| |
| |
| |
| |
|
Gene: PALLD |
Gene summary for PALLD |
| Gene information | Species | Human | Gene symbol | PALLD | Gene ID | 23022 |
| Gene name | palladin, cytoskeletal associated protein | |
| Gene Alias | CGI-151 | |
| Cytomap | 4q32.3 | |
| Gene Type | protein-coding | GO ID | GO:0000902 | UniProtAcc | Q8WX93 |
Top |
Malignant transformation analysis |
| Identification of the aberrant gene expression in precancerous and cancerous lesions by comparing the gene expression of stem-like cells in diseased tissues with normal stem cells |
| Entrez ID | Symbol | Replicates | Species | Organ | Tissue | Adj P-value | Log2FC | Malignancy |
| 23022 | PALLD | CA_HPV_1 | Human | Cervix | CC | 3.54e-17 | -4.04e-01 | 0.0264 |
| 23022 | PALLD | N_HPV_1 | Human | Cervix | N_HPV | 1.71e-03 | -1.69e-01 | 0.0079 |
| 23022 | PALLD | CCI_1 | Human | Cervix | CC | 5.68e-03 | 1.22e+00 | 0.528 |
| 23022 | PALLD | CCI_2 | Human | Cervix | CC | 2.80e-05 | 1.72e+00 | 0.5249 |
| 23022 | PALLD | CCI_3 | Human | Cervix | CC | 2.91e-15 | 1.11e+00 | 0.516 |
| 23022 | PALLD | sample3 | Human | Cervix | CC | 1.68e-02 | -2.53e-01 | 0.1387 |
| 23022 | PALLD | T3 | Human | Cervix | CC | 3.43e-02 | -2.76e-01 | 0.1389 |
| 23022 | PALLD | HTA11_3410_2000001011 | Human | Colorectum | AD | 4.65e-46 | -9.81e-01 | 0.0155 |
| 23022 | PALLD | HTA11_2487_2000001011 | Human | Colorectum | SER | 3.63e-14 | -7.04e-01 | -0.1808 |
| 23022 | PALLD | HTA11_2951_2000001011 | Human | Colorectum | AD | 5.63e-09 | -9.56e-01 | 0.0216 |
| 23022 | PALLD | HTA11_2112_2000001011 | Human | Colorectum | SER | 4.85e-02 | -6.13e-01 | -0.2196 |
| 23022 | PALLD | HTA11_3361_2000001011 | Human | Colorectum | AD | 3.45e-14 | -7.64e-01 | -0.1207 |
| 23022 | PALLD | HTA11_83_2000001011 | Human | Colorectum | SER | 6.69e-05 | -4.76e-01 | -0.1526 |
| 23022 | PALLD | HTA11_866_2000001011 | Human | Colorectum | AD | 4.61e-05 | -3.37e-01 | -0.1001 |
| 23022 | PALLD | HTA11_1391_2000001011 | Human | Colorectum | AD | 5.06e-03 | -4.58e-01 | -0.059 |
| 23022 | PALLD | HTA11_5212_2000001011 | Human | Colorectum | AD | 7.80e-05 | -8.41e-01 | -0.2061 |
| 23022 | PALLD | HTA11_546_2000001011 | Human | Colorectum | AD | 1.09e-02 | -1.43e-01 | -0.0842 |
| 23022 | PALLD | HTA11_9341_2000001011 | Human | Colorectum | SER | 4.39e-05 | -8.14e-01 | -0.00410000000000005 |
| 23022 | PALLD | HTA11_7862_2000001011 | Human | Colorectum | AD | 1.50e-07 | -8.21e-01 | -0.0179 |
| 23022 | PALLD | HTA11_866_3004761011 | Human | Colorectum | AD | 5.68e-19 | -8.00e-01 | 0.096 |
| Page: 1 2 3 4 5 6 7 8 9 10 11 12 |
| Tissue | Expression Dynamics | Abbreviation |
| Cervix | 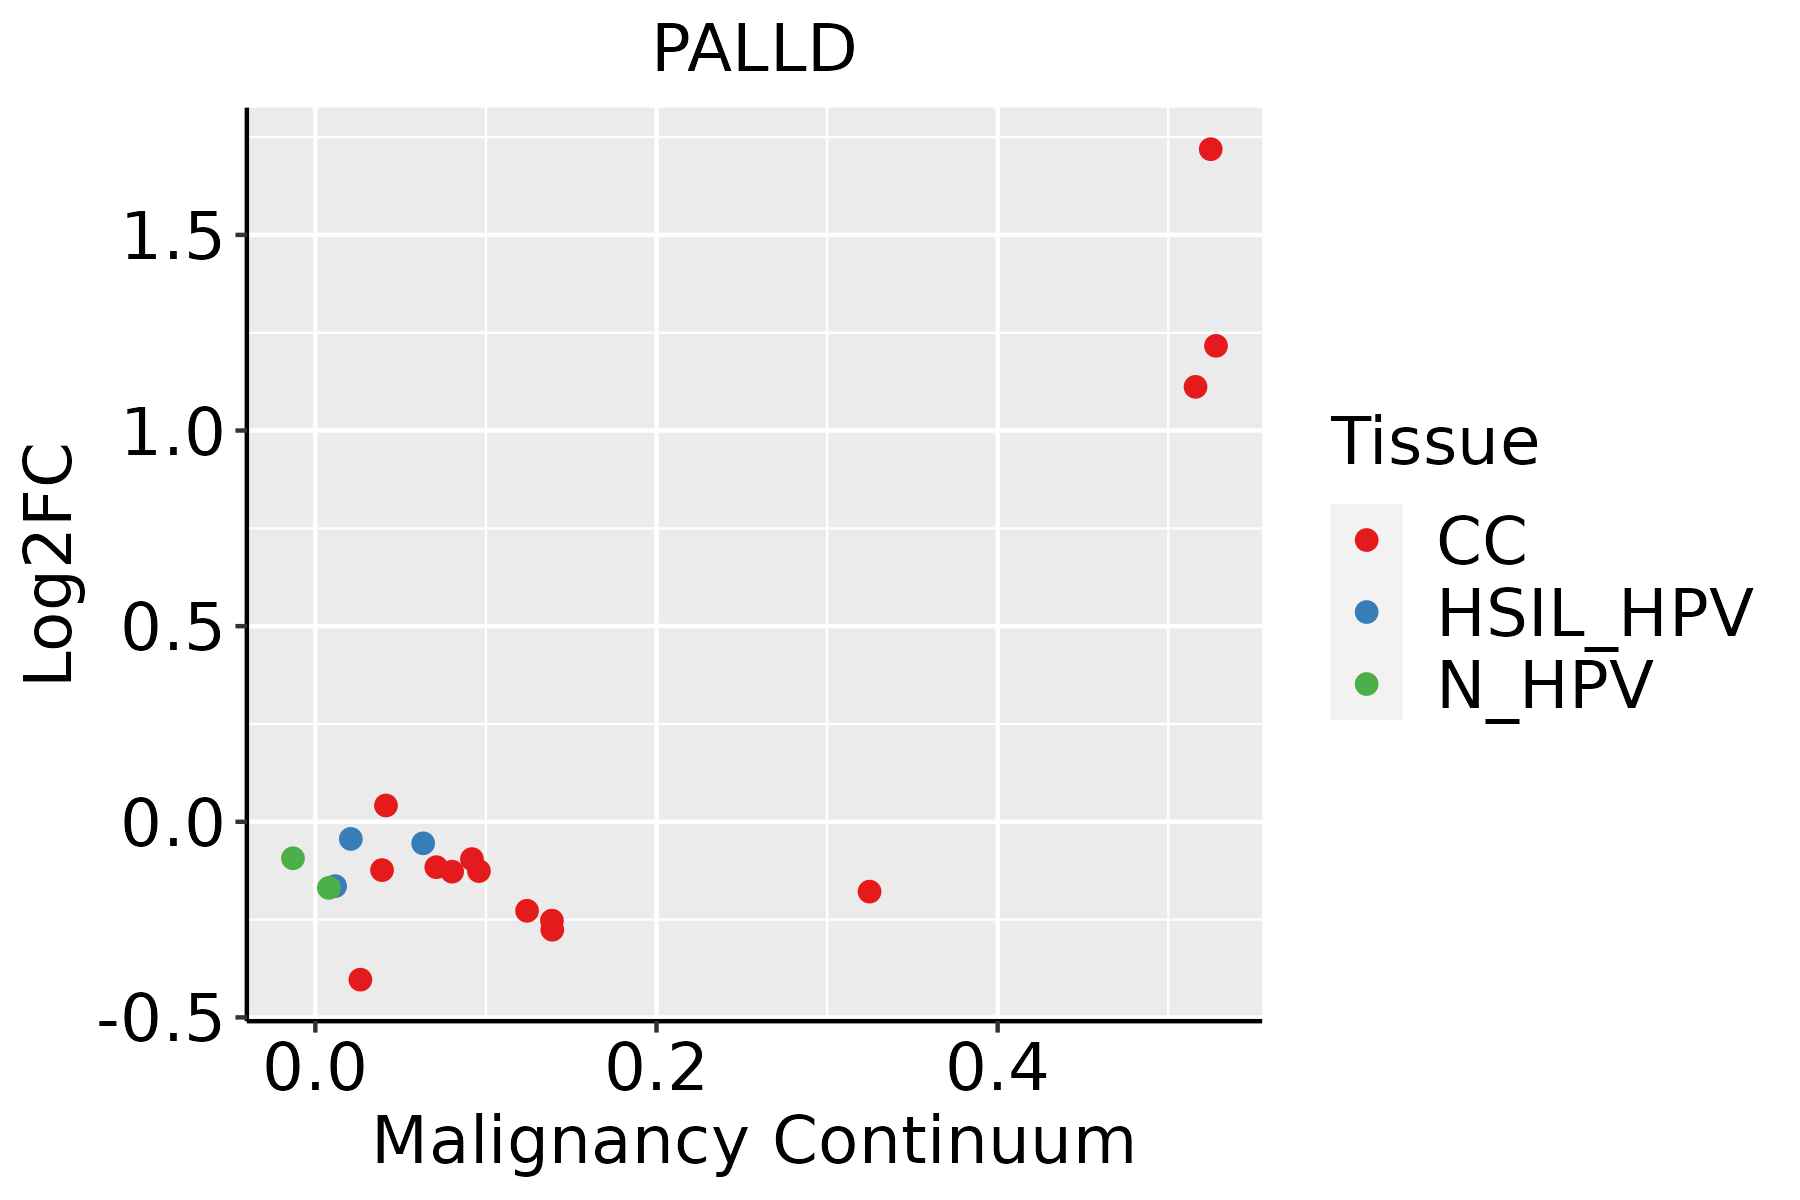 | CC: Cervix cancer |
| HSIL_HPV: HPV-infected high-grade squamous intraepithelial lesions | ||
| N_HPV: HPV-infected normal cervix | ||
| Colorectum (GSE201348) |  | FAP: Familial adenomatous polyposis |
| CRC: Colorectal cancer | ||
| Colorectum (HTA11) |  | AD: Adenomas |
| SER: Sessile serrated lesions | ||
| MSI-H: Microsatellite-high colorectal cancer | ||
| MSS: Microsatellite stable colorectal cancer | ||
| Endometrium | 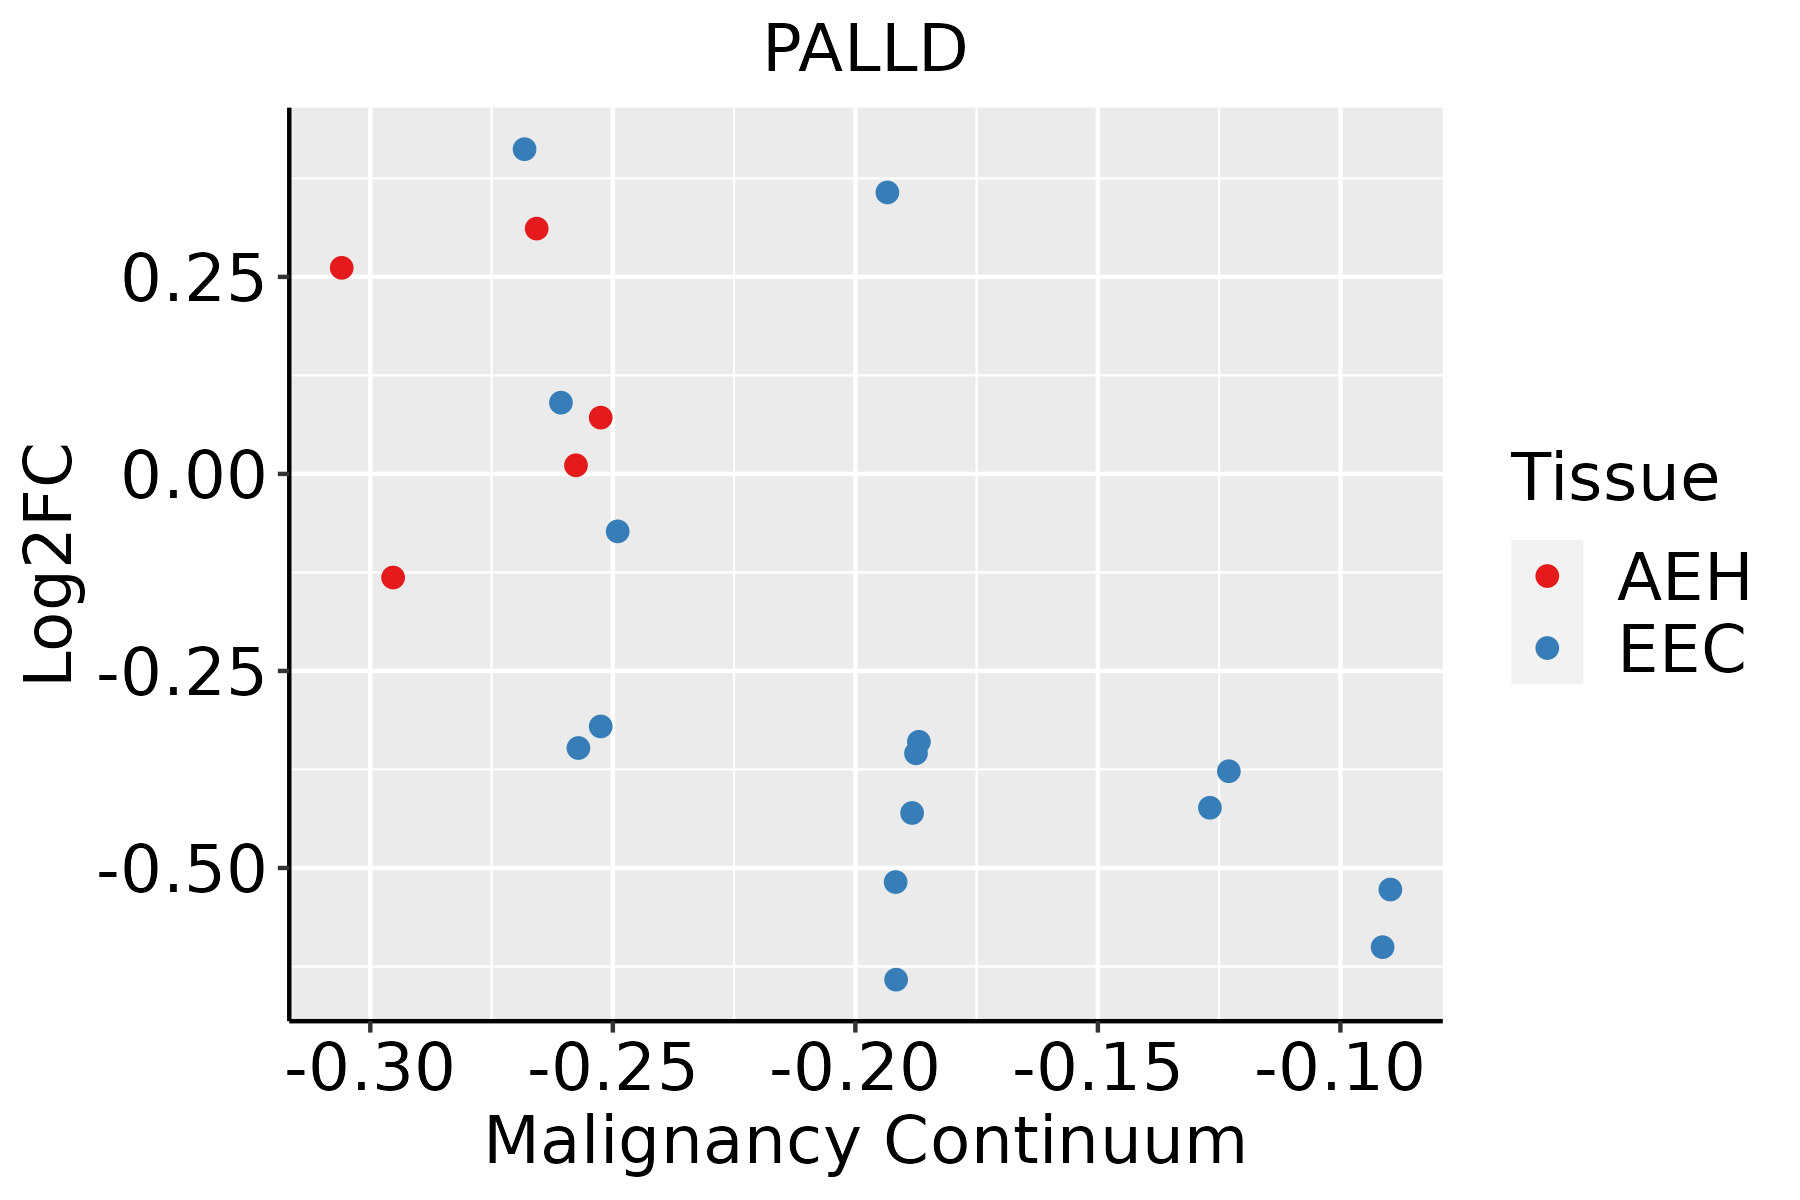 | AEH: Atypical endometrial hyperplasia |
| EEC: Endometrioid Cancer | ||
| Esophagus | 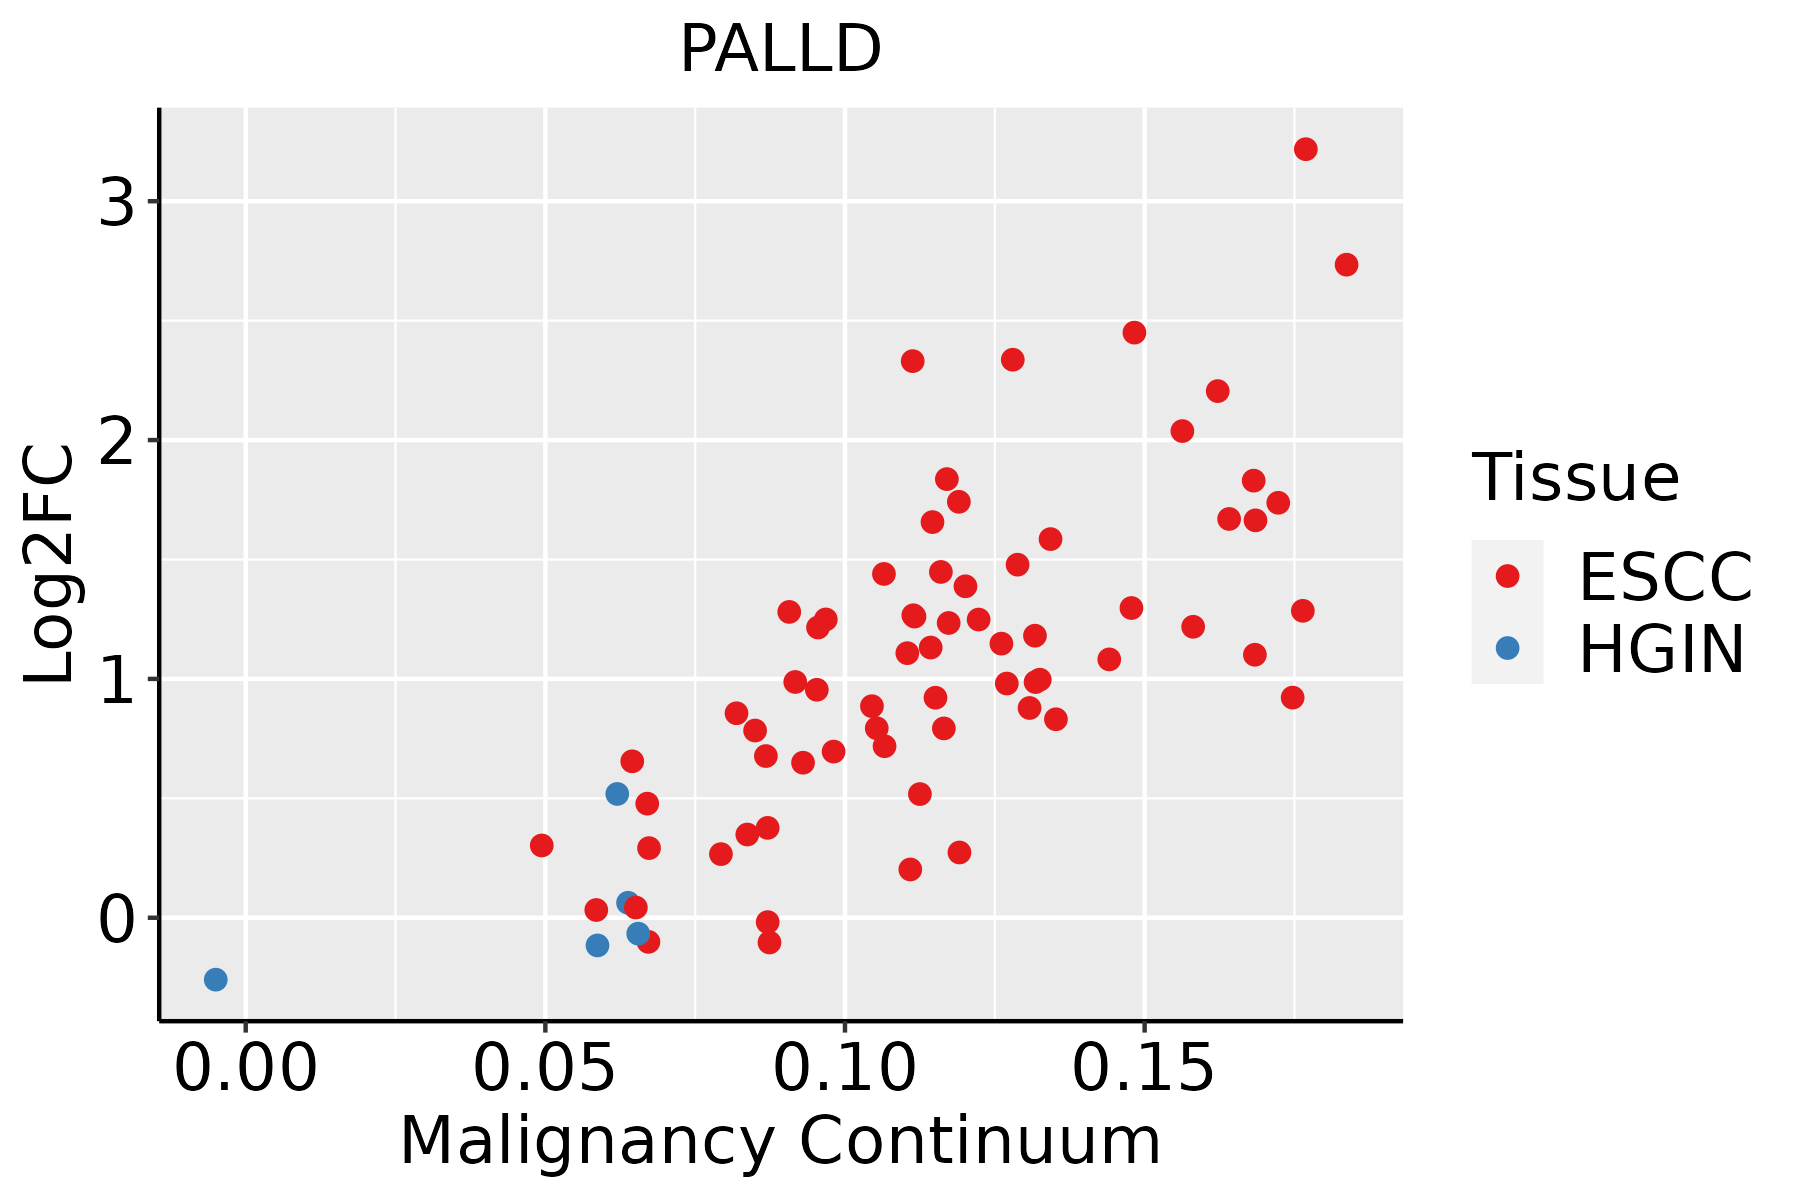 | ESCC: Esophageal squamous cell carcinoma |
| HGIN: High-grade intraepithelial neoplasias | ||
| LGIN: Low-grade intraepithelial neoplasias | ||
| Liver | 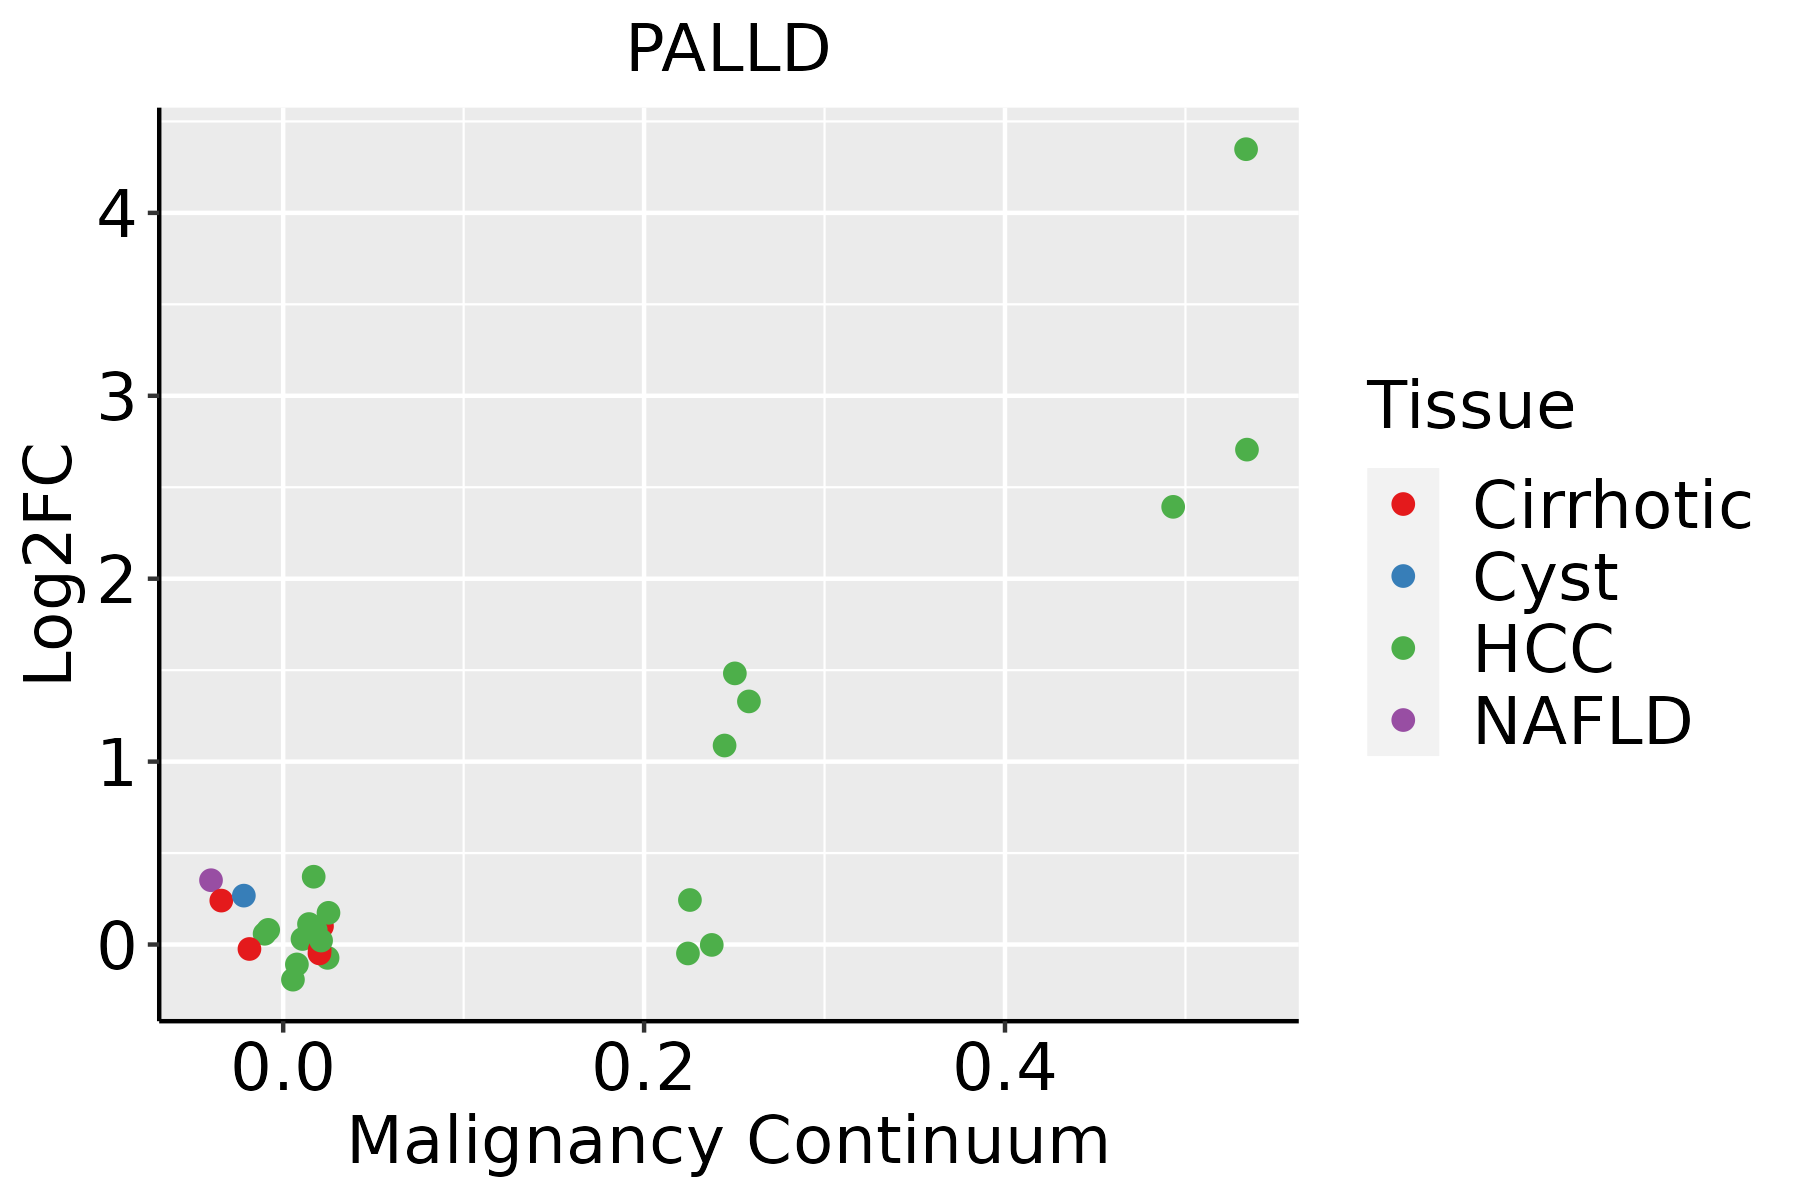 | HCC: Hepatocellular carcinoma |
| NAFLD: Non-alcoholic fatty liver disease | ||
| Lung | 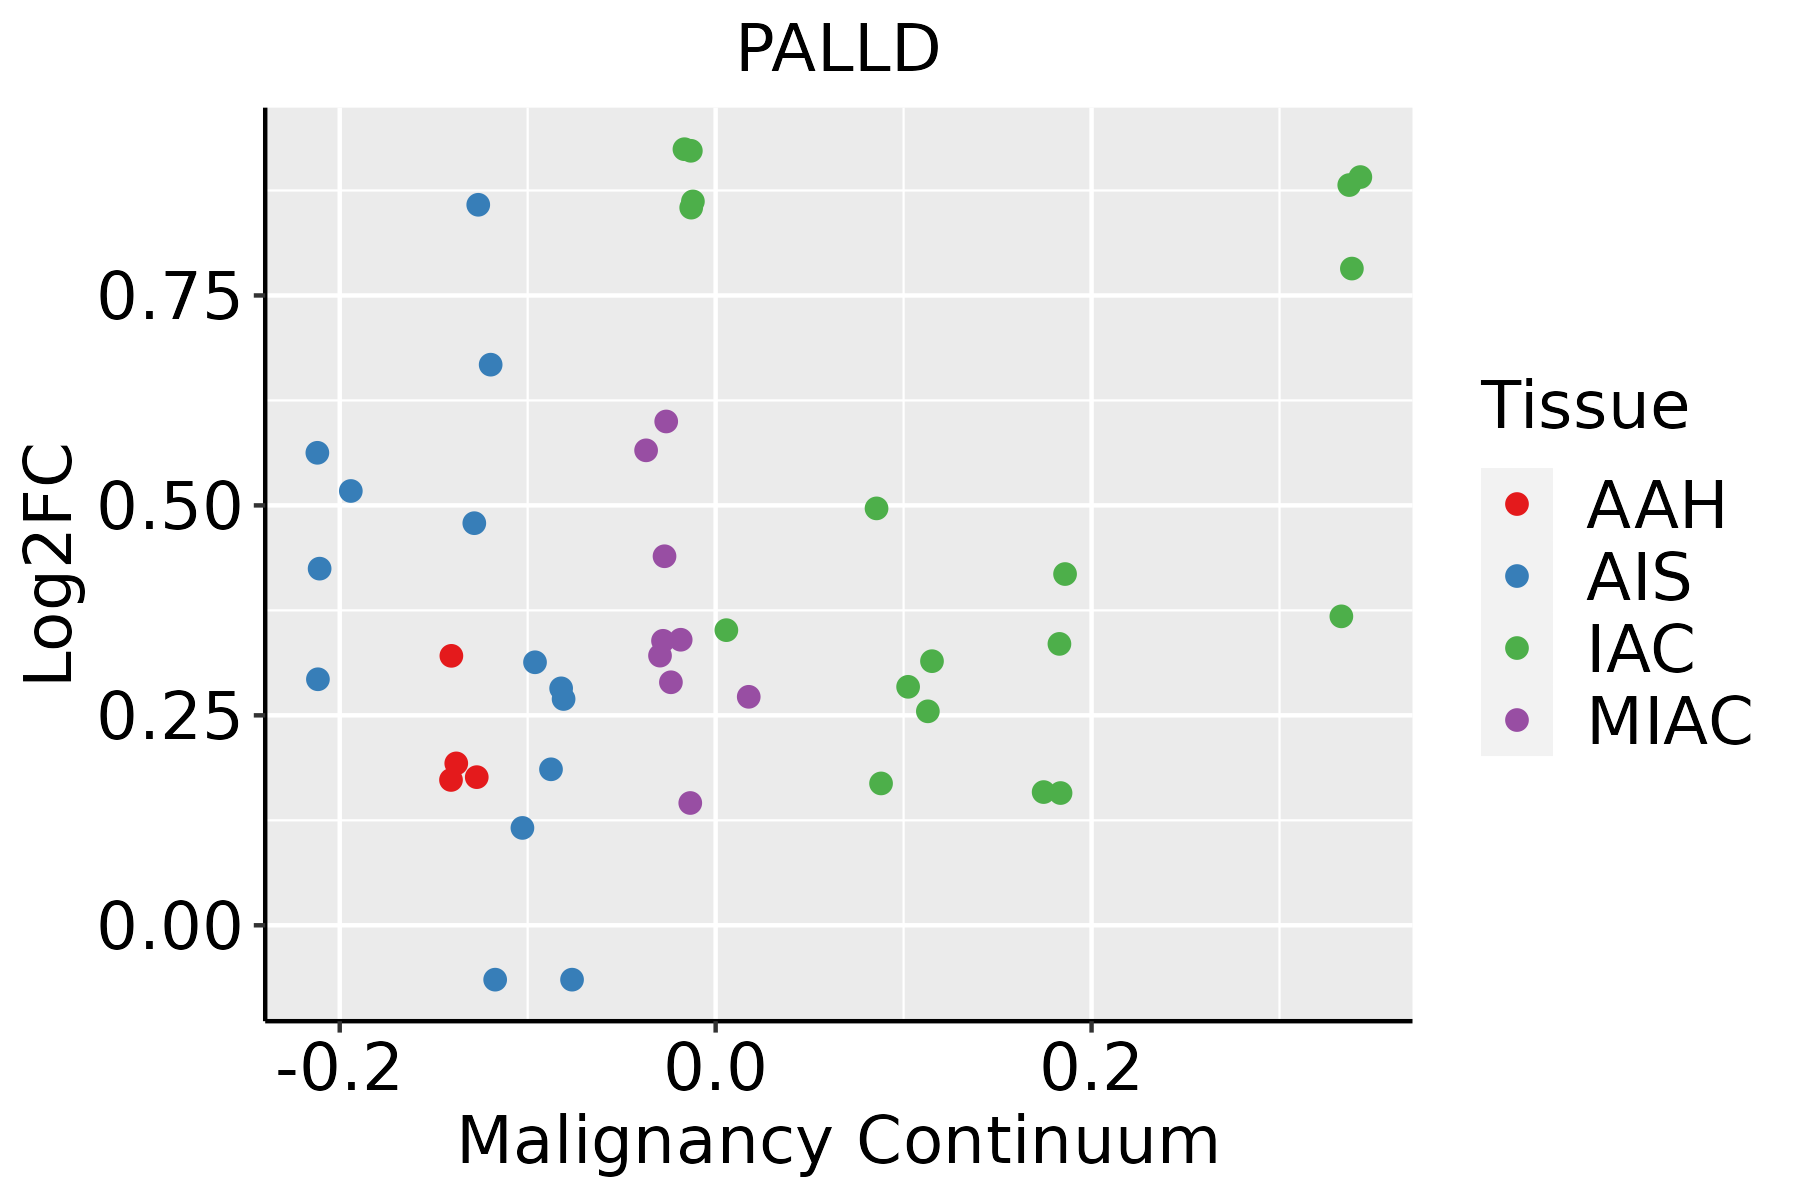 | AAH: Atypical adenomatous hyperplasia |
| AIS: Adenocarcinoma in situ | ||
| IAC: Invasive lung adenocarcinoma | ||
| MIA: Minimally invasive adenocarcinoma | ||
| Oral Cavity |  | EOLP: Erosive Oral lichen planus |
| LP: leukoplakia | ||
| NEOLP: Non-erosive oral lichen planus | ||
| OSCC: Oral squamous cell carcinoma | ||
| Prostate |  | BPH: Benign Prostatic Hyperplasia |
| Skin |  | AK: Actinic keratosis |
| cSCC: Cutaneous squamous cell carcinoma | ||
| SCCIS:squamous cell carcinoma in situ | ||
| Thyroid | 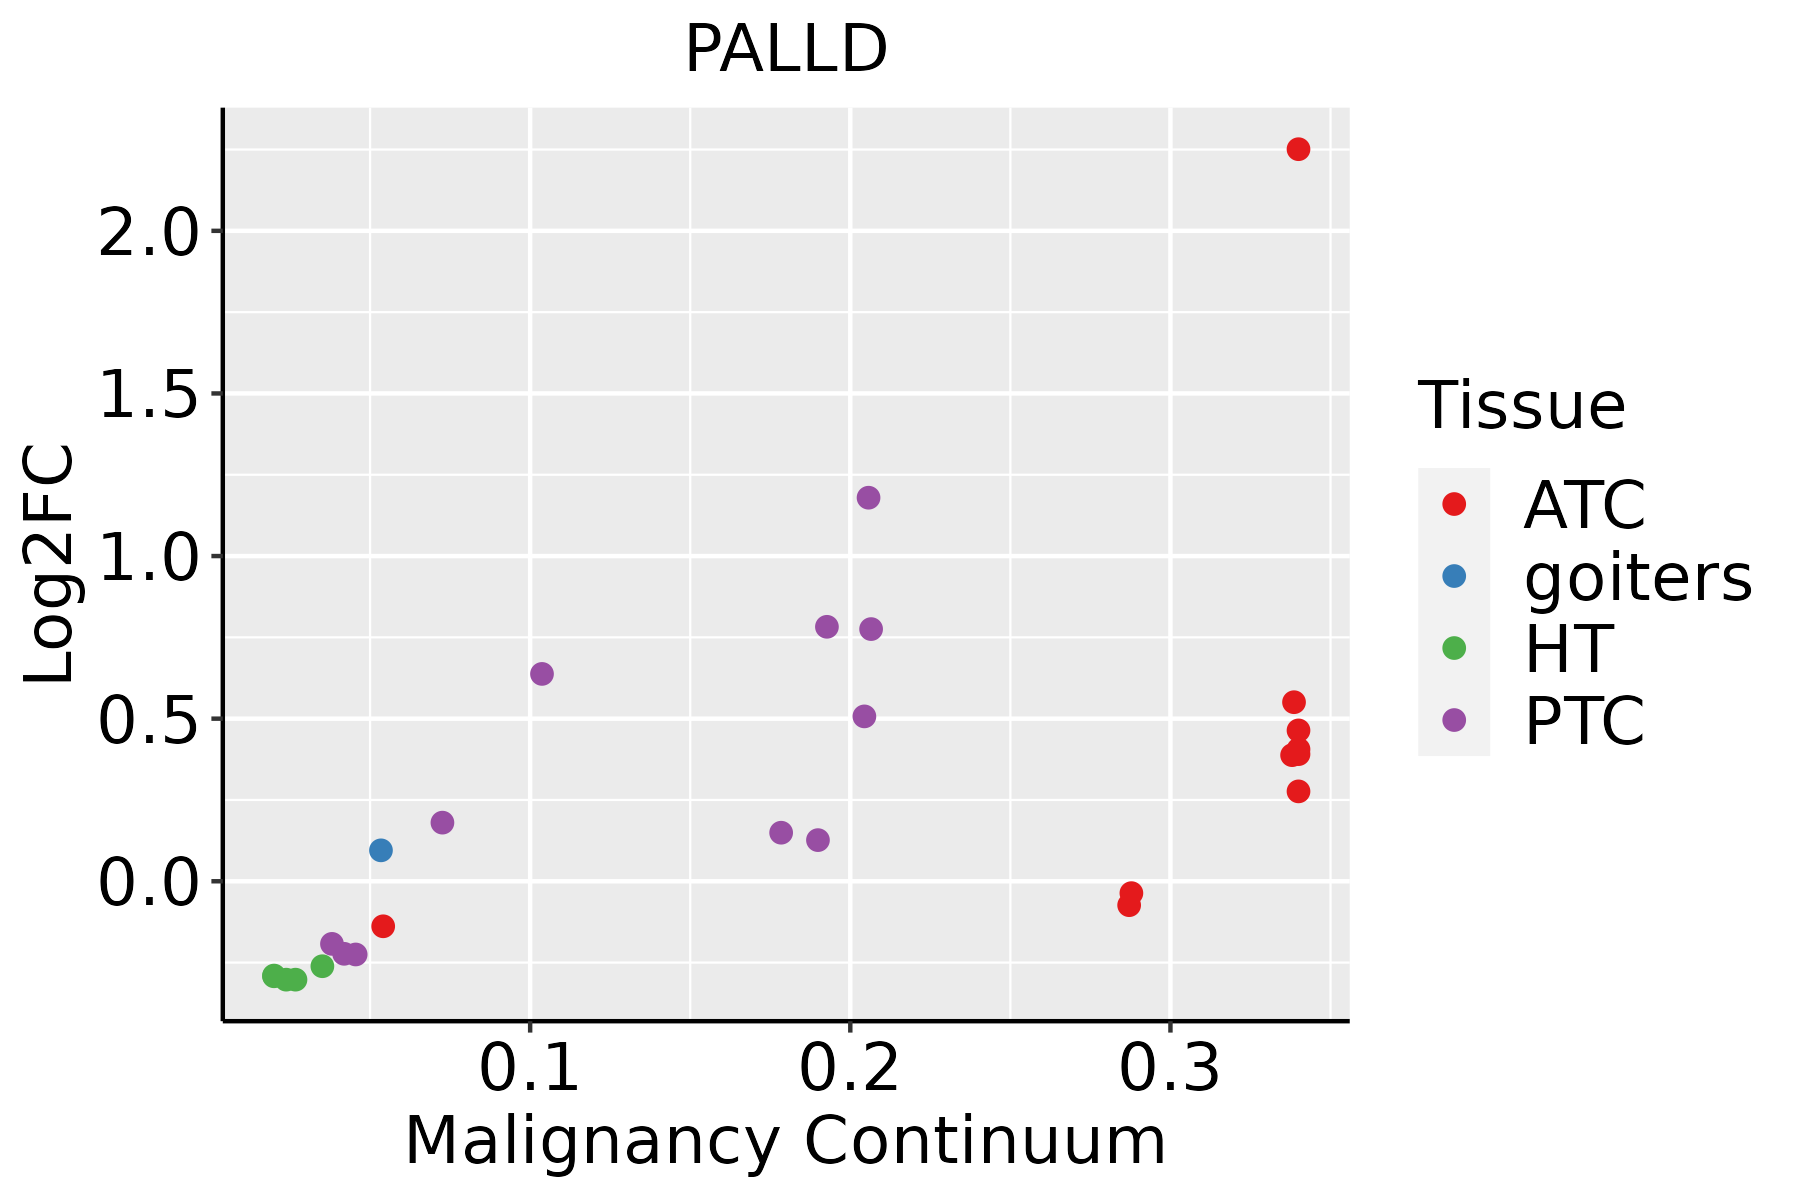 | ATC: Anaplastic thyroid cancer |
| HT: Hashimoto's thyroiditis | ||
| PTC: Papillary thyroid cancer |
| ∗log2FC in expression of this searched gene in stem-like cells from each diseased tissue sample relative to stem-like cells in normal samples in each tissue plotted against the malignancy continuum. Samples are colored based on if they are from different disease stage. |
Top |
Malignant transformation related pathway analysis |
| Find out the enriched GO biological processes and KEGG pathways involved in transition from healthy to precancer to cancer |
| Tissue | Disease Stage | Enriched GO biological Processes |
| Colorectum | AD |  |
| Colorectum | SER |  |
| Colorectum | MSS |  |
| Colorectum | MSI-H |  |
| Colorectum | FAP |  |
| ∗Top 15 enriched GO BP terms are showed in the bar plot of each disease state in each tissue. Each row represents a significant GO biological process which is colored according to the -log10(p.adjust). |
| Page: 1 2 3 4 5 6 7 8 9 |
| GO ID | Tissue | Disease Stage | Description | Gene Ratio | Bg Ratio | pvalue | p.adjust | Count |
| GO:00085446 | Cervix | CC | epidermis development | 83/2311 | 324/18723 | 3.91e-11 | 8.54e-09 | 83 |
| GO:00435884 | Cervix | CC | skin development | 71/2311 | 263/18723 | 8.04e-11 | 1.46e-08 | 71 |
| GO:00302164 | Cervix | CC | keratinocyte differentiation | 42/2311 | 139/18723 | 1.74e-08 | 1.28e-06 | 42 |
| GO:00099137 | Cervix | CC | epidermal cell differentiation | 53/2311 | 202/18723 | 5.48e-08 | 3.25e-06 | 53 |
| GO:00615647 | Cervix | CC | axon development | 89/2311 | 467/18723 | 1.71e-05 | 3.27e-04 | 89 |
| GO:00074097 | Cervix | CC | axonogenesis | 78/2311 | 418/18723 | 1.14e-04 | 1.43e-03 | 78 |
| GO:000206410 | Cervix | CC | epithelial cell development | 45/2311 | 220/18723 | 4.14e-04 | 4.21e-03 | 45 |
| GO:000854423 | Cervix | N_HPV | epidermis development | 21/534 | 324/18723 | 4.32e-04 | 6.01e-03 | 21 |
| GO:004358821 | Cervix | N_HPV | skin development | 18/534 | 263/18723 | 5.79e-04 | 7.67e-03 | 18 |
| GO:0008037 | Cervix | N_HPV | cell recognition | 15/534 | 225/18723 | 2.09e-03 | 2.00e-02 | 15 |
| GO:0098742 | Cervix | N_HPV | cell-cell adhesion via plasma-membrane adhesion molecules | 17/534 | 273/18723 | 2.26e-03 | 2.11e-02 | 17 |
| GO:0002064 | Colorectum | AD | epithelial cell development | 89/3918 | 220/18723 | 2.98e-11 | 3.52e-09 | 89 |
| GO:0007409 | Colorectum | AD | axonogenesis | 122/3918 | 418/18723 | 3.36e-05 | 6.15e-04 | 122 |
| GO:0061564 | Colorectum | AD | axon development | 132/3918 | 467/18723 | 8.40e-05 | 1.31e-03 | 132 |
| GO:0009913 | Colorectum | AD | epidermal cell differentiation | 58/3918 | 202/18723 | 5.16e-03 | 3.42e-02 | 58 |
| GO:0007411 | Colorectum | AD | axon guidance | 64/3918 | 227/18723 | 5.41e-03 | 3.55e-02 | 64 |
| GO:0008544 | Colorectum | AD | epidermis development | 87/3918 | 324/18723 | 5.99e-03 | 3.76e-02 | 87 |
| GO:0097485 | Colorectum | AD | neuron projection guidance | 64/3918 | 228/18723 | 6.02e-03 | 3.78e-02 | 64 |
| GO:00020641 | Colorectum | SER | epithelial cell development | 64/2897 | 220/18723 | 1.96e-07 | 1.10e-05 | 64 |
| GO:00074111 | Colorectum | SER | axon guidance | 51/2897 | 227/18723 | 3.29e-03 | 2.82e-02 | 51 |
| Page: 1 2 3 4 5 6 7 8 |
| Pathway ID | Tissue | Disease Stage | Description | Gene Ratio | Bg Ratio | pvalue | p.adjust | qvalue | Count |
| Page: 1 |
Top |
Cell-cell communication analysis |
| Identification of potential cell-cell interactions between two cell types and their ligand-receptor pairs for different disease states |
| Ligand | Receptor | LRpair | Pathway | Tissue | Disease Stage |
| Page: 1 |
Top |
Single-cell gene regulatory network inference analysis |
| Find out the significant the regulons (TFs) and the target genes of each regulon across cell types for different disease states |
| TF | Cell Type | Tissue | Disease Stage | Target Gene | RSS | Regulon Activity |
| ∗The dot plots of a searched regulon are shown for all cell subpopulations in each disease state of each tissue based on the regulon specific score inferred using pySCENIC and by calculating the average expression. |
| Page: 1 |
Top |
Somatic mutation of malignant transformation related genes |
| Annotation of somatic variants for genes involved in malignant transformation |
| Hugo Symbol | Variant Class | Variant Classification | dbSNP RS | HGVSc | HGVSp | HGVSp Short | SWISSPROT | BIOTYPE | SIFT | PolyPhen | Tumor Sample Barcode | Tissue | Histology | Sex | Age | Stage | Therapy Types | Drugs | Outcome |
| PALLD | SNV | Missense_Mutation | novel | c.1084N>C | p.Glu362Gln | p.E362Q | Q8WX93 | protein_coding | tolerated(0.14) | probably_damaging(0.996) | TCGA-A1-A0SH-01 | Breast | breast invasive carcinoma | Female | <65 | I/II | Chemotherapy | tc | SD |
| PALLD | SNV | Missense_Mutation | c.566N>C | p.Arg189Thr | p.R189T | Q8WX93 | protein_coding | deleterious(0.01) | benign(0.224) | TCGA-AC-A23H-01 | Breast | breast invasive carcinoma | Female | >=65 | I/II | Unknown | Unknown | PD | |
| PALLD | SNV | Missense_Mutation | rs187404166 | c.1354G>A | p.Val452Met | p.V452M | Q8WX93 | protein_coding | deleterious(0) | possibly_damaging(0.891) | TCGA-AC-A62X-01 | Breast | breast invasive carcinoma | Female | >=65 | I/II | Unknown | Unknown | SD |
| PALLD | SNV | Missense_Mutation | novel | c.22G>C | p.Glu8Gln | p.E8Q | Q8WX93 | protein_coding | tolerated(0.09) | benign(0.028) | TCGA-AC-A6IW-01 | Breast | breast invasive carcinoma | Female | >=65 | I/II | Unknown | Unknown | SD |
| PALLD | SNV | Missense_Mutation | novel | c.1159C>A | p.Gln387Lys | p.Q387K | Q8WX93 | protein_coding | deleterious(0.02) | possibly_damaging(0.787) | TCGA-AN-A046-01 | Breast | breast invasive carcinoma | Female | >=65 | I/II | Unknown | Unknown | SD |
| PALLD | SNV | Missense_Mutation | novel | c.1981N>T | p.Ala661Ser | p.A661S | Q8WX93 | protein_coding | tolerated(0.8) | benign(0) | TCGA-AR-A24O-01 | Breast | breast invasive carcinoma | Female | <65 | III/IV | Chemotherapy | cytoxan | PD |
| PALLD | SNV | Missense_Mutation | rs780911413 | c.427N>T | p.Arg143Cys | p.R143C | Q8WX93 | protein_coding | deleterious(0.03) | benign(0) | TCGA-E2-A15M-01 | Breast | breast invasive carcinoma | Female | >=65 | I/II | Hormone Therapy | arimidex | SD |
| PALLD | SNV | Missense_Mutation | rs758309395 | c.1829N>T | p.Thr610Met | p.T610M | Q8WX93 | protein_coding | deleterious(0.04) | possibly_damaging(0.65) | TCGA-E9-A1RF-01 | Breast | breast invasive carcinoma | Female | >=65 | III/IV | Hormone Therapy | tamoxiphen | SD |
| PALLD | SNV | Missense_Mutation | novel | c.3349N>T | p.Asp1117Tyr | p.D1117Y | Q8WX93 | protein_coding | deleterious(0) | probably_damaging(1) | TCGA-PL-A8LY-01 | Breast | breast invasive carcinoma | Female | <65 | I/II | Unknown | Unknown | SD |
| PALLD | SNV | Missense_Mutation | novel | c.407G>A | p.Ser136Asn | p.S136N | Q8WX93 | protein_coding | tolerated(0.18) | possibly_damaging(0.537) | TCGA-2W-A8YY-01 | Cervix | cervical & endocervical cancer | Female | <65 | I/II | Chemotherapy | cisplatin | CR |
| Page: 1 2 3 4 5 6 7 8 9 10 |
Top |
Related drugs of malignant transformation related genes |
| Identification of chemicals and drugs interact with genes involved in malignant transfromation |
| (DGIdb 4.0) |
| Entrez ID | Symbol | Category | Interaction Types | Drug Claim Name | Drug Name | PMIDs |
| Page: 1 |

Copyright 2023-Present -The University of Texas Health Science Center at Houston |