
|
|||||
|
 | |
| |
| |
| |
| |
| |
|
Gene: PAK6 |
Gene summary for PAK6 |
| Gene information | Species | Human | Gene symbol | PAK6 | Gene ID | 56924 |
| Gene name | p21 (RAC1) activated kinase 6 | |
| Gene Alias | PAK5 | |
| Cytomap | 15q15.1 | |
| Gene Type | protein-coding | GO ID | GO:0000165 | UniProtAcc | A0A024R9Q4 |
Top |
Malignant transformation analysis |
| Identification of the aberrant gene expression in precancerous and cancerous lesions by comparing the gene expression of stem-like cells in diseased tissues with normal stem cells |
| Entrez ID | Symbol | Replicates | Species | Organ | Tissue | Adj P-value | Log2FC | Malignancy |
| 56924 | PAK6 | C21 | Human | Oral cavity | OSCC | 1.30e-21 | 6.24e-01 | 0.2678 |
| 56924 | PAK6 | C30 | Human | Oral cavity | OSCC | 2.13e-13 | 6.50e-01 | 0.3055 |
| 56924 | PAK6 | C38 | Human | Oral cavity | OSCC | 4.52e-03 | 3.65e-01 | 0.172 |
| 56924 | PAK6 | C43 | Human | Oral cavity | OSCC | 4.04e-13 | 2.52e-01 | 0.1704 |
| 56924 | PAK6 | C46 | Human | Oral cavity | OSCC | 6.37e-12 | 3.27e-01 | 0.1673 |
| 56924 | PAK6 | C51 | Human | Oral cavity | OSCC | 3.99e-04 | 3.28e-01 | 0.2674 |
| 56924 | PAK6 | C08 | Human | Oral cavity | OSCC | 3.05e-02 | 9.81e-02 | 0.1919 |
| 56924 | PAK6 | LN46 | Human | Oral cavity | OSCC | 1.58e-03 | 2.29e-01 | 0.1666 |
| 56924 | PAK6 | LP15 | Human | Oral cavity | LP | 3.79e-03 | 6.70e-01 | 0.2174 |
| 56924 | PAK6 | SYSMH1 | Human | Oral cavity | OSCC | 3.43e-02 | 1.31e-01 | 0.1127 |
| 56924 | PAK6 | SYSMH3 | Human | Oral cavity | OSCC | 3.23e-05 | 1.73e-01 | 0.2442 |
| 56924 | PAK6 | P4_S8_cSCC | Human | Skin | cSCC | 2.60e-05 | 2.01e-01 | -0.3095 |
| 56924 | PAK6 | P1_cSCC | Human | Skin | cSCC | 5.30e-18 | 5.12e-01 | 0.0292 |
| 56924 | PAK6 | P2_cSCC | Human | Skin | cSCC | 4.46e-07 | 2.36e-01 | -0.024 |
| 56924 | PAK6 | P4_cSCC | Human | Skin | cSCC | 1.01e-09 | 2.23e-01 | -0.00290000000000005 |
| 56924 | PAK6 | P10_cSCC | Human | Skin | cSCC | 8.07e-13 | 3.79e-01 | 0.1017 |
| 56924 | PAK6 | cSCC_p1 | Human | Skin | cSCC | 9.81e-03 | 1.57e-01 | -0.1916 |
| 56924 | PAK6 | cSCC_p8 | Human | Skin | cSCC | 1.71e-05 | 1.08e-01 | -0.1971 |
| 56924 | PAK6 | cSCC_p9 | Human | Skin | cSCC | 1.91e-03 | 1.12e-01 | -0.1991 |
| Page: 1 |
| Tissue | Expression Dynamics | Abbreviation |
| Oral Cavity |  | EOLP: Erosive Oral lichen planus |
| LP: leukoplakia | ||
| NEOLP: Non-erosive oral lichen planus | ||
| OSCC: Oral squamous cell carcinoma | ||
| Skin | 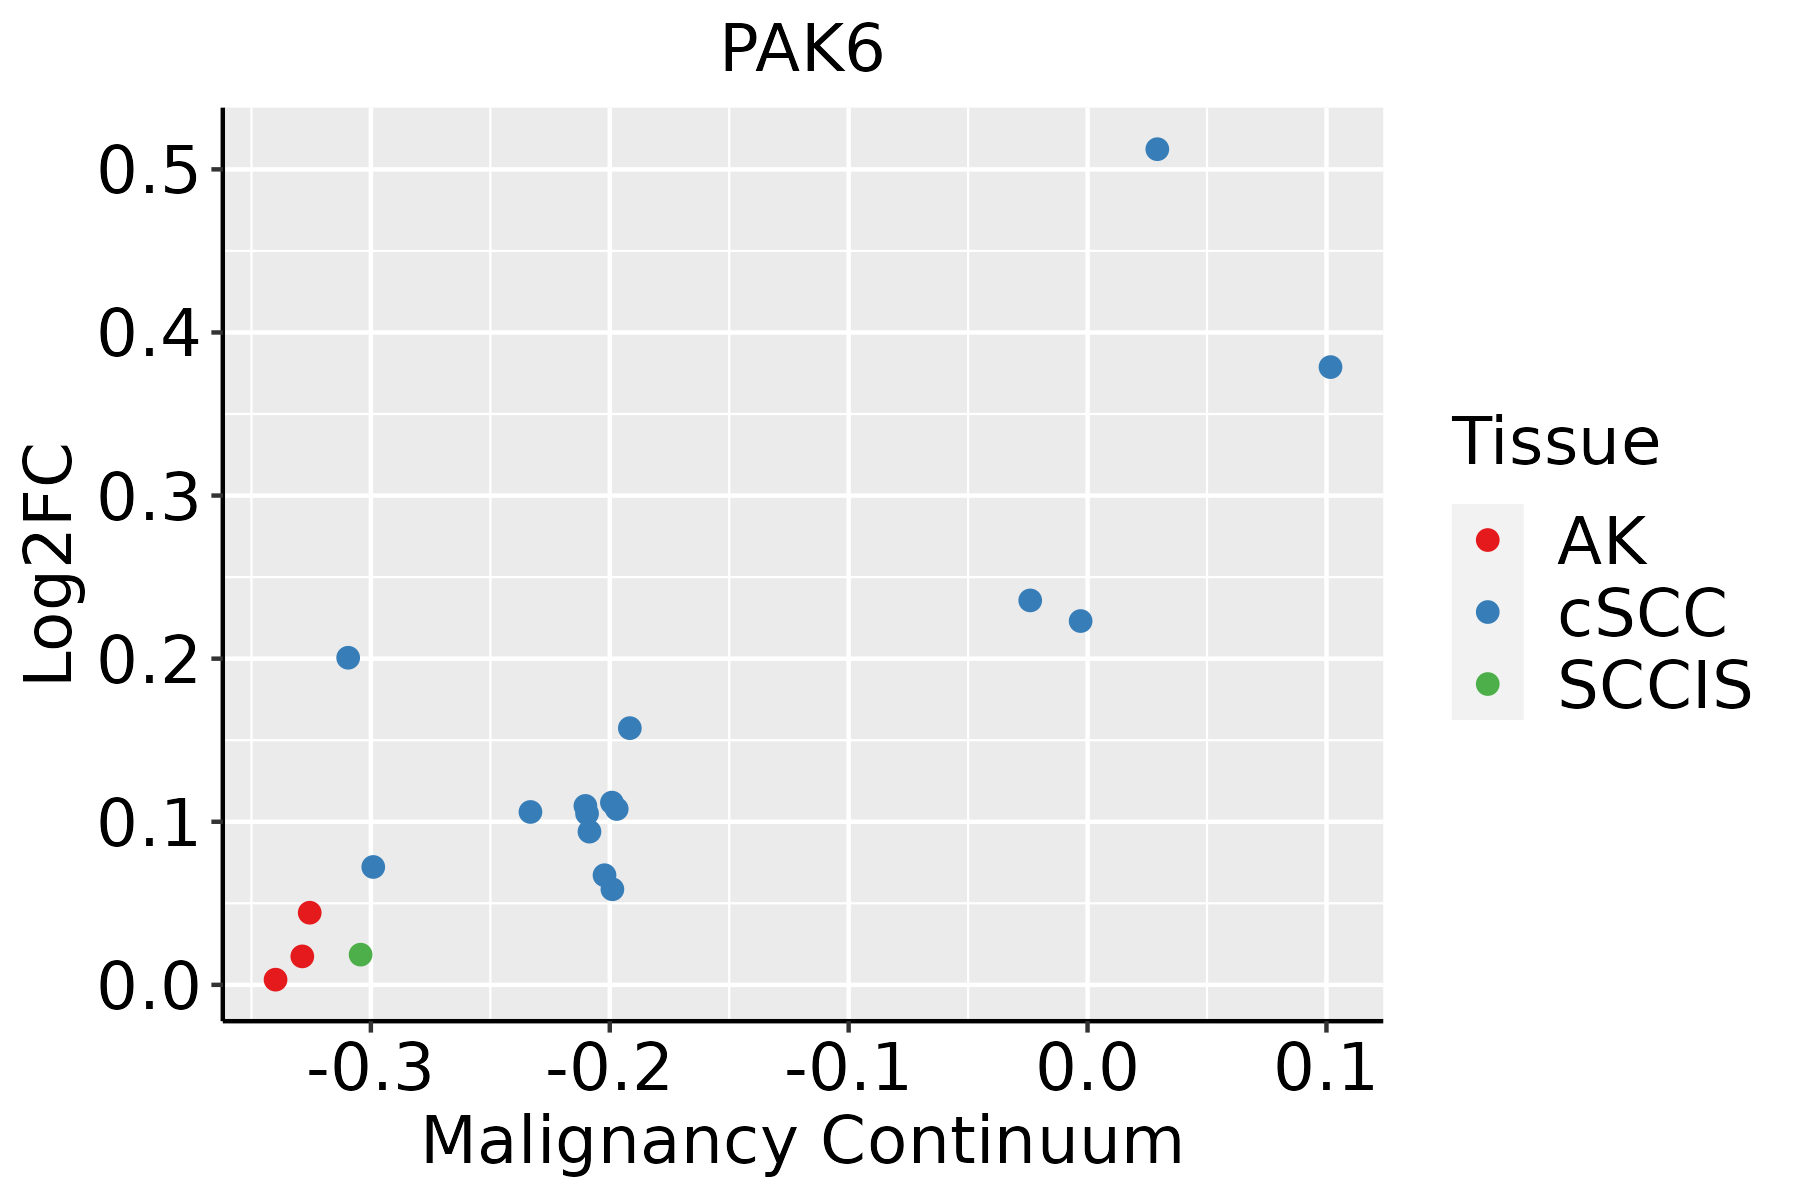 | AK: Actinic keratosis |
| cSCC: Cutaneous squamous cell carcinoma | ||
| SCCIS:squamous cell carcinoma in situ |
| ∗log2FC in expression of this searched gene in stem-like cells from each diseased tissue sample relative to stem-like cells in normal samples in each tissue plotted against the malignancy continuum. Samples are colored based on if they are from different disease stage. |
Top |
Malignant transformation related pathway analysis |
| Find out the enriched GO biological processes and KEGG pathways involved in transition from healthy to precancer to cancer |
| Tissue | Disease Stage | Enriched GO biological Processes |
| Colorectum | AD |  |
| Colorectum | SER |  |
| Colorectum | MSS |  |
| Colorectum | MSI-H |  |
| Colorectum | FAP |  |
| ∗Top 15 enriched GO BP terms are showed in the bar plot of each disease state in each tissue. Each row represents a significant GO biological process which is colored according to the -log10(p.adjust). |
| Page: 1 2 3 4 5 6 7 8 9 |
| GO ID | Tissue | Disease Stage | Description | Gene Ratio | Bg Ratio | pvalue | p.adjust | Count |
| GO:001604917 | Oral cavity | OSCC | cell growth | 268/7305 | 482/18723 | 6.55e-14 | 3.51e-12 | 268 |
| GO:00485889 | Oral cavity | OSCC | developmental cell growth | 116/7305 | 234/18723 | 6.20e-04 | 3.50e-03 | 116 |
| GO:00605609 | Oral cavity | OSCC | developmental growth involved in morphogenesis | 116/7305 | 234/18723 | 6.20e-04 | 3.50e-03 | 116 |
| GO:19901388 | Oral cavity | OSCC | neuron projection extension | 86/7305 | 172/18723 | 2.13e-03 | 9.80e-03 | 86 |
| GO:001604918 | Oral cavity | LP | cell growth | 155/4623 | 482/18723 | 1.08e-04 | 1.31e-03 | 155 |
| GO:001604925 | Skin | cSCC | cell growth | 173/4864 | 482/18723 | 7.21e-07 | 1.34e-05 | 173 |
| GO:006056023 | Skin | cSCC | developmental growth involved in morphogenesis | 78/4864 | 234/18723 | 7.08e-03 | 3.40e-02 | 78 |
| GO:199013823 | Skin | cSCC | neuron projection extension | 59/4864 | 172/18723 | 9.20e-03 | 4.20e-02 | 59 |
| Page: 1 |
| Pathway ID | Tissue | Disease Stage | Description | Gene Ratio | Bg Ratio | pvalue | p.adjust | qvalue | Count |
| hsa0517027 | Oral cavity | OSCC | Human immunodeficiency virus 1 infection | 133/3704 | 212/8465 | 1.42e-08 | 1.40e-07 | 7.12e-08 | 133 |
| hsa0451019 | Oral cavity | OSCC | Focal adhesion | 128/3704 | 203/8465 | 1.71e-08 | 1.63e-07 | 8.31e-08 | 128 |
| hsa0521116 | Oral cavity | OSCC | Renal cell carcinoma | 51/3704 | 69/8465 | 3.30e-07 | 2.05e-06 | 1.04e-06 | 51 |
| hsa046606 | Oral cavity | OSCC | T cell receptor signaling pathway | 67/3704 | 104/8465 | 1.57e-05 | 6.75e-05 | 3.44e-05 | 67 |
| hsa0481026 | Oral cavity | OSCC | Regulation of actin cytoskeleton | 129/3704 | 229/8465 | 7.14e-05 | 2.74e-04 | 1.40e-04 | 129 |
| hsa0401216 | Oral cavity | OSCC | ErbB signaling pathway | 55/3704 | 85/8465 | 7.46e-05 | 2.81e-04 | 1.43e-04 | 55 |
| hsa0436014 | Oral cavity | OSCC | Axon guidance | 97/3704 | 182/8465 | 5.59e-03 | 1.33e-02 | 6.76e-03 | 97 |
| hsa05170111 | Oral cavity | OSCC | Human immunodeficiency virus 1 infection | 133/3704 | 212/8465 | 1.42e-08 | 1.40e-07 | 7.12e-08 | 133 |
| hsa04510110 | Oral cavity | OSCC | Focal adhesion | 128/3704 | 203/8465 | 1.71e-08 | 1.63e-07 | 8.31e-08 | 128 |
| hsa0521117 | Oral cavity | OSCC | Renal cell carcinoma | 51/3704 | 69/8465 | 3.30e-07 | 2.05e-06 | 1.04e-06 | 51 |
| hsa0466012 | Oral cavity | OSCC | T cell receptor signaling pathway | 67/3704 | 104/8465 | 1.57e-05 | 6.75e-05 | 3.44e-05 | 67 |
| hsa04810111 | Oral cavity | OSCC | Regulation of actin cytoskeleton | 129/3704 | 229/8465 | 7.14e-05 | 2.74e-04 | 1.40e-04 | 129 |
| hsa0401217 | Oral cavity | OSCC | ErbB signaling pathway | 55/3704 | 85/8465 | 7.46e-05 | 2.81e-04 | 1.43e-04 | 55 |
| hsa0436015 | Oral cavity | OSCC | Axon guidance | 97/3704 | 182/8465 | 5.59e-03 | 1.33e-02 | 6.76e-03 | 97 |
| hsa0517028 | Oral cavity | LP | Human immunodeficiency virus 1 infection | 92/2418 | 212/8465 | 2.18e-06 | 2.20e-05 | 1.42e-05 | 92 |
| hsa0521125 | Oral cavity | LP | Renal cell carcinoma | 30/2418 | 69/8465 | 5.60e-03 | 2.25e-02 | 1.45e-02 | 30 |
| hsa0517037 | Oral cavity | LP | Human immunodeficiency virus 1 infection | 92/2418 | 212/8465 | 2.18e-06 | 2.20e-05 | 1.42e-05 | 92 |
| hsa0521135 | Oral cavity | LP | Renal cell carcinoma | 30/2418 | 69/8465 | 5.60e-03 | 2.25e-02 | 1.45e-02 | 30 |
| Page: 1 |
Top |
Cell-cell communication analysis |
| Identification of potential cell-cell interactions between two cell types and their ligand-receptor pairs for different disease states |
| Ligand | Receptor | LRpair | Pathway | Tissue | Disease Stage |
| Page: 1 |
Top |
Single-cell gene regulatory network inference analysis |
| Find out the significant the regulons (TFs) and the target genes of each regulon across cell types for different disease states |
| TF | Cell Type | Tissue | Disease Stage | Target Gene | RSS | Regulon Activity |
| ∗The dot plots of a searched regulon are shown for all cell subpopulations in each disease state of each tissue based on the regulon specific score inferred using pySCENIC and by calculating the average expression. |
| Page: 1 |
Top |
Somatic mutation of malignant transformation related genes |
| Annotation of somatic variants for genes involved in malignant transformation |
| Hugo Symbol | Variant Class | Variant Classification | dbSNP RS | HGVSc | HGVSp | HGVSp Short | SWISSPROT | BIOTYPE | SIFT | PolyPhen | Tumor Sample Barcode | Tissue | Histology | Sex | Age | Stage | Therapy Types | Drugs | Outcome |
| PAK6 | SNV | Missense_Mutation | rs775199257 | c.571N>T | p.Arg191Cys | p.R191C | Q9NQU5 | protein_coding | deleterious(0.02) | possibly_damaging(0.791) | TCGA-5L-AAT0-01 | Breast | breast invasive carcinoma | Female | <65 | I/II | Hormone Therapy | tamoxiphen | SD |
| PAK6 | insertion | Nonsense_Mutation | novel | c.166_167insTTTTCAGATACATAAGAACCCAGTGAGCTGTTCTGAGCCT | p.Pro56LeufsTer9 | p.P56Lfs*9 | Q9NQU5 | protein_coding | TCGA-A8-A07W-01 | Breast | breast invasive carcinoma | Female | >=65 | III/IV | Hormone Therapy | exemestane | SD | ||
| PAK6 | SNV | Missense_Mutation | c.730G>A | p.Glu244Lys | p.E244K | Q9NQU5 | protein_coding | tolerated(0.15) | possibly_damaging(0.563) | TCGA-EA-A44S-01 | Cervix | cervical & endocervical cancer | Female | <65 | III/IV | Chemotherapy | carboplatin | SD | |
| PAK6 | SNV | Missense_Mutation | rs544478594 | c.1606N>T | p.Leu536Phe | p.L536F | Q9NQU5 | protein_coding | tolerated(0.21) | probably_damaging(0.975) | TCGA-EK-A2R8-01 | Cervix | cervical & endocervical cancer | Female | <65 | I/II | Unknown | Unknown | SD |
| PAK6 | SNV | Missense_Mutation | rs754797947 | c.2024N>A | p.Arg675Gln | p.R675Q | Q9NQU5 | protein_coding | deleterious(0) | possibly_damaging(0.852) | TCGA-FU-A3HZ-01 | Cervix | cervical & endocervical cancer | Female | <65 | I/II | Chemotherapy | cisplatin | CR |
| PAK6 | SNV | Missense_Mutation | novel | c.449G>T | p.Gly150Val | p.G150V | Q9NQU5 | protein_coding | deleterious(0.02) | benign(0) | TCGA-VS-A9U7-01 | Cervix | cervical & endocervical cancer | Female | <65 | I/II | Chemotherapy | cisplatin | CR |
| PAK6 | SNV | Missense_Mutation | rs752441056 | c.308G>A | p.Arg103His | p.R103H | Q9NQU5 | protein_coding | tolerated(0.17) | benign(0) | TCGA-AA-3495-01 | Colorectum | colon adenocarcinoma | Male | >=65 | I/II | Unknown | Unknown | SD |
| PAK6 | SNV | Missense_Mutation | rs747457346 | c.1556C>T | p.Ala519Val | p.A519V | Q9NQU5 | protein_coding | deleterious(0.01) | benign(0.03) | TCGA-AA-3977-01 | Colorectum | colon adenocarcinoma | Male | >=65 | I/II | Unknown | Unknown | SD |
| PAK6 | SNV | Missense_Mutation | rs751201488 | c.223N>A | p.Ala75Thr | p.A75T | Q9NQU5 | protein_coding | tolerated(0.65) | benign(0) | TCGA-AA-A01P-01 | Colorectum | colon adenocarcinoma | Female | >=65 | III/IV | Unknown | Unknown | PD |
| PAK6 | deletion | Frame_Shift_Del | c.113delC | p.Pro38HisfsTer30 | p.P38Hfs*30 | Q9NQU5 | protein_coding | TCGA-D5-6927-01 | Colorectum | colon adenocarcinoma | Male | <65 | I/II | Unknown | Unknown | SD |
| Page: 1 2 3 4 5 |
Top |
Related drugs of malignant transformation related genes |
| Identification of chemicals and drugs interact with genes involved in malignant transfromation |
| (DGIdb 4.0) |
| Entrez ID | Symbol | Category | Interaction Types | Drug Claim Name | Drug Name | PMIDs |
| 56924 | PAK6 | DRUGGABLE GENOME, KINASE, SERINE THREONINE KINASE, ENZYME | inhibitor | 310264718 | PF-03758309 | |
| 56924 | PAK6 | DRUGGABLE GENOME, KINASE, SERINE THREONINE KINASE, ENZYME | inhibitor | 178101884 | GSK-690693 | |
| 56924 | PAK6 | DRUGGABLE GENOME, KINASE, SERINE THREONINE KINASE, ENZYME | inhibitor | 310264722 |
| Page: 1 |

Copyright 2023-Present -The University of Texas Health Science Center at Houston |