
|
|||||
|
 | |
| |
| |
| |
| |
| |
|
Gene: PAK4 |
Gene summary for PAK4 |
| Gene information | Species | Human | Gene symbol | PAK4 | Gene ID | 10298 |
| Gene name | p21 (RAC1) activated kinase 4 | |
| Gene Alias | PAK4 | |
| Cytomap | 19q13.2 | |
| Gene Type | protein-coding | GO ID | GO:0000165 | UniProtAcc | A0A024R0J1 |
Top |
Malignant transformation analysis |
| Identification of the aberrant gene expression in precancerous and cancerous lesions by comparing the gene expression of stem-like cells in diseased tissues with normal stem cells |
| Entrez ID | Symbol | Replicates | Species | Organ | Tissue | Adj P-value | Log2FC | Malignancy |
| 10298 | PAK4 | HTA11_347_2000001011 | Human | Colorectum | AD | 6.72e-10 | 5.24e-01 | -0.1954 |
| 10298 | PAK4 | HTA11_696_2000001011 | Human | Colorectum | AD | 5.11e-14 | 5.37e-01 | -0.1464 |
| 10298 | PAK4 | HTA11_866_2000001011 | Human | Colorectum | AD | 3.65e-02 | 3.13e-01 | -0.1001 |
| 10298 | PAK4 | HTA11_1391_2000001011 | Human | Colorectum | AD | 2.29e-02 | 3.55e-01 | -0.059 |
| 10298 | PAK4 | HTA11_7696_3000711011 | Human | Colorectum | AD | 5.33e-03 | 3.72e-01 | 0.0674 |
| 10298 | PAK4 | A015-C-203 | Human | Colorectum | FAP | 5.35e-10 | -2.15e-01 | -0.1294 |
| 10298 | PAK4 | A015-C-204 | Human | Colorectum | FAP | 1.72e-02 | -1.47e-01 | -0.0228 |
| 10298 | PAK4 | A002-C-201 | Human | Colorectum | FAP | 1.45e-07 | -1.84e-01 | 0.0324 |
| 10298 | PAK4 | A001-C-119 | Human | Colorectum | FAP | 1.54e-04 | -2.84e-01 | -0.1557 |
| 10298 | PAK4 | A001-C-108 | Human | Colorectum | FAP | 3.10e-05 | -2.15e-01 | -0.0272 |
| 10298 | PAK4 | A002-C-205 | Human | Colorectum | FAP | 4.01e-10 | -2.69e-01 | -0.1236 |
| 10298 | PAK4 | A015-C-005 | Human | Colorectum | FAP | 4.54e-04 | -2.38e-01 | -0.0336 |
| 10298 | PAK4 | A015-C-006 | Human | Colorectum | FAP | 2.97e-07 | -2.92e-01 | -0.0994 |
| 10298 | PAK4 | A015-C-106 | Human | Colorectum | FAP | 2.51e-05 | -2.54e-01 | -0.0511 |
| 10298 | PAK4 | A002-C-114 | Human | Colorectum | FAP | 5.00e-07 | -2.02e-01 | -0.1561 |
| 10298 | PAK4 | A015-C-104 | Human | Colorectum | FAP | 2.03e-10 | -2.00e-01 | -0.1899 |
| 10298 | PAK4 | A001-C-014 | Human | Colorectum | FAP | 3.89e-05 | -1.64e-01 | 0.0135 |
| 10298 | PAK4 | A002-C-016 | Human | Colorectum | FAP | 5.28e-08 | -2.50e-01 | 0.0521 |
| 10298 | PAK4 | A015-C-002 | Human | Colorectum | FAP | 1.88e-04 | -2.63e-01 | -0.0763 |
| 10298 | PAK4 | A001-C-007 | Human | Colorectum | CRC | 2.86e-02 | -2.89e-01 | 0.1899 |
| Page: 1 2 3 4 5 6 7 |
| Tissue | Expression Dynamics | Abbreviation |
| Colorectum (GSE201348) | 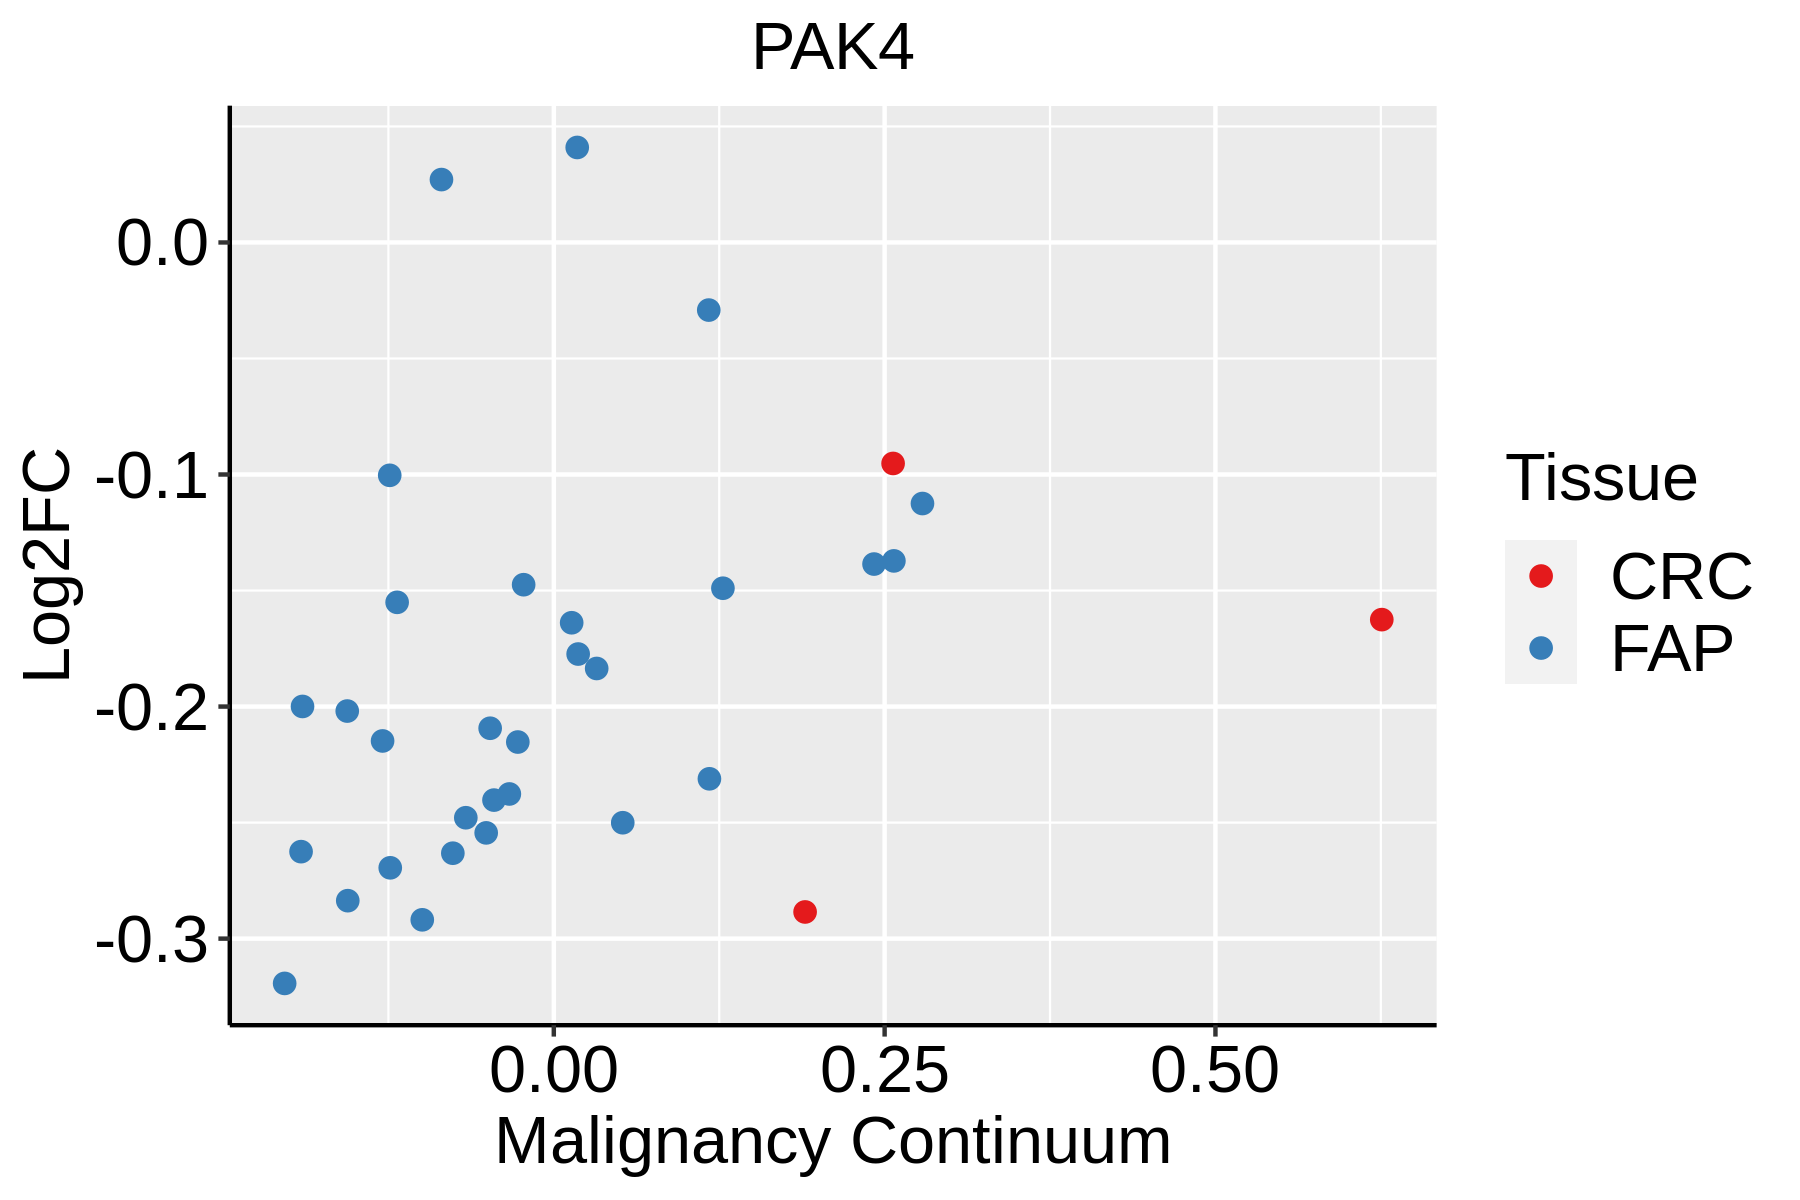 | FAP: Familial adenomatous polyposis |
| CRC: Colorectal cancer | ||
| Colorectum (HTA11) | 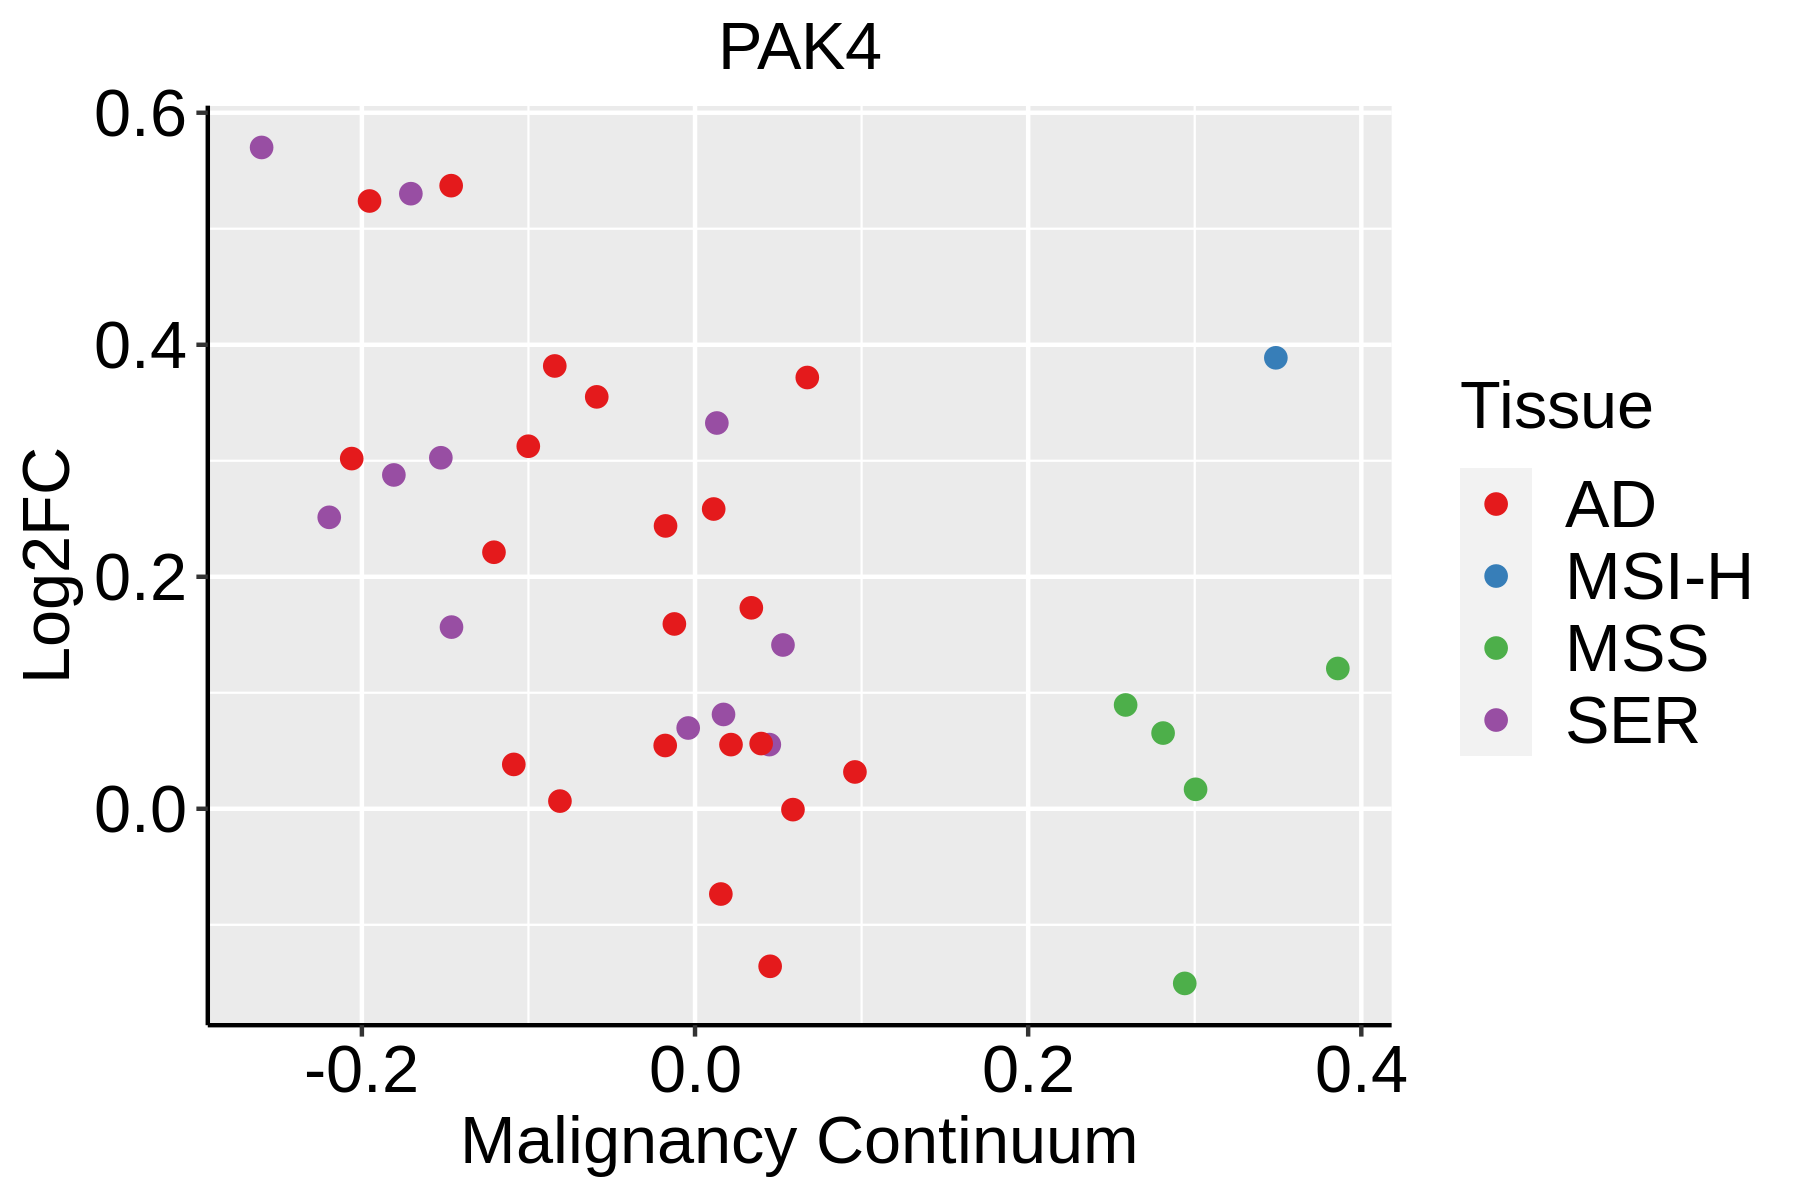 | AD: Adenomas |
| SER: Sessile serrated lesions | ||
| MSI-H: Microsatellite-high colorectal cancer | ||
| MSS: Microsatellite stable colorectal cancer | ||
| Esophagus | 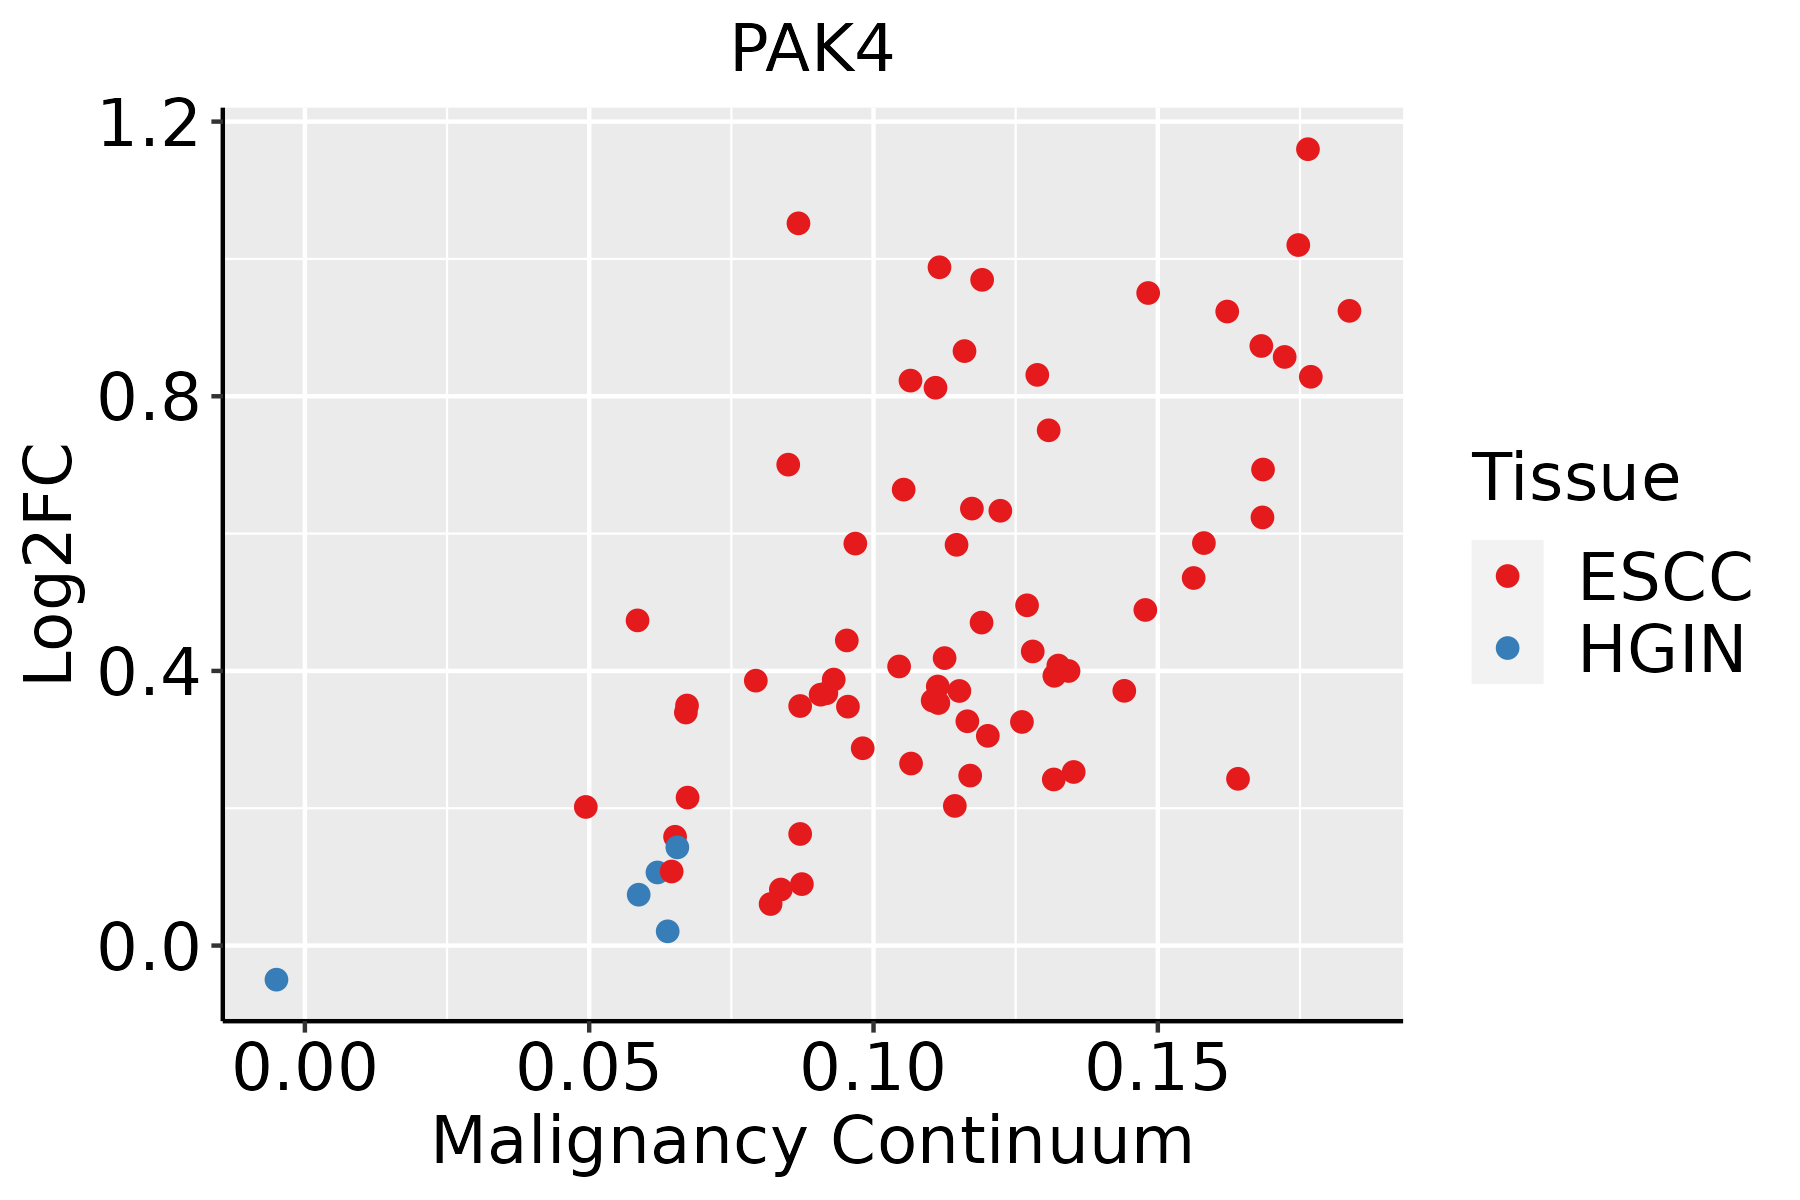 | ESCC: Esophageal squamous cell carcinoma |
| HGIN: High-grade intraepithelial neoplasias | ||
| LGIN: Low-grade intraepithelial neoplasias | ||
| Liver | 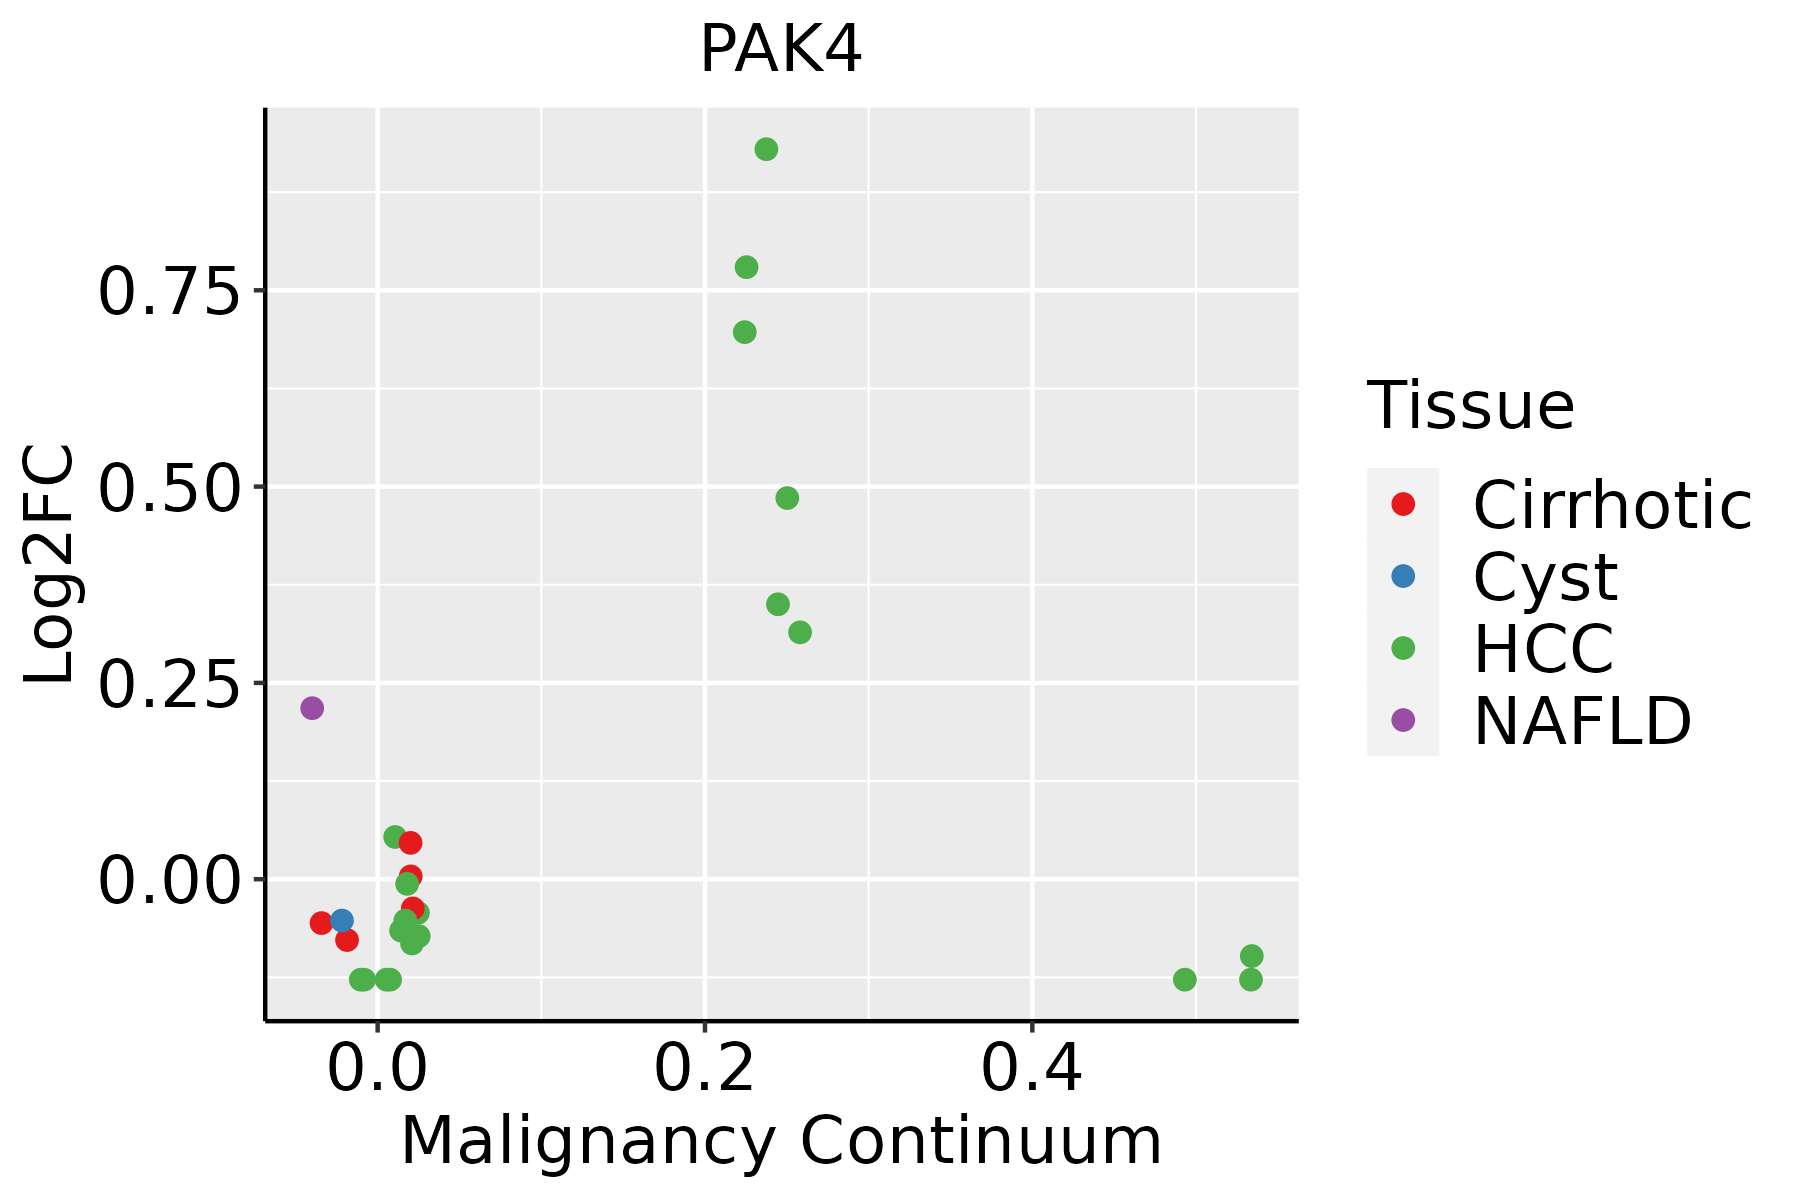 | HCC: Hepatocellular carcinoma |
| NAFLD: Non-alcoholic fatty liver disease | ||
| Oral Cavity | 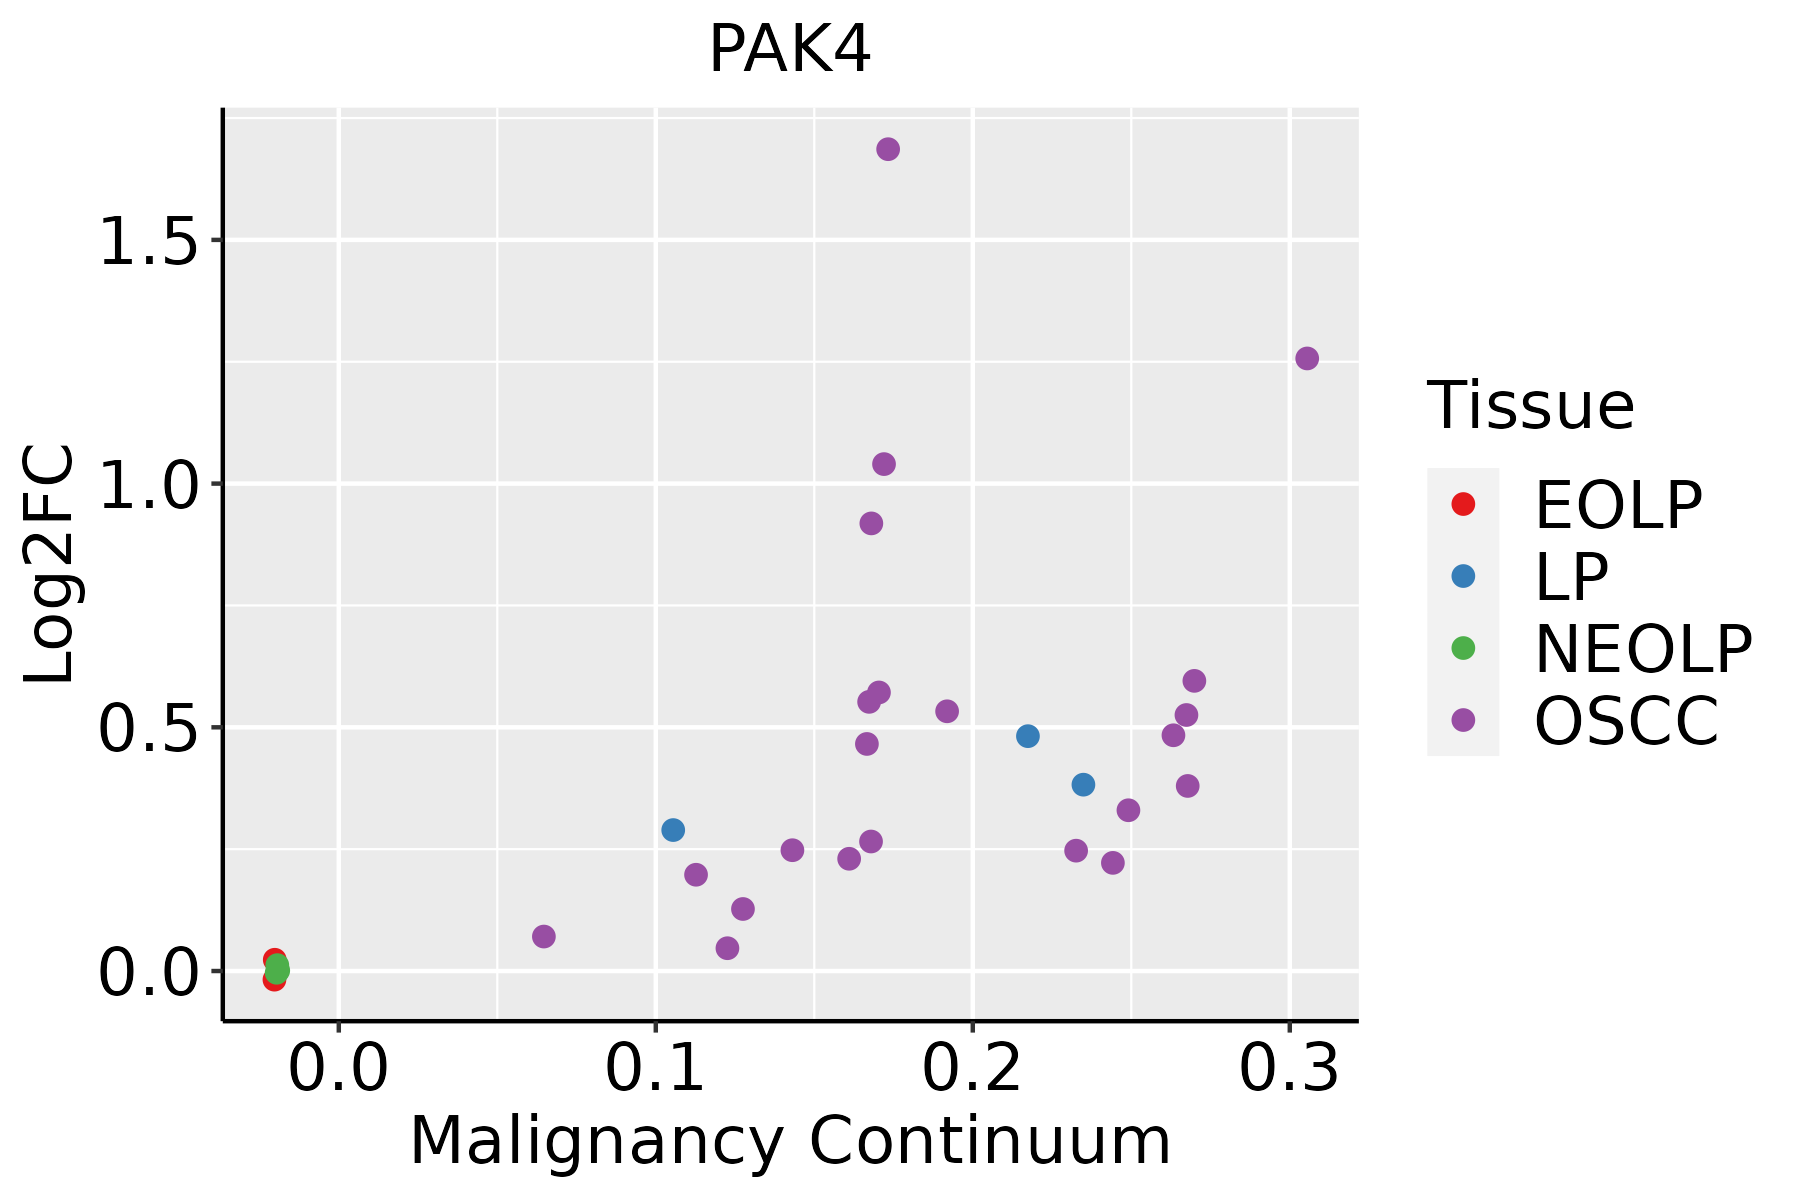 | EOLP: Erosive Oral lichen planus |
| LP: leukoplakia | ||
| NEOLP: Non-erosive oral lichen planus | ||
| OSCC: Oral squamous cell carcinoma | ||
| Thyroid | 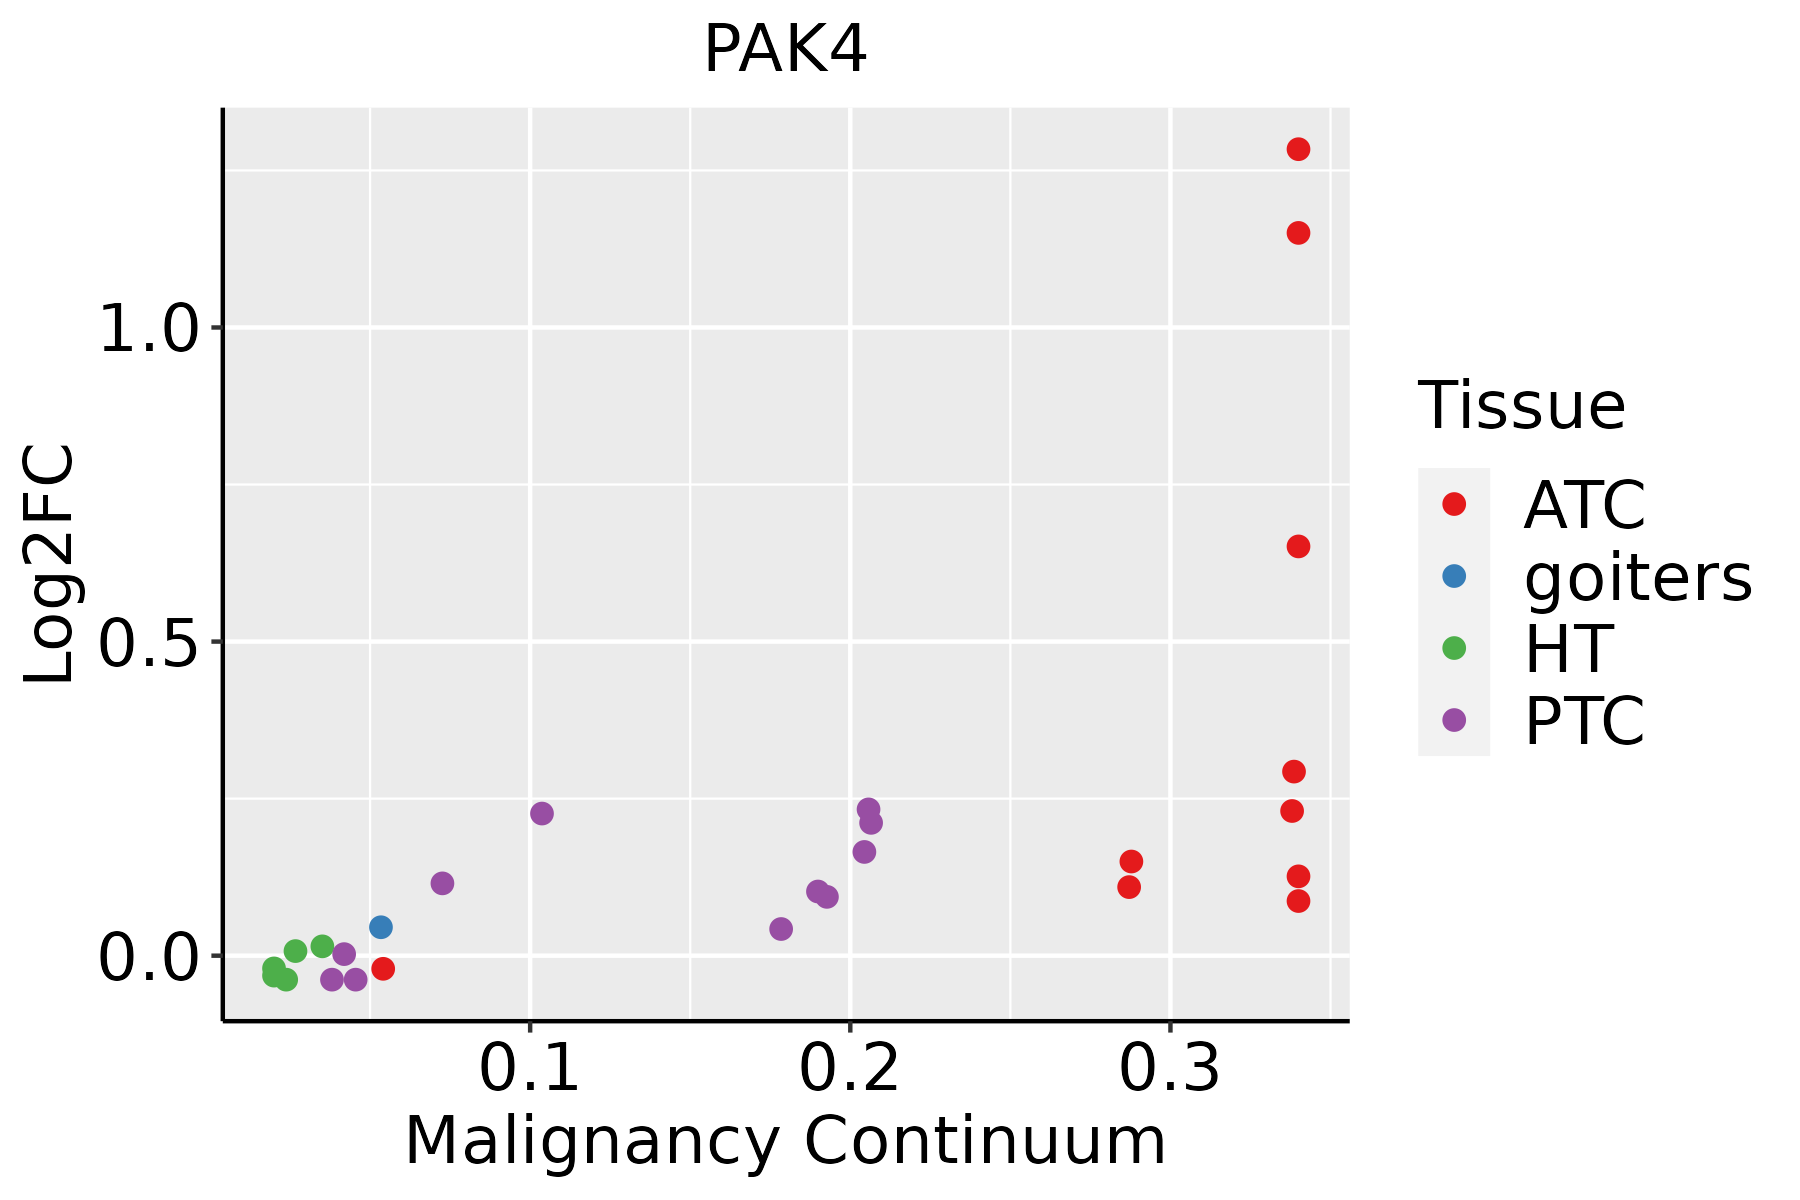 | ATC: Anaplastic thyroid cancer |
| HT: Hashimoto's thyroiditis | ||
| PTC: Papillary thyroid cancer |
| ∗log2FC in expression of this searched gene in stem-like cells from each diseased tissue sample relative to stem-like cells in normal samples in each tissue plotted against the malignancy continuum. Samples are colored based on if they are from different disease stage. |
Top |
Malignant transformation related pathway analysis |
| Find out the enriched GO biological processes and KEGG pathways involved in transition from healthy to precancer to cancer |
| Tissue | Disease Stage | Enriched GO biological Processes |
| Colorectum | AD |  |
| Colorectum | SER |  |
| Colorectum | MSS |  |
| Colorectum | MSI-H |  |
| Colorectum | FAP |  |
| ∗Top 15 enriched GO BP terms are showed in the bar plot of each disease state in each tissue. Each row represents a significant GO biological process which is colored according to the -log10(p.adjust). |
| Page: 1 2 3 4 5 6 7 8 9 |
| GO ID | Tissue | Disease Stage | Description | Gene Ratio | Bg Ratio | pvalue | p.adjust | Count |
| GO:0016049 | Colorectum | AD | cell growth | 143/3918 | 482/18723 | 2.83e-06 | 8.09e-05 | 143 |
| GO:0001558 | Colorectum | AD | regulation of cell growth | 124/3918 | 414/18723 | 7.67e-06 | 1.86e-04 | 124 |
| GO:00160493 | Colorectum | FAP | cell growth | 112/2622 | 482/18723 | 2.40e-08 | 2.30e-06 | 112 |
| GO:00015583 | Colorectum | FAP | regulation of cell growth | 95/2622 | 414/18723 | 5.02e-07 | 2.61e-05 | 95 |
| GO:00160494 | Colorectum | CRC | cell growth | 95/2078 | 482/18723 | 1.51e-08 | 2.75e-06 | 95 |
| GO:00015584 | Colorectum | CRC | regulation of cell growth | 78/2078 | 414/18723 | 1.84e-06 | 9.11e-05 | 78 |
| GO:0016049110 | Esophagus | ESCC | cell growth | 289/8552 | 482/18723 | 1.29e-10 | 3.77e-09 | 289 |
| GO:000155819 | Esophagus | ESCC | regulation of cell growth | 248/8552 | 414/18723 | 2.97e-09 | 6.45e-08 | 248 |
| GO:19040197 | Esophagus | ESCC | epithelial cell apoptotic process | 68/8552 | 121/18723 | 1.27e-02 | 4.21e-02 | 68 |
| GO:001604911 | Liver | Cirrhotic | cell growth | 160/4634 | 482/18723 | 1.50e-05 | 2.07e-04 | 160 |
| GO:000155811 | Liver | Cirrhotic | regulation of cell growth | 132/4634 | 414/18723 | 5.53e-04 | 4.36e-03 | 132 |
| GO:19040191 | Liver | Cirrhotic | epithelial cell apoptotic process | 44/4634 | 121/18723 | 2.86e-03 | 1.65e-02 | 44 |
| GO:1904035 | Liver | Cirrhotic | regulation of epithelial cell apoptotic process | 35/4634 | 96/18723 | 6.94e-03 | 3.38e-02 | 35 |
| GO:001604921 | Liver | HCC | cell growth | 269/7958 | 482/18723 | 1.84e-09 | 5.35e-08 | 269 |
| GO:000155821 | Liver | HCC | regulation of cell growth | 228/7958 | 414/18723 | 1.34e-07 | 2.55e-06 | 228 |
| GO:001604917 | Oral cavity | OSCC | cell growth | 268/7305 | 482/18723 | 6.55e-14 | 3.51e-12 | 268 |
| GO:000155816 | Oral cavity | OSCC | regulation of cell growth | 228/7305 | 414/18723 | 1.74e-11 | 6.09e-10 | 228 |
| GO:001604918 | Oral cavity | LP | cell growth | 155/4623 | 482/18723 | 1.08e-04 | 1.31e-03 | 155 |
| GO:000155817 | Oral cavity | LP | regulation of cell growth | 134/4623 | 414/18723 | 2.25e-04 | 2.41e-03 | 134 |
| GO:0016049112 | Thyroid | PTC | cell growth | 225/5968 | 482/18723 | 4.75e-12 | 2.07e-10 | 225 |
| Page: 1 2 |
| Pathway ID | Tissue | Disease Stage | Description | Gene Ratio | Bg Ratio | pvalue | p.adjust | qvalue | Count |
| hsa05170 | Colorectum | AD | Human immunodeficiency virus 1 infection | 72/2092 | 212/8465 | 1.40e-03 | 8.46e-03 | 5.39e-03 | 72 |
| hsa04810 | Colorectum | AD | Regulation of actin cytoskeleton | 75/2092 | 229/8465 | 3.36e-03 | 1.76e-02 | 1.12e-02 | 75 |
| hsa04360 | Colorectum | AD | Axon guidance | 61/2092 | 182/8465 | 4.36e-03 | 2.17e-02 | 1.38e-02 | 61 |
| hsa04510 | Colorectum | AD | Focal adhesion | 67/2092 | 203/8465 | 4.40e-03 | 2.17e-02 | 1.38e-02 | 67 |
| hsa04012 | Colorectum | AD | ErbB signaling pathway | 31/2092 | 85/8465 | 1.02e-02 | 3.91e-02 | 2.50e-02 | 31 |
| hsa051701 | Colorectum | AD | Human immunodeficiency virus 1 infection | 72/2092 | 212/8465 | 1.40e-03 | 8.46e-03 | 5.39e-03 | 72 |
| hsa048101 | Colorectum | AD | Regulation of actin cytoskeleton | 75/2092 | 229/8465 | 3.36e-03 | 1.76e-02 | 1.12e-02 | 75 |
| hsa043601 | Colorectum | AD | Axon guidance | 61/2092 | 182/8465 | 4.36e-03 | 2.17e-02 | 1.38e-02 | 61 |
| hsa045101 | Colorectum | AD | Focal adhesion | 67/2092 | 203/8465 | 4.40e-03 | 2.17e-02 | 1.38e-02 | 67 |
| hsa040121 | Colorectum | AD | ErbB signaling pathway | 31/2092 | 85/8465 | 1.02e-02 | 3.91e-02 | 2.50e-02 | 31 |
| hsa045102 | Colorectum | FAP | Focal adhesion | 61/1404 | 203/8465 | 1.03e-06 | 2.15e-05 | 1.31e-05 | 61 |
| hsa048106 | Colorectum | FAP | Regulation of actin cytoskeleton | 65/1404 | 229/8465 | 4.07e-06 | 5.91e-05 | 3.59e-05 | 65 |
| hsa052112 | Colorectum | FAP | Renal cell carcinoma | 23/1404 | 69/8465 | 4.86e-04 | 3.56e-03 | 2.16e-03 | 23 |
| hsa043604 | Colorectum | FAP | Axon guidance | 47/1404 | 182/8465 | 9.09e-04 | 5.20e-03 | 3.16e-03 | 47 |
| hsa040124 | Colorectum | FAP | ErbB signaling pathway | 26/1404 | 85/8465 | 9.52e-04 | 5.22e-03 | 3.17e-03 | 26 |
| hsa051706 | Colorectum | FAP | Human immunodeficiency virus 1 infection | 51/1404 | 212/8465 | 2.98e-03 | 1.29e-02 | 7.87e-03 | 51 |
| hsa045103 | Colorectum | FAP | Focal adhesion | 61/1404 | 203/8465 | 1.03e-06 | 2.15e-05 | 1.31e-05 | 61 |
| hsa048107 | Colorectum | FAP | Regulation of actin cytoskeleton | 65/1404 | 229/8465 | 4.07e-06 | 5.91e-05 | 3.59e-05 | 65 |
| hsa052113 | Colorectum | FAP | Renal cell carcinoma | 23/1404 | 69/8465 | 4.86e-04 | 3.56e-03 | 2.16e-03 | 23 |
| hsa043605 | Colorectum | FAP | Axon guidance | 47/1404 | 182/8465 | 9.09e-04 | 5.20e-03 | 3.16e-03 | 47 |
| Page: 1 2 3 4 5 |
Top |
Cell-cell communication analysis |
| Identification of potential cell-cell interactions between two cell types and their ligand-receptor pairs for different disease states |
| Ligand | Receptor | LRpair | Pathway | Tissue | Disease Stage |
| Page: 1 |
Top |
Single-cell gene regulatory network inference analysis |
| Find out the significant the regulons (TFs) and the target genes of each regulon across cell types for different disease states |
| TF | Cell Type | Tissue | Disease Stage | Target Gene | RSS | Regulon Activity |
| ∗The dot plots of a searched regulon are shown for all cell subpopulations in each disease state of each tissue based on the regulon specific score inferred using pySCENIC and by calculating the average expression. |
| Page: 1 |
Top |
Somatic mutation of malignant transformation related genes |
| Annotation of somatic variants for genes involved in malignant transformation |
| Hugo Symbol | Variant Class | Variant Classification | dbSNP RS | HGVSc | HGVSp | HGVSp Short | SWISSPROT | BIOTYPE | SIFT | PolyPhen | Tumor Sample Barcode | Tissue | Histology | Sex | Age | Stage | Therapy Types | Drugs | Outcome |
| PAK4 | SNV | Missense_Mutation | c.35C>T | p.Ser12Phe | p.S12F | O96013 | protein_coding | deleterious(0) | probably_damaging(0.995) | TCGA-E2-A1IH-01 | Breast | breast invasive carcinoma | Female | >=65 | I/II | Hormone Therapy | aromasin | SD | |
| PAK4 | SNV | Missense_Mutation | rs764392821 | c.761N>A | p.Arg254Gln | p.R254Q | O96013 | protein_coding | tolerated(0.44) | benign(0) | TCGA-EK-A2PM-01 | Cervix | cervical & endocervical cancer | Female | >=65 | I/II | Unknown | Unknown | SD |
| PAK4 | SNV | Missense_Mutation | c.737C>T | p.Ser246Phe | p.S246F | O96013 | protein_coding | deleterious(0.03) | benign(0.011) | TCGA-Q1-A73O-01 | Cervix | cervical & endocervical cancer | Female | <65 | I/II | Chemotherapy | cisplatin | CR | |
| PAK4 | SNV | Missense_Mutation | novel | c.1433N>T | p.Thr478Met | p.T478M | O96013 | protein_coding | deleterious(0) | probably_damaging(1) | TCGA-AA-3950-01 | Colorectum | colon adenocarcinoma | Female | >=65 | I/II | Unknown | Unknown | SD |
| PAK4 | SNV | Missense_Mutation | rs377696830 | c.1286C>T | p.Ser429Leu | p.S429L | O96013 | protein_coding | deleterious(0) | possibly_damaging(0.776) | TCGA-AA-A010-01 | Colorectum | colon adenocarcinoma | Female | <65 | I/II | Chemotherapy | folinic | CR |
| PAK4 | SNV | Missense_Mutation | rs774651046 | c.1499C>T | p.Ser500Leu | p.S500L | O96013 | protein_coding | deleterious(0) | probably_damaging(0.999) | TCGA-AA-A010-01 | Colorectum | colon adenocarcinoma | Female | <65 | I/II | Chemotherapy | folinic | CR |
| PAK4 | SNV | Missense_Mutation | c.13A>G | p.Arg5Gly | p.R5G | O96013 | protein_coding | deleterious(0) | benign(0.003) | TCGA-AY-5543-01 | Colorectum | colon adenocarcinoma | Female | >=65 | I/II | Chemotherapy | oxaliplatin | SD | |
| PAK4 | SNV | Missense_Mutation | c.429N>T | p.Glu143Asp | p.E143D | O96013 | protein_coding | tolerated(0.36) | benign(0) | TCGA-CK-4951-01 | Colorectum | colon adenocarcinoma | Female | >=65 | I/II | Unknown | Unknown | PD | |
| PAK4 | SNV | Missense_Mutation | c.1387N>A | p.Ala463Thr | p.A463T | O96013 | protein_coding | deleterious(0) | probably_damaging(0.992) | TCGA-CM-4751-01 | Colorectum | colon adenocarcinoma | Male | <65 | III/IV | Chemotherapy | oxaliplatin | SD | |
| PAK4 | SNV | Missense_Mutation | rs747655225 | c.1757N>A | p.Arg586His | p.R586H | O96013 | protein_coding | deleterious(0) | benign(0.054) | TCGA-CM-6162-01 | Colorectum | colon adenocarcinoma | Female | <65 | III/IV | Chemotherapy | oxaliplatin | SD |
| Page: 1 2 3 4 5 |
Top |
Related drugs of malignant transformation related genes |
| Identification of chemicals and drugs interact with genes involved in malignant transfromation |
| (DGIdb 4.0) |
| Entrez ID | Symbol | Category | Interaction Types | Drug Claim Name | Drug Name | PMIDs |
| 10298 | PAK4 | KINASE, SERINE THREONINE KINASE, DRUGGABLE GENOME, ENZYME | 681640 | CHEMBL379975 | ||
| 10298 | PAK4 | KINASE, SERINE THREONINE KINASE, DRUGGABLE GENOME, ENZYME | PD-0166285 | PD-0166285 | ||
| 10298 | PAK4 | KINASE, SERINE THREONINE KINASE, DRUGGABLE GENOME, ENZYME | TAE-684 | TAE-684 | ||
| 10298 | PAK4 | KINASE, SERINE THREONINE KINASE, DRUGGABLE GENOME, ENZYME | inhibitor | 310264720 | ||
| 10298 | PAK4 | KINASE, SERINE THREONINE KINASE, DRUGGABLE GENOME, ENZYME | CYC-116 | CYC-116 | ||
| 10298 | PAK4 | KINASE, SERINE THREONINE KINASE, DRUGGABLE GENOME, ENZYME | inhibitor | 310264718 | PF-03758309 | |
| 10298 | PAK4 | KINASE, SERINE THREONINE KINASE, DRUGGABLE GENOME, ENZYME | PF-562271 | PF-00562271 | ||
| 10298 | PAK4 | KINASE, SERINE THREONINE KINASE, DRUGGABLE GENOME, ENZYME | AZD-1775 | ADAVOSERTIB | ||
| 10298 | PAK4 | KINASE, SERINE THREONINE KINASE, DRUGGABLE GENOME, ENZYME | ALSTERPAULLONE | ALSTERPAULLONE | ||
| 10298 | PAK4 | KINASE, SERINE THREONINE KINASE, DRUGGABLE GENOME, ENZYME | inhibitor | 310264722 |
| Page: 1 2 3 |

Copyright 2023-Present -The University of Texas Health Science Center at Houston |