
|
|||||
|
 | |
| |
| |
| |
| |
| |
|
Gene: PAK3 |
Gene summary for PAK3 |
| Gene information | Species | Human | Gene symbol | PAK3 | Gene ID | 5063 |
| Gene name | p21 (RAC1) activated kinase 3 | |
| Gene Alias | ARA | |
| Cytomap | Xq23 | |
| Gene Type | protein-coding | GO ID | GO:0000165 | UniProtAcc | B2RCU6 |
Top |
Malignant transformation analysis |
| Identification of the aberrant gene expression in precancerous and cancerous lesions by comparing the gene expression of stem-like cells in diseased tissues with normal stem cells |
| Entrez ID | Symbol | Replicates | Species | Organ | Tissue | Adj P-value | Log2FC | Malignancy |
| 5063 | PAK3 | HCC1 | Human | Liver | HCC | 1.01e-10 | 1.70e+00 | 0.5336 |
| 5063 | PAK3 | HCC2 | Human | Liver | HCC | 2.35e-25 | 2.06e+00 | 0.5341 |
| 5063 | PAK3 | HCC5 | Human | Liver | HCC | 6.24e-09 | 1.61e+00 | 0.4932 |
| 5063 | PAK3 | S029 | Human | Liver | HCC | 2.88e-02 | 3.13e-01 | 0.2581 |
| 5063 | PAK3 | HTA12-15-2 | Human | Pancreas | PDAC | 2.77e-03 | 8.53e-01 | 0.2315 |
| 5063 | PAK3 | HTA12-23-1 | Human | Pancreas | PDAC | 3.69e-13 | 1.38e+00 | 0.3405 |
| 5063 | PAK3 | HTA12-25-1 | Human | Pancreas | PDAC | 2.32e-08 | 1.05e+00 | 0.313 |
| 5063 | PAK3 | HTA12-26-1 | Human | Pancreas | PDAC | 1.92e-26 | 1.28e+00 | 0.3728 |
| 5063 | PAK3 | HTA12-29-1 | Human | Pancreas | PDAC | 2.72e-58 | 1.27e+00 | 0.3722 |
| 5063 | PAK3 | male-WTA | Human | Thyroid | PTC | 6.98e-04 | 1.42e-02 | 0.1037 |
| 5063 | PAK3 | PTC04 | Human | Thyroid | PTC | 2.37e-04 | 1.21e-01 | 0.1927 |
| 5063 | PAK3 | PTC06 | Human | Thyroid | PTC | 2.56e-05 | 1.00e-01 | 0.2057 |
| 5063 | PAK3 | PTC07 | Human | Thyroid | PTC | 9.77e-04 | -9.68e-03 | 0.2044 |
| 5063 | PAK3 | ATC3 | Human | Thyroid | ATC | 1.13e-04 | 2.21e-01 | 0.338 |
| Page: 1 |
| Tissue | Expression Dynamics | Abbreviation |
| Liver |  | HCC: Hepatocellular carcinoma |
| NAFLD: Non-alcoholic fatty liver disease | ||
| Thyroid | 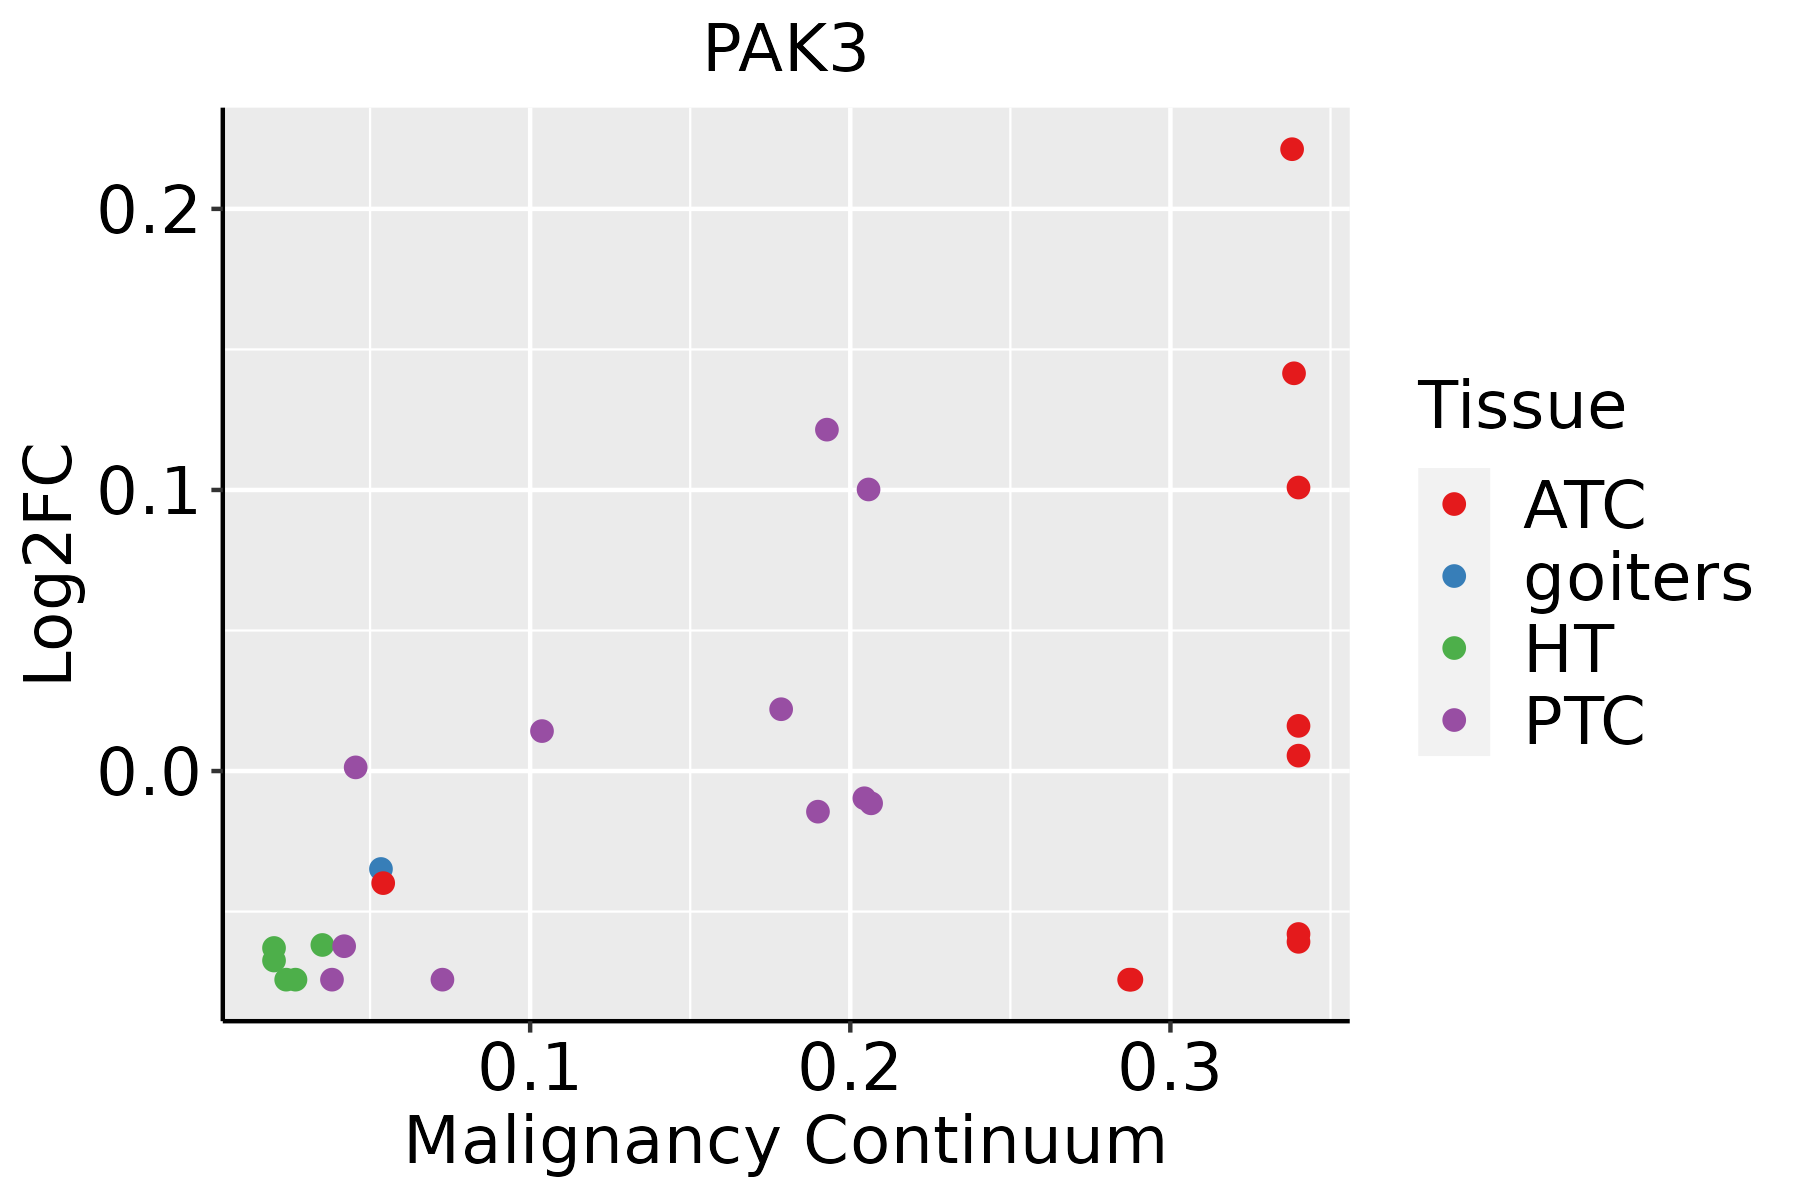 | ATC: Anaplastic thyroid cancer |
| HT: Hashimoto's thyroiditis | ||
| PTC: Papillary thyroid cancer |
| ∗log2FC in expression of this searched gene in stem-like cells from each diseased tissue sample relative to stem-like cells in normal samples in each tissue plotted against the malignancy continuum. Samples are colored based on if they are from different disease stage. |
Top |
Malignant transformation related pathway analysis |
| Find out the enriched GO biological processes and KEGG pathways involved in transition from healthy to precancer to cancer |
| Tissue | Disease Stage | Enriched GO biological Processes |
| Colorectum | AD |  |
| Colorectum | SER |  |
| Colorectum | MSS |  |
| Colorectum | MSI-H |  |
| Colorectum | FAP |  |
| ∗Top 15 enriched GO BP terms are showed in the bar plot of each disease state in each tissue. Each row represents a significant GO biological process which is colored according to the -log10(p.adjust). |
| Page: 1 2 3 4 5 6 7 8 9 |
| GO ID | Tissue | Disease Stage | Description | Gene Ratio | Bg Ratio | pvalue | p.adjust | Count |
| GO:004325422 | Liver | HCC | regulation of protein-containing complex assembly | 264/7958 | 428/18723 | 5.47e-16 | 4.39e-14 | 264 |
| GO:005125822 | Liver | HCC | protein polymerization | 182/7958 | 297/18723 | 4.17e-11 | 1.58e-09 | 182 |
| GO:002260422 | Liver | HCC | regulation of cell morphogenesis | 188/7958 | 309/18723 | 4.84e-11 | 1.82e-09 | 188 |
| GO:190290322 | Liver | HCC | regulation of supramolecular fiber organization | 224/7958 | 383/18723 | 1.54e-10 | 5.33e-09 | 224 |
| GO:000701522 | Liver | HCC | actin filament organization | 252/7958 | 442/18723 | 3.83e-10 | 1.25e-08 | 252 |
| GO:003253522 | Liver | HCC | regulation of cellular component size | 217/7958 | 383/18723 | 1.28e-08 | 3.14e-07 | 217 |
| GO:003227122 | Liver | HCC | regulation of protein polymerization | 141/7958 | 233/18723 | 2.00e-08 | 4.72e-07 | 141 |
| GO:003297022 | Liver | HCC | regulation of actin filament-based process | 222/7958 | 397/18723 | 3.81e-08 | 8.30e-07 | 222 |
| GO:003295622 | Liver | HCC | regulation of actin cytoskeleton organization | 202/7958 | 358/18723 | 6.18e-08 | 1.29e-06 | 202 |
| GO:007099722 | Liver | HCC | neuron death | 202/7958 | 361/18723 | 1.44e-07 | 2.70e-06 | 202 |
| GO:000815422 | Liver | HCC | actin polymerization or depolymerization | 130/7958 | 218/18723 | 2.31e-07 | 4.14e-06 | 130 |
| GO:003004122 | Liver | HCC | actin filament polymerization | 116/7958 | 191/18723 | 2.66e-07 | 4.68e-06 | 116 |
| GO:001076922 | Liver | HCC | regulation of cell morphogenesis involved in differentiation | 65/7958 | 96/18723 | 5.17e-07 | 8.37e-06 | 65 |
| GO:190121412 | Liver | HCC | regulation of neuron death | 179/7958 | 319/18723 | 5.65e-07 | 9.01e-06 | 179 |
| GO:005105221 | Liver | HCC | regulation of DNA metabolic process | 198/7958 | 359/18723 | 7.62e-07 | 1.17e-05 | 198 |
| GO:011005322 | Liver | HCC | regulation of actin filament organization | 158/7958 | 278/18723 | 9.01e-07 | 1.37e-05 | 158 |
| GO:003083212 | Liver | HCC | regulation of actin filament length | 113/7958 | 189/18723 | 1.16e-06 | 1.71e-05 | 113 |
| GO:003083322 | Liver | HCC | regulation of actin filament polymerization | 104/7958 | 172/18723 | 1.46e-06 | 2.08e-05 | 104 |
| GO:000806412 | Liver | HCC | regulation of actin polymerization or depolymerization | 112/7958 | 188/18723 | 1.65e-06 | 2.31e-05 | 112 |
| GO:003134611 | Liver | HCC | positive regulation of cell projection organization | 193/7958 | 353/18723 | 2.28e-06 | 3.08e-05 | 193 |
| Page: 1 2 3 4 5 6 7 8 9 |
| Pathway ID | Tissue | Disease Stage | Description | Gene Ratio | Bg Ratio | pvalue | p.adjust | qvalue | Count |
| hsa0513242 | Liver | HCC | Salmonella infection | 178/4020 | 249/8465 | 5.90e-15 | 1.98e-13 | 1.10e-13 | 178 |
| hsa0513042 | Liver | HCC | Pathogenic Escherichia coli infection | 129/4020 | 197/8465 | 2.02e-07 | 2.50e-06 | 1.39e-06 | 129 |
| hsa0521121 | Liver | HCC | Renal cell carcinoma | 51/4020 | 69/8465 | 6.76e-06 | 5.53e-05 | 3.07e-05 | 51 |
| hsa0451041 | Liver | HCC | Focal adhesion | 125/4020 | 203/8465 | 3.12e-05 | 1.88e-04 | 1.04e-04 | 125 |
| hsa051709 | Liver | HCC | Human immunodeficiency virus 1 infection | 125/4020 | 212/8465 | 4.51e-04 | 1.94e-03 | 1.08e-03 | 125 |
| hsa040128 | Liver | HCC | ErbB signaling pathway | 54/4020 | 85/8465 | 2.02e-03 | 7.07e-03 | 3.93e-03 | 54 |
| hsa0513252 | Liver | HCC | Salmonella infection | 178/4020 | 249/8465 | 5.90e-15 | 1.98e-13 | 1.10e-13 | 178 |
| hsa0513052 | Liver | HCC | Pathogenic Escherichia coli infection | 129/4020 | 197/8465 | 2.02e-07 | 2.50e-06 | 1.39e-06 | 129 |
| hsa0521131 | Liver | HCC | Renal cell carcinoma | 51/4020 | 69/8465 | 6.76e-06 | 5.53e-05 | 3.07e-05 | 51 |
| hsa0451051 | Liver | HCC | Focal adhesion | 125/4020 | 203/8465 | 3.12e-05 | 1.88e-04 | 1.04e-04 | 125 |
| hsa0517012 | Liver | HCC | Human immunodeficiency virus 1 infection | 125/4020 | 212/8465 | 4.51e-04 | 1.94e-03 | 1.08e-03 | 125 |
| hsa0401211 | Liver | HCC | ErbB signaling pathway | 54/4020 | 85/8465 | 2.02e-03 | 7.07e-03 | 3.93e-03 | 54 |
| Page: 1 |
Top |
Cell-cell communication analysis |
| Identification of potential cell-cell interactions between two cell types and their ligand-receptor pairs for different disease states |
| Ligand | Receptor | LRpair | Pathway | Tissue | Disease Stage |
| Page: 1 |
Top |
Single-cell gene regulatory network inference analysis |
| Find out the significant the regulons (TFs) and the target genes of each regulon across cell types for different disease states |
| TF | Cell Type | Tissue | Disease Stage | Target Gene | RSS | Regulon Activity |
| ∗The dot plots of a searched regulon are shown for all cell subpopulations in each disease state of each tissue based on the regulon specific score inferred using pySCENIC and by calculating the average expression. |
| Page: 1 |
Top |
Somatic mutation of malignant transformation related genes |
| Annotation of somatic variants for genes involved in malignant transformation |
| Hugo Symbol | Variant Class | Variant Classification | dbSNP RS | HGVSc | HGVSp | HGVSp Short | SWISSPROT | BIOTYPE | SIFT | PolyPhen | Tumor Sample Barcode | Tissue | Histology | Sex | Age | Stage | Therapy Types | Drugs | Outcome |
| PAK3 | SNV | Missense_Mutation | c.1569N>C | p.Arg523Ser | p.R523S | O75914 | protein_coding | tolerated(0.14) | benign(0.006) | TCGA-A2-A04P-01 | Breast | breast invasive carcinoma | Female | <65 | III/IV | Chemotherapy | taxol | PD | |
| PAK3 | SNV | Missense_Mutation | c.743N>T | p.Ser248Leu | p.S248L | O75914 | protein_coding | tolerated(0.38) | benign(0) | TCGA-AC-A23H-01 | Breast | breast invasive carcinoma | Female | >=65 | I/II | Unknown | Unknown | PD | |
| PAK3 | SNV | Missense_Mutation | novel | c.328N>A | p.Glu110Lys | p.E110K | O75914 | protein_coding | tolerated_low_confidence(0.56) | possibly_damaging(0.828) | TCGA-C8-A3M7-01 | Breast | breast invasive carcinoma | Female | <65 | III/IV | Unknown | Unknown | PD |
| PAK3 | SNV | Missense_Mutation | c.145N>T | p.Arg49Cys | p.R49C | O75914 | protein_coding | tolerated(0.18) | possibly_damaging(0.827) | TCGA-E2-A1B0-01 | Breast | breast invasive carcinoma | Female | <65 | III/IV | Chemotherapy | cytoxan | SD | |
| PAK3 | SNV | Missense_Mutation | novel | c.1400N>A | p.Pro467His | p.P467H | O75914 | protein_coding | deleterious(0) | probably_damaging(1) | TCGA-2W-A8YY-01 | Cervix | cervical & endocervical cancer | Female | <65 | I/II | Chemotherapy | cisplatin | CR |
| PAK3 | SNV | Missense_Mutation | c.649N>C | p.Glu217Gln | p.E217Q | O75914 | protein_coding | tolerated(0.49) | benign(0.358) | TCGA-BI-A0VS-01 | Cervix | cervical & endocervical cancer | Female | <65 | I/II | Unknown | Unknown | SD | |
| PAK3 | SNV | Missense_Mutation | c.823C>T | p.Arg275Trp | p.R275W | O75914 | protein_coding | deleterious(0) | probably_damaging(0.944) | TCGA-C5-A902-01 | Cervix | cervical & endocervical cancer | Female | <65 | I/II | Chemotherapy | cisplatin | SD | |
| PAK3 | SNV | Missense_Mutation | novel | c.1348N>T | p.Pro450Ser | p.P450S | O75914 | protein_coding | tolerated(0.06) | benign(0.221) | TCGA-VS-A9UZ-01 | Cervix | cervical & endocervical cancer | Female | <65 | I/II | Unknown | Unknown | SD |
| PAK3 | SNV | Missense_Mutation | rs764106735 | c.654N>T | p.Glu218Asp | p.E218D | O75914 | protein_coding | tolerated(0.56) | benign(0) | TCGA-5M-AAT4-01 | Colorectum | colon adenocarcinoma | Male | >=65 | III/IV | Unknown | Unknown | PD |
| PAK3 | SNV | Missense_Mutation | c.834N>C | p.Lys278Asn | p.K278N | O75914 | protein_coding | deleterious(0.03) | benign(0.099) | TCGA-AA-3510-01 | Colorectum | colon adenocarcinoma | Male | >=65 | I/II | Unknown | Unknown | SD |
| Page: 1 2 3 4 5 6 7 8 9 10 |
Top |
Related drugs of malignant transformation related genes |
| Identification of chemicals and drugs interact with genes involved in malignant transfromation |
| (DGIdb 4.0) |
| Entrez ID | Symbol | Category | Interaction Types | Drug Claim Name | Drug Name | PMIDs |
| 5063 | PAK3 | ENZYME, KINASE, SERINE THREONINE KINASE, DRUGGABLE GENOME, CLINICALLY ACTIONABLE | inhibitor | 310264720 | ||
| 5063 | PAK3 | ENZYME, KINASE, SERINE THREONINE KINASE, DRUGGABLE GENOME, CLINICALLY ACTIONABLE | inhibitor | 310264719 | ||
| 5063 | PAK3 | ENZYME, KINASE, SERINE THREONINE KINASE, DRUGGABLE GENOME, CLINICALLY ACTIONABLE | inhibitor | HESPERADIN | HESPERADIN | 19035792 |
| 5063 | PAK3 | ENZYME, KINASE, SERINE THREONINE KINASE, DRUGGABLE GENOME, CLINICALLY ACTIONABLE | inhibitor | 310264722 | ||
| 5063 | PAK3 | ENZYME, KINASE, SERINE THREONINE KINASE, DRUGGABLE GENOME, CLINICALLY ACTIONABLE | inhibitor | 310264718 | PF-03758309 |
| Page: 1 |

Copyright 2023-Present -The University of Texas Health Science Center at Houston |