
|
|||||
|
 | |
| |
| |
| |
| |
| |
|
Gene: PAK1IP1 |
Gene summary for PAK1IP1 |
| Gene information | Species | Human | Gene symbol | PAK1IP1 | Gene ID | 55003 |
| Gene name | PAK1 interacting protein 1 | |
| Gene Alias | MAK11 | |
| Cytomap | 6p24.2 | |
| Gene Type | protein-coding | GO ID | GO:0007154 | UniProtAcc | A0A0S2Z5C3 |
Top |
Malignant transformation analysis |
| Identification of the aberrant gene expression in precancerous and cancerous lesions by comparing the gene expression of stem-like cells in diseased tissues with normal stem cells |
| Entrez ID | Symbol | Replicates | Species | Organ | Tissue | Adj P-value | Log2FC | Malignancy |
| 55003 | PAK1IP1 | LZE4T | Human | Esophagus | ESCC | 1.06e-14 | 2.92e-01 | 0.0811 |
| 55003 | PAK1IP1 | LZE7T | Human | Esophagus | ESCC | 3.84e-05 | 3.37e-01 | 0.0667 |
| 55003 | PAK1IP1 | LZE8T | Human | Esophagus | ESCC | 8.28e-04 | 7.16e-02 | 0.067 |
| 55003 | PAK1IP1 | LZE20T | Human | Esophagus | ESCC | 2.63e-06 | 6.82e-02 | 0.0662 |
| 55003 | PAK1IP1 | LZE24T | Human | Esophagus | ESCC | 4.05e-12 | 3.61e-01 | 0.0596 |
| 55003 | PAK1IP1 | P1T-E | Human | Esophagus | ESCC | 3.60e-07 | 3.70e-01 | 0.0875 |
| 55003 | PAK1IP1 | P2T-E | Human | Esophagus | ESCC | 1.45e-25 | 5.55e-01 | 0.1177 |
| 55003 | PAK1IP1 | P4T-E | Human | Esophagus | ESCC | 1.18e-19 | 7.91e-01 | 0.1323 |
| 55003 | PAK1IP1 | P5T-E | Human | Esophagus | ESCC | 1.77e-13 | 3.24e-01 | 0.1327 |
| 55003 | PAK1IP1 | P8T-E | Human | Esophagus | ESCC | 1.04e-21 | 2.48e-01 | 0.0889 |
| 55003 | PAK1IP1 | P9T-E | Human | Esophagus | ESCC | 1.07e-11 | 4.28e-01 | 0.1131 |
| 55003 | PAK1IP1 | P10T-E | Human | Esophagus | ESCC | 2.55e-30 | 6.28e-01 | 0.116 |
| 55003 | PAK1IP1 | P11T-E | Human | Esophagus | ESCC | 1.99e-15 | 8.94e-01 | 0.1426 |
| 55003 | PAK1IP1 | P12T-E | Human | Esophagus | ESCC | 8.66e-19 | 4.87e-01 | 0.1122 |
| 55003 | PAK1IP1 | P15T-E | Human | Esophagus | ESCC | 2.89e-17 | 2.61e-01 | 0.1149 |
| 55003 | PAK1IP1 | P16T-E | Human | Esophagus | ESCC | 2.51e-27 | 5.22e-01 | 0.1153 |
| 55003 | PAK1IP1 | P17T-E | Human | Esophagus | ESCC | 1.09e-04 | 5.86e-01 | 0.1278 |
| 55003 | PAK1IP1 | P19T-E | Human | Esophagus | ESCC | 1.05e-07 | 5.58e-01 | 0.1662 |
| 55003 | PAK1IP1 | P20T-E | Human | Esophagus | ESCC | 3.05e-22 | 4.17e-01 | 0.1124 |
| 55003 | PAK1IP1 | P21T-E | Human | Esophagus | ESCC | 2.38e-34 | 8.28e-01 | 0.1617 |
| Page: 1 2 3 4 5 6 |
| Tissue | Expression Dynamics | Abbreviation |
| Esophagus |  | ESCC: Esophageal squamous cell carcinoma |
| HGIN: High-grade intraepithelial neoplasias | ||
| LGIN: Low-grade intraepithelial neoplasias | ||
| Liver | 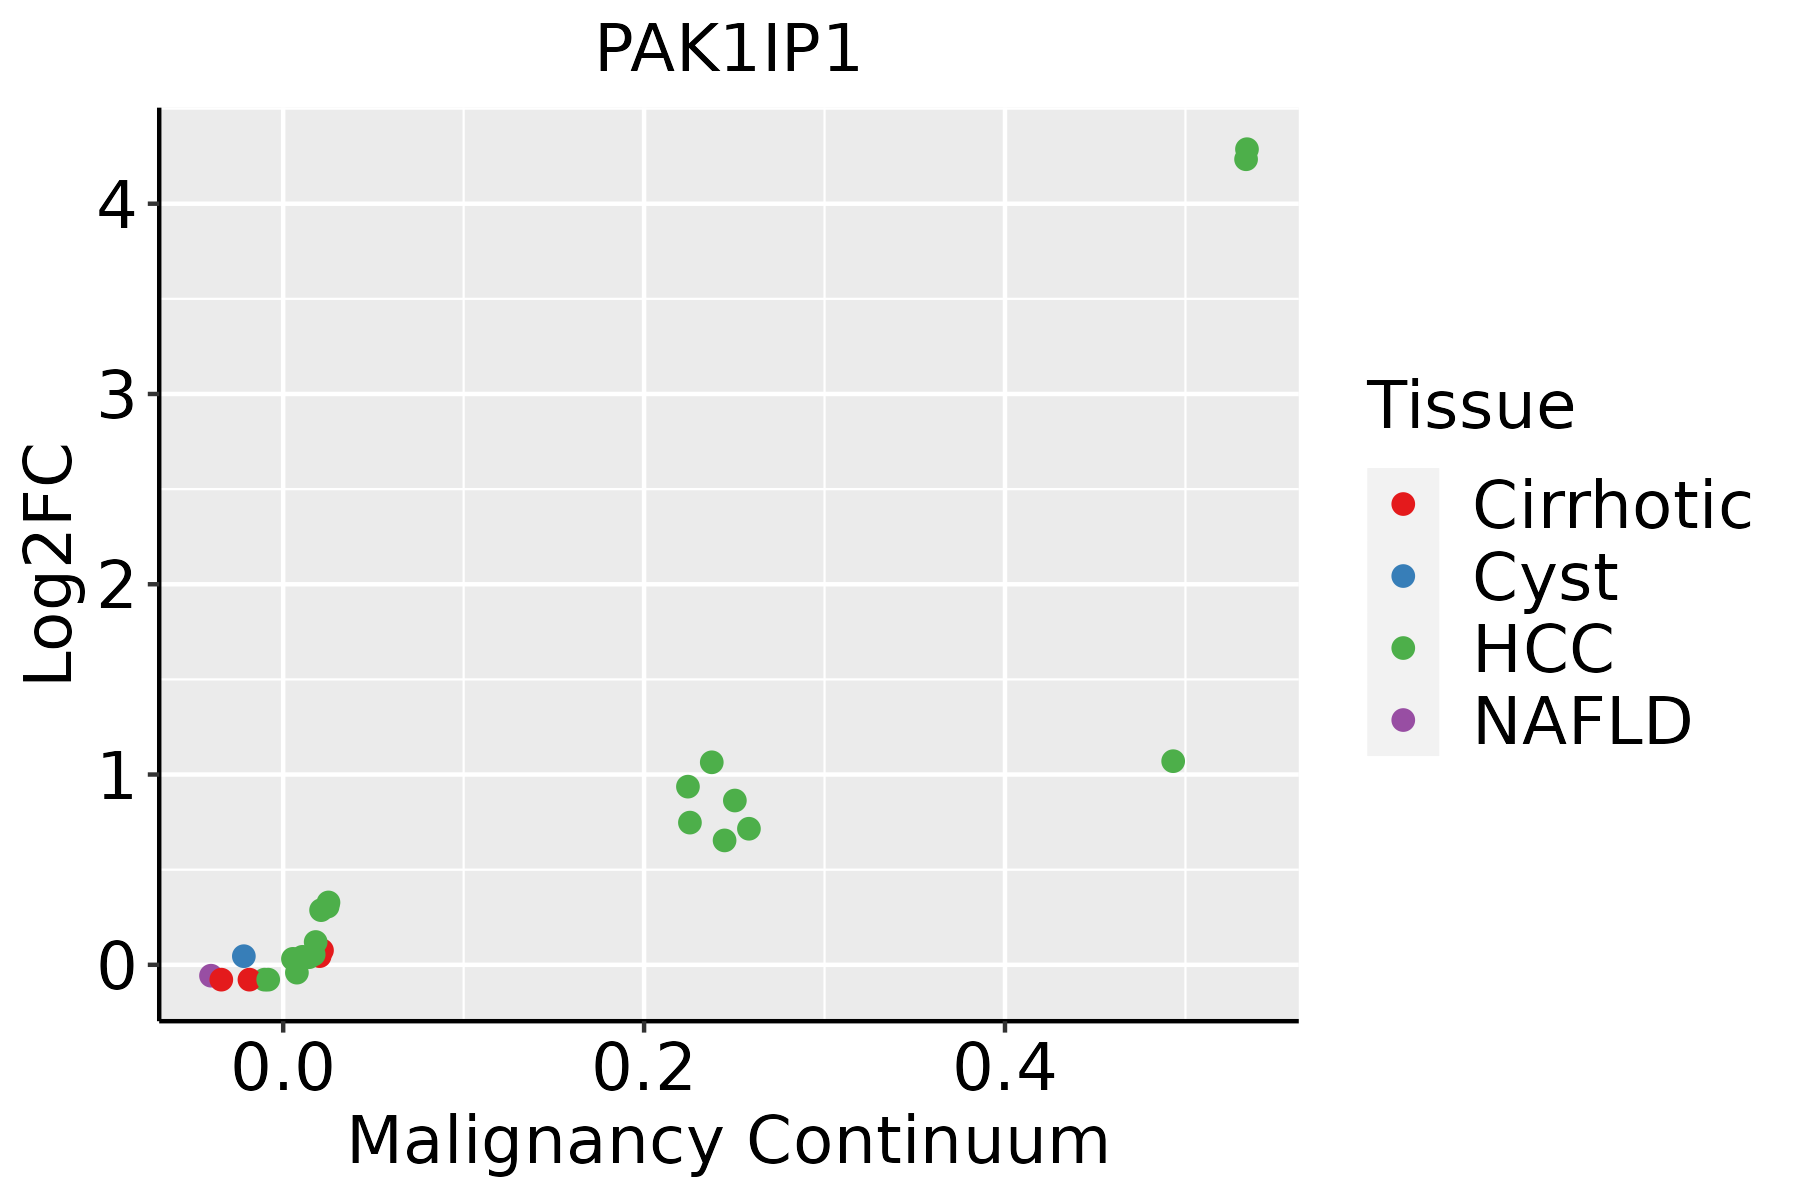 | HCC: Hepatocellular carcinoma |
| NAFLD: Non-alcoholic fatty liver disease | ||
| Oral Cavity | 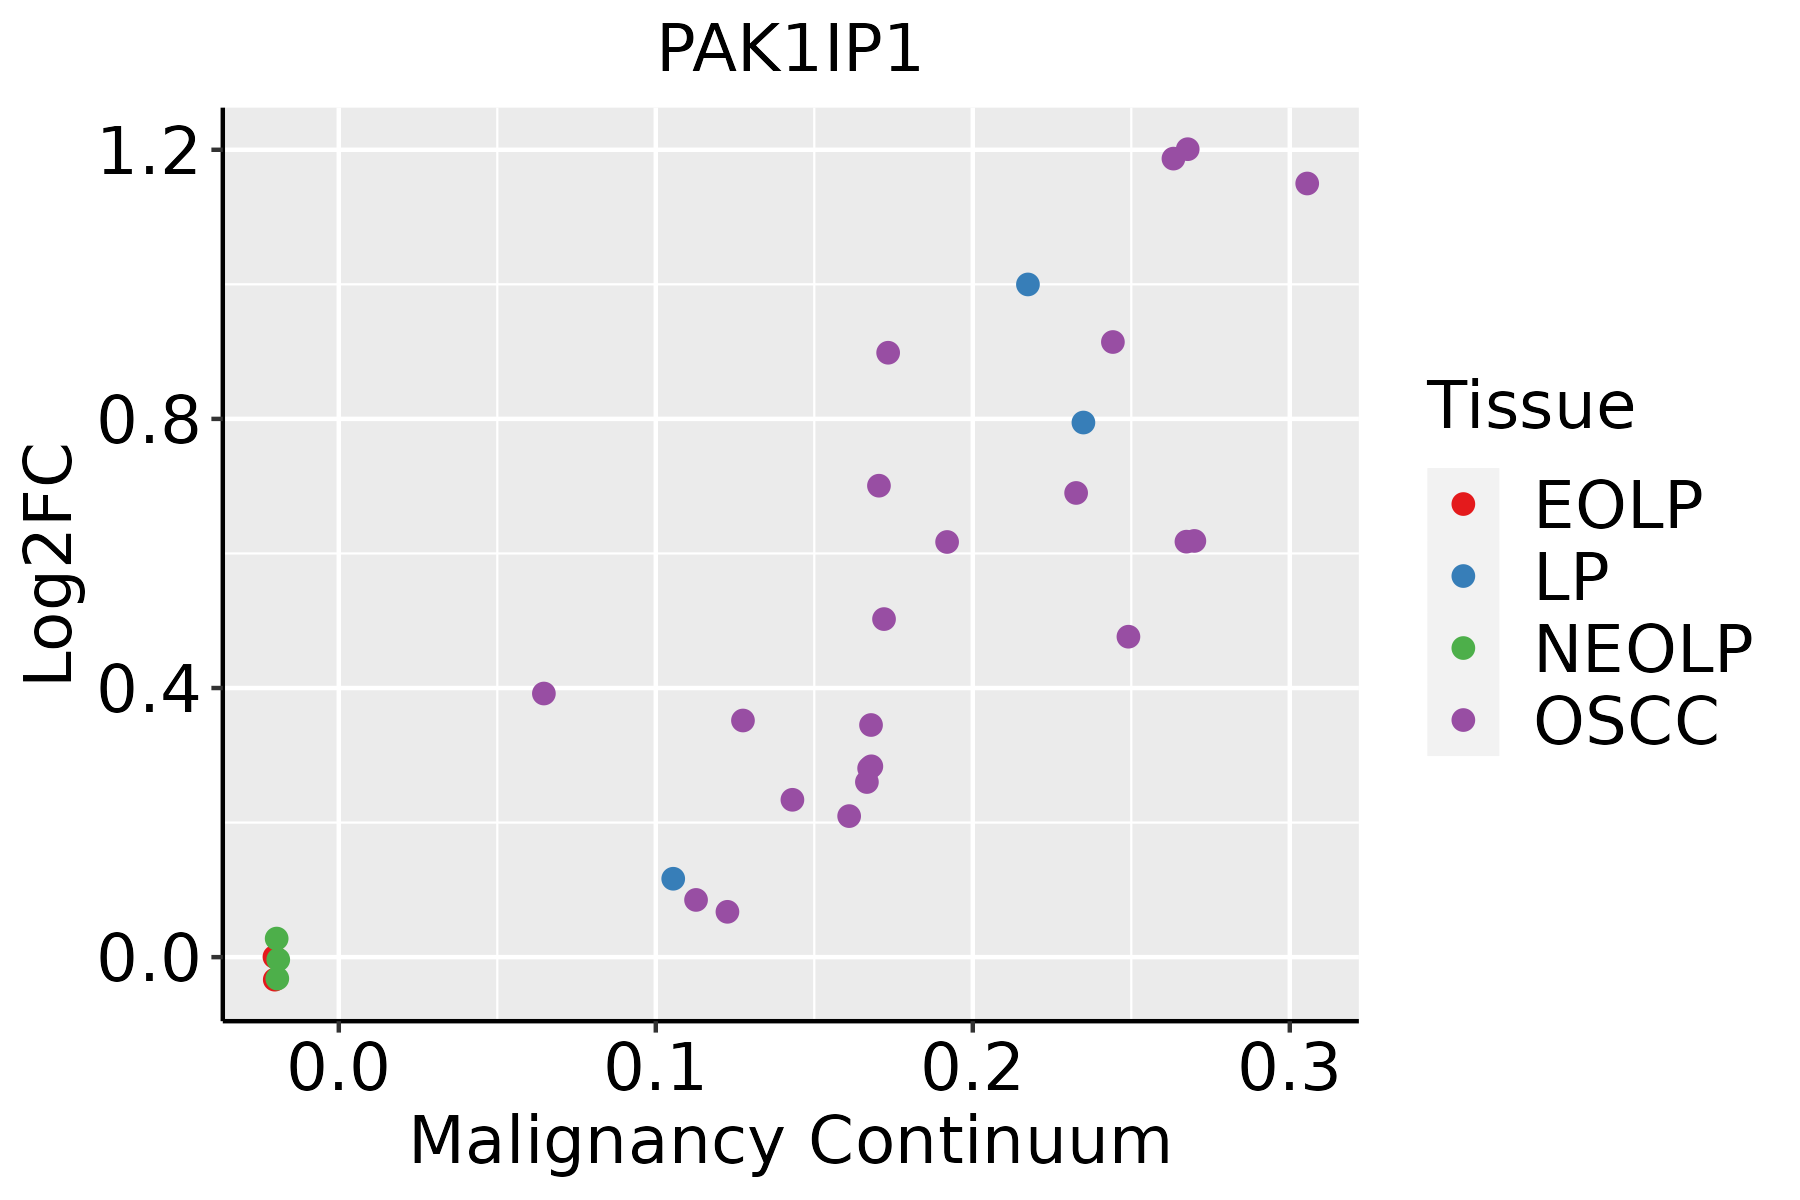 | EOLP: Erosive Oral lichen planus |
| LP: leukoplakia | ||
| NEOLP: Non-erosive oral lichen planus | ||
| OSCC: Oral squamous cell carcinoma | ||
| Prostate | 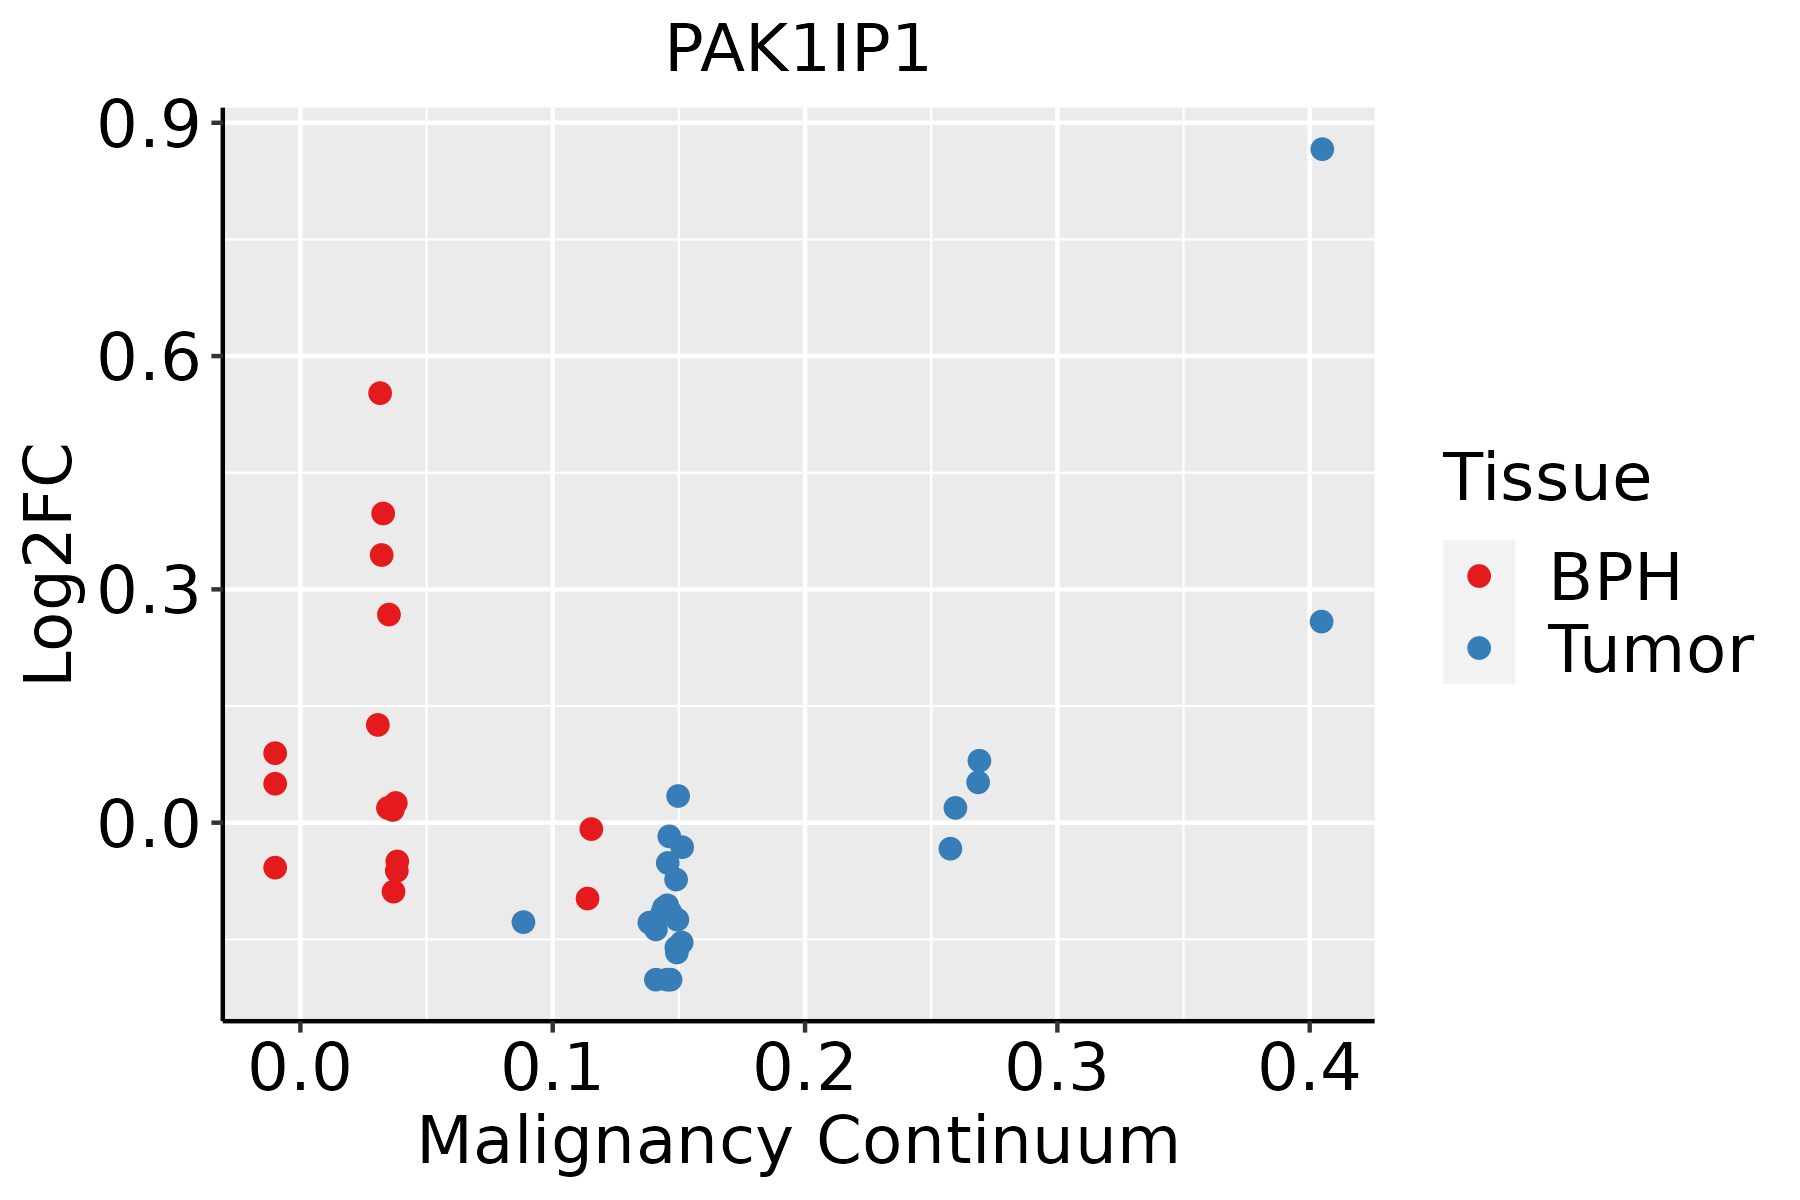 | BPH: Benign Prostatic Hyperplasia |
| Skin | 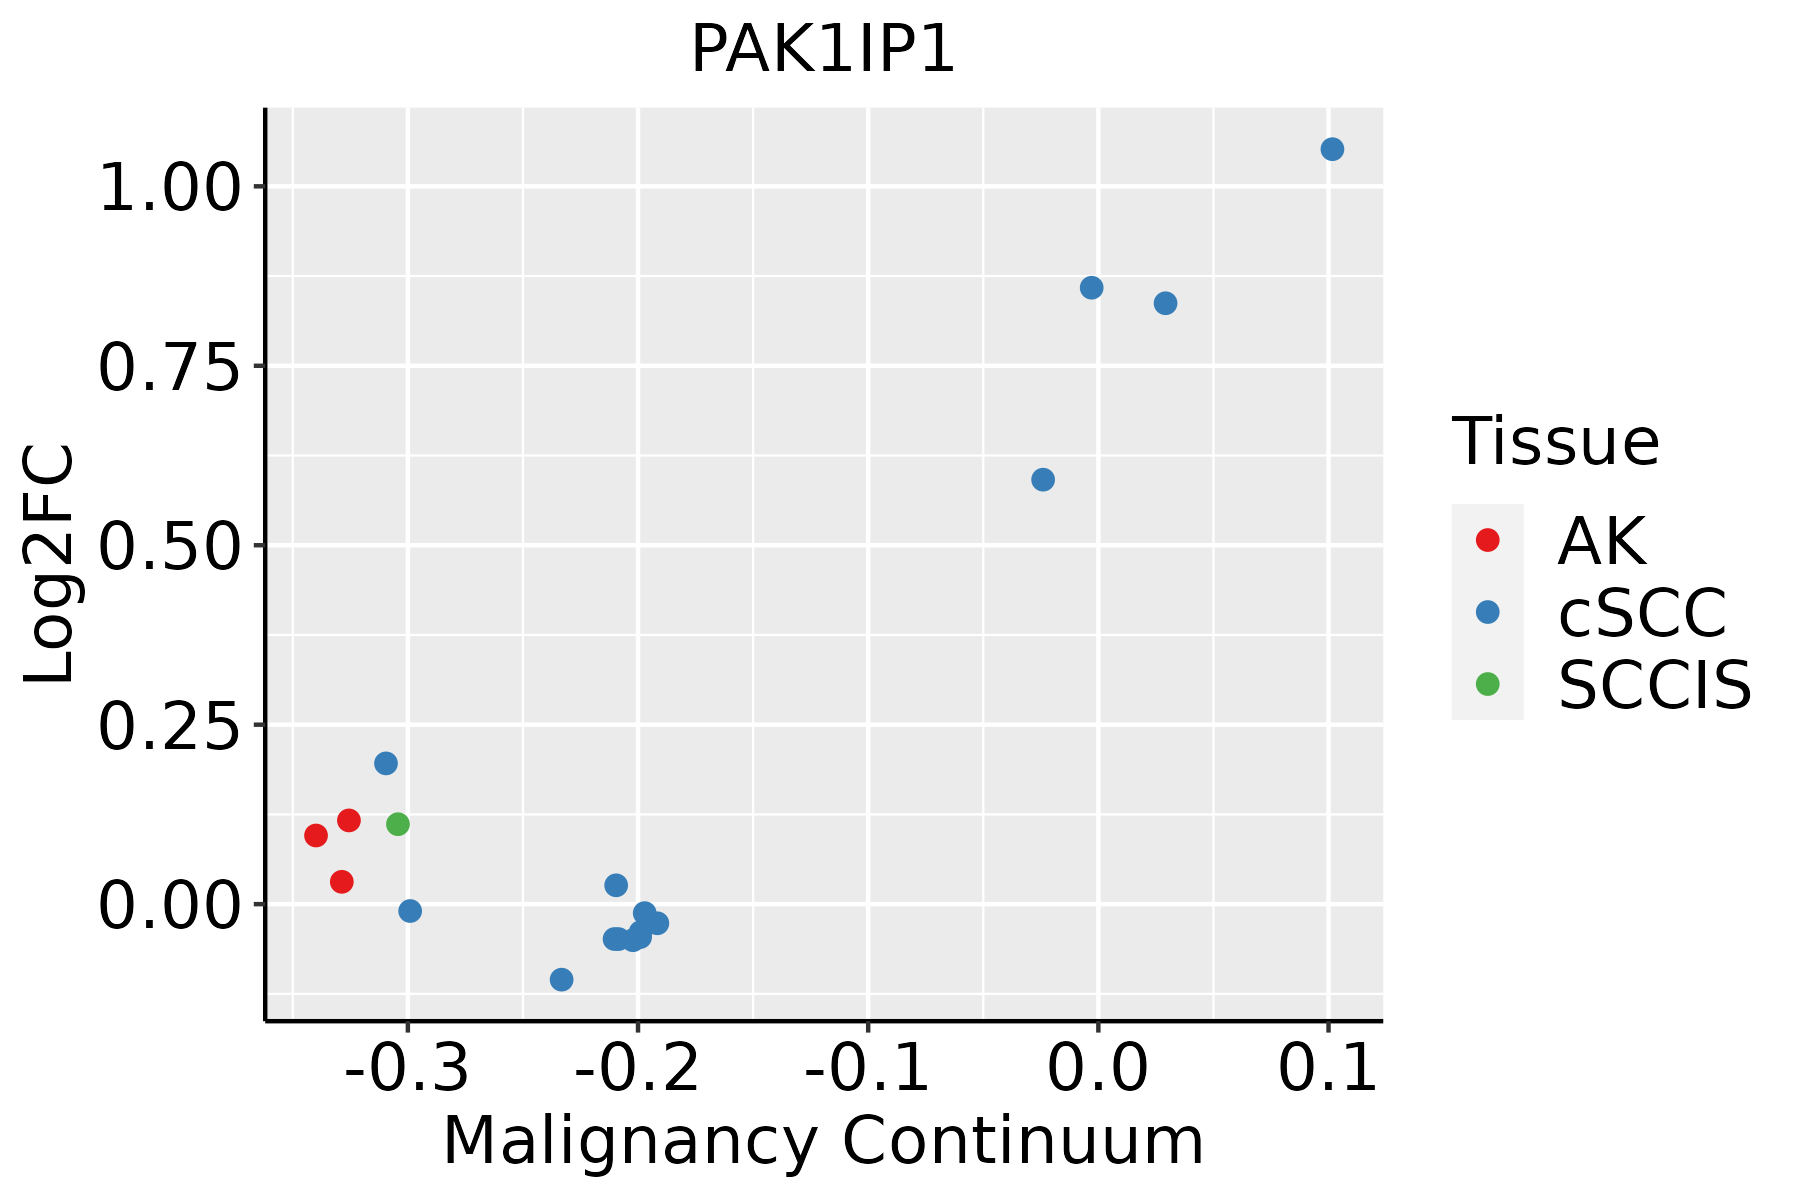 | AK: Actinic keratosis |
| cSCC: Cutaneous squamous cell carcinoma | ||
| SCCIS:squamous cell carcinoma in situ | ||
| Thyroid |  | ATC: Anaplastic thyroid cancer |
| HT: Hashimoto's thyroiditis | ||
| PTC: Papillary thyroid cancer |
| ∗log2FC in expression of this searched gene in stem-like cells from each diseased tissue sample relative to stem-like cells in normal samples in each tissue plotted against the malignancy continuum. Samples are colored based on if they are from different disease stage. |
Top |
Malignant transformation related pathway analysis |
| Find out the enriched GO biological processes and KEGG pathways involved in transition from healthy to precancer to cancer |
| Tissue | Disease Stage | Enriched GO biological Processes |
| Colorectum | AD |  |
| Colorectum | SER |  |
| Colorectum | MSS |  |
| Colorectum | MSI-H |  |
| Colorectum | FAP |  |
| ∗Top 15 enriched GO BP terms are showed in the bar plot of each disease state in each tissue. Each row represents a significant GO biological process which is colored according to the -log10(p.adjust). |
| Page: 1 2 3 4 5 6 7 8 9 |
| GO ID | Tissue | Disease Stage | Description | Gene Ratio | Bg Ratio | pvalue | p.adjust | Count |
| GO:0022613111 | Esophagus | ESCC | ribonucleoprotein complex biogenesis | 365/8552 | 463/18723 | 1.74e-49 | 1.11e-45 | 365 |
| GO:0042254111 | Esophagus | ESCC | ribosome biogenesis | 252/8552 | 299/18723 | 3.27e-44 | 1.04e-40 | 252 |
| GO:0042273111 | Esophagus | ESCC | ribosomal large subunit biogenesis | 65/8552 | 72/18723 | 1.53e-15 | 9.82e-14 | 65 |
| GO:0072331111 | Esophagus | ESCC | signal transduction by p53 class mediator | 121/8552 | 163/18723 | 9.61e-14 | 4.69e-12 | 121 |
| GO:1901796111 | Esophagus | ESCC | regulation of signal transduction by p53 class mediator | 70/8552 | 93/18723 | 5.69e-09 | 1.18e-07 | 70 |
| GO:0060021 | Esophagus | ESCC | roof of mouth development | 50/8552 | 85/18723 | 1.00e-02 | 3.42e-02 | 50 |
| GO:002261322 | Liver | HCC | ribonucleoprotein complex biogenesis | 355/7958 | 463/18723 | 7.76e-52 | 4.92e-48 | 355 |
| GO:004225422 | Liver | HCC | ribosome biogenesis | 246/7958 | 299/18723 | 4.99e-46 | 1.58e-42 | 246 |
| GO:004227322 | Liver | HCC | ribosomal large subunit biogenesis | 64/7958 | 72/18723 | 2.31e-16 | 2.03e-14 | 64 |
| GO:007233122 | Liver | HCC | signal transduction by p53 class mediator | 108/7958 | 163/18723 | 7.14e-10 | 2.23e-08 | 108 |
| GO:190179622 | Liver | HCC | regulation of signal transduction by p53 class mediator | 64/7958 | 93/18723 | 2.53e-07 | 4.45e-06 | 64 |
| GO:002261320 | Oral cavity | OSCC | ribonucleoprotein complex biogenesis | 333/7305 | 463/18723 | 8.28e-48 | 5.24e-44 | 333 |
| GO:004225420 | Oral cavity | OSCC | ribosome biogenesis | 230/7305 | 299/18723 | 3.22e-41 | 6.80e-38 | 230 |
| GO:004227320 | Oral cavity | OSCC | ribosomal large subunit biogenesis | 61/7305 | 72/18723 | 1.52e-15 | 1.06e-13 | 61 |
| GO:007233120 | Oral cavity | OSCC | signal transduction by p53 class mediator | 107/7305 | 163/18723 | 4.75e-12 | 1.83e-10 | 107 |
| GO:190179620 | Oral cavity | OSCC | regulation of signal transduction by p53 class mediator | 62/7305 | 93/18723 | 5.99e-08 | 1.09e-06 | 62 |
| GO:0022613110 | Oral cavity | LP | ribonucleoprotein complex biogenesis | 259/4623 | 463/18723 | 7.20e-48 | 2.25e-44 | 259 |
| GO:0042254110 | Oral cavity | LP | ribosome biogenesis | 173/4623 | 299/18723 | 8.97e-35 | 1.41e-31 | 173 |
| GO:0042273110 | Oral cavity | LP | ribosomal large subunit biogenesis | 53/4623 | 72/18723 | 3.25e-18 | 5.82e-16 | 53 |
| GO:0072331110 | Oral cavity | LP | signal transduction by p53 class mediator | 72/4623 | 163/18723 | 3.99e-08 | 1.41e-06 | 72 |
| Page: 1 2 3 |
| Pathway ID | Tissue | Disease Stage | Description | Gene Ratio | Bg Ratio | pvalue | p.adjust | qvalue | Count |
| Page: 1 |
Top |
Cell-cell communication analysis |
| Identification of potential cell-cell interactions between two cell types and their ligand-receptor pairs for different disease states |
| Ligand | Receptor | LRpair | Pathway | Tissue | Disease Stage |
| Page: 1 |
Top |
Single-cell gene regulatory network inference analysis |
| Find out the significant the regulons (TFs) and the target genes of each regulon across cell types for different disease states |
| TF | Cell Type | Tissue | Disease Stage | Target Gene | RSS | Regulon Activity |
| ∗The dot plots of a searched regulon are shown for all cell subpopulations in each disease state of each tissue based on the regulon specific score inferred using pySCENIC and by calculating the average expression. |
| Page: 1 |
Top |
Somatic mutation of malignant transformation related genes |
| Annotation of somatic variants for genes involved in malignant transformation |
| Hugo Symbol | Variant Class | Variant Classification | dbSNP RS | HGVSc | HGVSp | HGVSp Short | SWISSPROT | BIOTYPE | SIFT | PolyPhen | Tumor Sample Barcode | Tissue | Histology | Sex | Age | Stage | Therapy Types | Drugs | Outcome |
| PAK1IP1 | SNV | Missense_Mutation | novel | c.782T>C | p.Val261Ala | p.V261A | Q9NWT1 | protein_coding | deleterious(0.02) | benign(0.411) | TCGA-AN-A046-01 | Breast | breast invasive carcinoma | Female | >=65 | I/II | Unknown | Unknown | SD |
| PAK1IP1 | SNV | Missense_Mutation | c.718N>A | p.Glu240Lys | p.E240K | Q9NWT1 | protein_coding | tolerated(0.1) | benign(0.03) | TCGA-AA-3510-01 | Colorectum | colon adenocarcinoma | Male | >=65 | I/II | Unknown | Unknown | SD | |
| PAK1IP1 | SNV | Missense_Mutation | rs147437498 | c.1054N>T | p.Arg352Cys | p.R352C | Q9NWT1 | protein_coding | tolerated_low_confidence(0.2) | benign(0) | TCGA-AA-3510-01 | Colorectum | colon adenocarcinoma | Male | >=65 | I/II | Unknown | Unknown | SD |
| PAK1IP1 | SNV | Missense_Mutation | novel | c.439N>G | p.Leu147Val | p.L147V | Q9NWT1 | protein_coding | deleterious(0) | possibly_damaging(0.633) | TCGA-AA-3984-01 | Colorectum | colon adenocarcinoma | Female | <65 | I/II | Unknown | Unknown | SD |
| PAK1IP1 | SNV | Missense_Mutation | novel | c.682A>T | p.Arg228Trp | p.R228W | Q9NWT1 | protein_coding | deleterious(0) | probably_damaging(0.958) | TCGA-AA-A01K-01 | Colorectum | colon adenocarcinoma | Female | >=65 | III/IV | Chemotherapy | folinic | CR |
| PAK1IP1 | SNV | Missense_Mutation | c.520N>A | p.Pro174Thr | p.P174T | Q9NWT1 | protein_coding | deleterious(0.02) | benign(0.341) | TCGA-AD-A5EJ-01 | Colorectum | colon adenocarcinoma | Female | >=65 | I/II | Unknown | Unknown | SD | |
| PAK1IP1 | SNV | Missense_Mutation | c.688N>C | p.Phe230Leu | p.F230L | Q9NWT1 | protein_coding | tolerated(0.08) | benign(0.067) | TCGA-EI-6511-01 | Colorectum | rectum adenocarcinoma | Male | <65 | III/IV | Chemotherapy | oxaliplatinum+5-fu | SD | |
| PAK1IP1 | deletion | Frame_Shift_Del | c.685delN | p.Phe230LeufsTer6 | p.F230Lfs*6 | Q9NWT1 | protein_coding | TCGA-AD-A5EJ-01 | Colorectum | colon adenocarcinoma | Female | >=65 | I/II | Unknown | Unknown | SD | |||
| PAK1IP1 | SNV | Missense_Mutation | rs769673112 | c.1030N>T | p.Arg344Trp | p.R344W | Q9NWT1 | protein_coding | deleterious_low_confidence(0.01) | benign(0.332) | TCGA-A5-A0G2-01 | Endometrium | uterine corpus endometrioid carcinoma | Female | <65 | III/IV | Unknown | Unknown | SD |
| PAK1IP1 | SNV | Missense_Mutation | c.844N>T | p.Val282Phe | p.V282F | Q9NWT1 | protein_coding | tolerated(0.08) | benign(0.212) | TCGA-AP-A051-01 | Endometrium | uterine corpus endometrioid carcinoma | Female | >=65 | I/II | Unknown | Unknown | SD |
| Page: 1 2 3 4 |
Top |
Related drugs of malignant transformation related genes |
| Identification of chemicals and drugs interact with genes involved in malignant transfromation |
| (DGIdb 4.0) |
| Entrez ID | Symbol | Category | Interaction Types | Drug Claim Name | Drug Name | PMIDs |
| Page: 1 |

Copyright 2023-Present -The University of Texas Health Science Center at Houston |