
|
|||||
|
 | |
| |
| |
| |
| |
| |
|
Gene: PAIP2 |
Gene summary for PAIP2 |
| Gene information | Species | Human | Gene symbol | PAIP2 | Gene ID | 51247 |
| Gene name | poly(A) binding protein interacting protein 2 | |
| Gene Alias | PAIP-2 | |
| Cytomap | 5q31.2 | |
| Gene Type | protein-coding | GO ID | GO:0000003 | UniProtAcc | Q49AE6 |
Top |
Malignant transformation analysis |
| Identification of the aberrant gene expression in precancerous and cancerous lesions by comparing the gene expression of stem-like cells in diseased tissues with normal stem cells |
| Entrez ID | Symbol | Replicates | Species | Organ | Tissue | Adj P-value | Log2FC | Malignancy |
| 51247 | PAIP2 | LZE4T | Human | Esophagus | ESCC | 5.98e-14 | 6.05e-01 | 0.0811 |
| 51247 | PAIP2 | LZE7T | Human | Esophagus | ESCC | 3.84e-07 | 4.74e-01 | 0.0667 |
| 51247 | PAIP2 | LZE8T | Human | Esophagus | ESCC | 1.48e-09 | 6.41e-01 | 0.067 |
| 51247 | PAIP2 | LZE20T | Human | Esophagus | ESCC | 9.37e-05 | 1.67e-01 | 0.0662 |
| 51247 | PAIP2 | LZE22T | Human | Esophagus | ESCC | 1.18e-02 | 4.60e-01 | 0.068 |
| 51247 | PAIP2 | LZE24T | Human | Esophagus | ESCC | 6.72e-24 | 1.05e+00 | 0.0596 |
| 51247 | PAIP2 | LZE22D3 | Human | Esophagus | HGIN | 5.97e-03 | 1.34e-01 | 0.0653 |
| 51247 | PAIP2 | LZE21T | Human | Esophagus | ESCC | 1.41e-02 | 6.17e-01 | 0.0655 |
| 51247 | PAIP2 | LZE6T | Human | Esophagus | ESCC | 1.26e-07 | 7.77e-01 | 0.0845 |
| 51247 | PAIP2 | P2T-E | Human | Esophagus | ESCC | 6.53e-68 | 1.41e+00 | 0.1177 |
| 51247 | PAIP2 | P4T-E | Human | Esophagus | ESCC | 1.79e-35 | 1.09e+00 | 0.1323 |
| 51247 | PAIP2 | P5T-E | Human | Esophagus | ESCC | 1.03e-35 | 8.34e-01 | 0.1327 |
| 51247 | PAIP2 | P8T-E | Human | Esophagus | ESCC | 1.50e-28 | 5.71e-01 | 0.0889 |
| 51247 | PAIP2 | P9T-E | Human | Esophagus | ESCC | 1.26e-32 | 9.56e-01 | 0.1131 |
| 51247 | PAIP2 | P10T-E | Human | Esophagus | ESCC | 4.23e-53 | 1.11e+00 | 0.116 |
| 51247 | PAIP2 | P11T-E | Human | Esophagus | ESCC | 2.46e-24 | 1.31e+00 | 0.1426 |
| 51247 | PAIP2 | P12T-E | Human | Esophagus | ESCC | 2.72e-69 | 1.74e+00 | 0.1122 |
| 51247 | PAIP2 | P15T-E | Human | Esophagus | ESCC | 2.44e-39 | 1.18e+00 | 0.1149 |
| 51247 | PAIP2 | P16T-E | Human | Esophagus | ESCC | 4.95e-50 | 1.18e+00 | 0.1153 |
| 51247 | PAIP2 | P17T-E | Human | Esophagus | ESCC | 3.89e-06 | 8.56e-01 | 0.1278 |
| Page: 1 2 3 4 5 6 7 8 |
| Tissue | Expression Dynamics | Abbreviation |
| Esophagus | 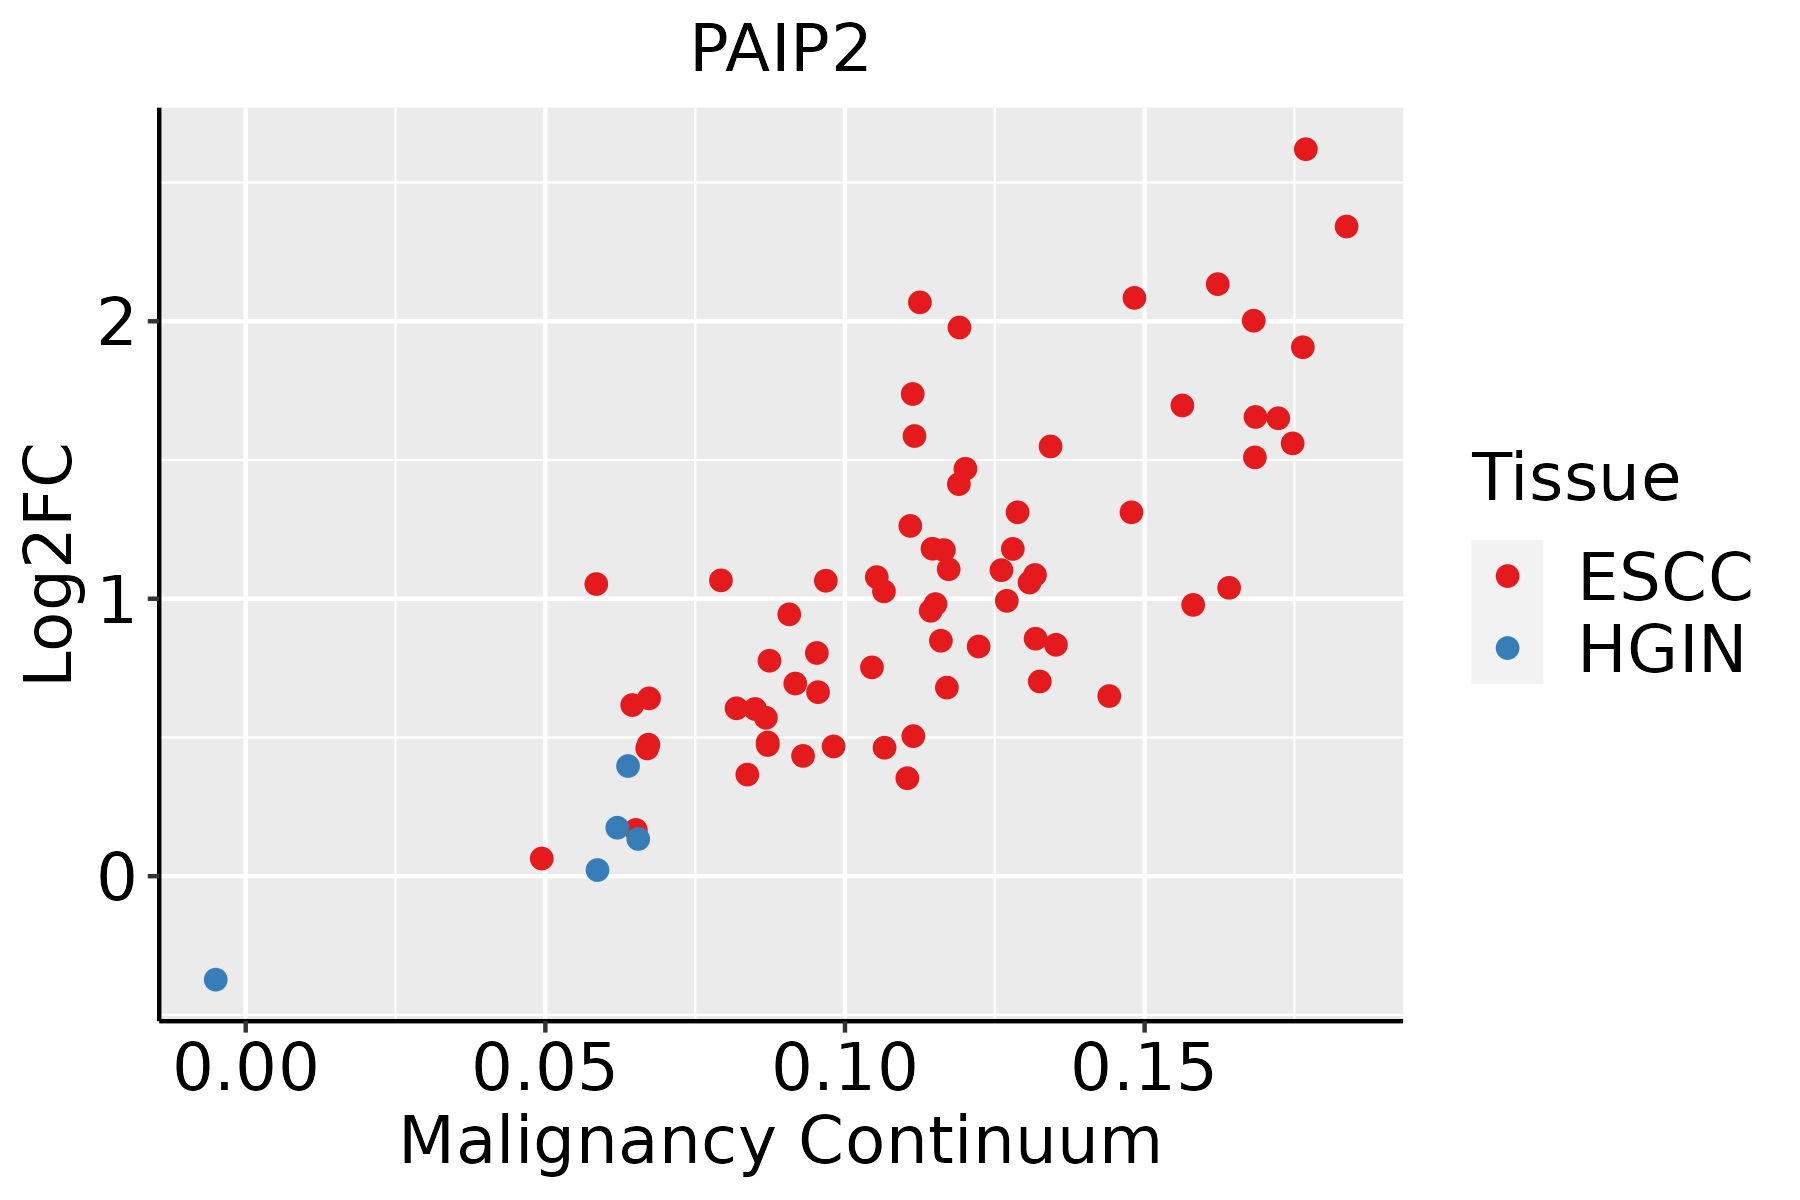 | ESCC: Esophageal squamous cell carcinoma |
| HGIN: High-grade intraepithelial neoplasias | ||
| LGIN: Low-grade intraepithelial neoplasias | ||
| Liver | 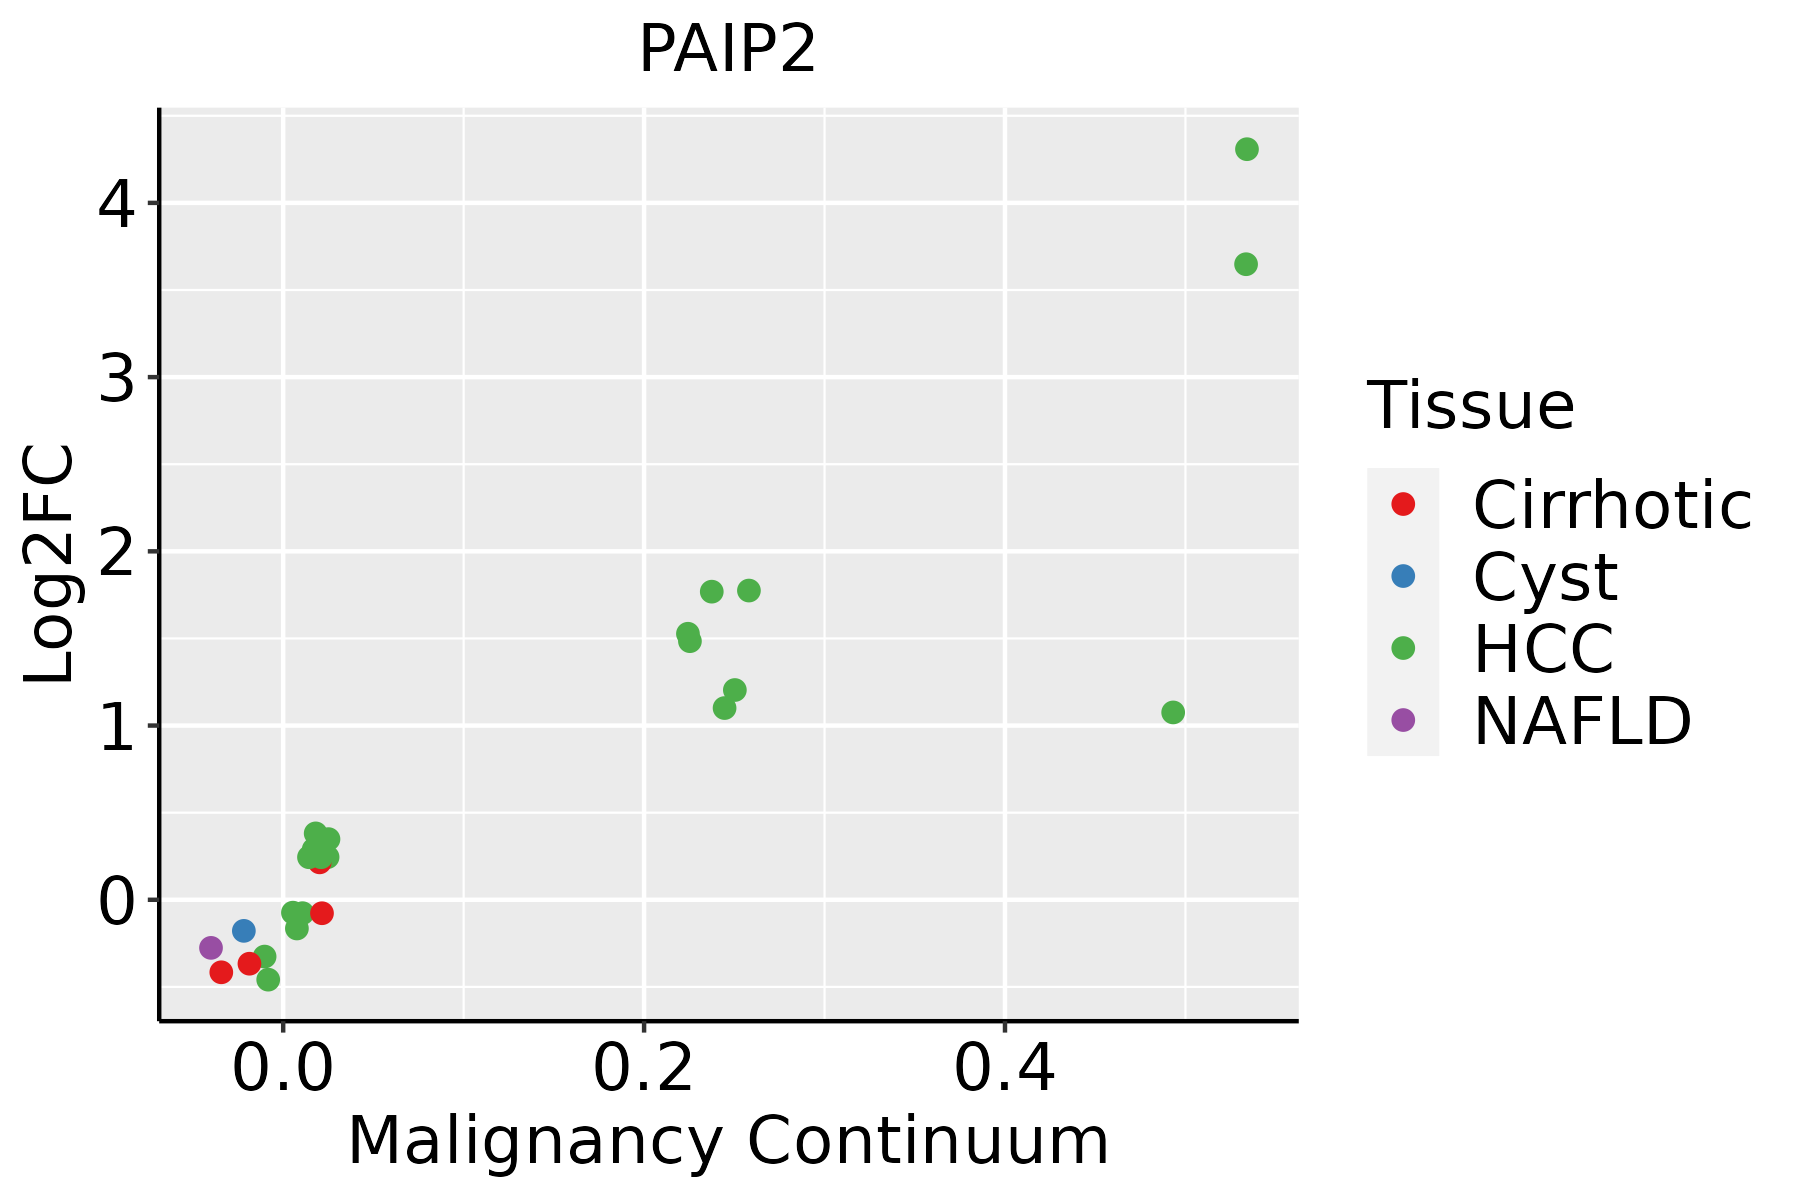 | HCC: Hepatocellular carcinoma |
| NAFLD: Non-alcoholic fatty liver disease | ||
| Oral Cavity |  | EOLP: Erosive Oral lichen planus |
| LP: leukoplakia | ||
| NEOLP: Non-erosive oral lichen planus | ||
| OSCC: Oral squamous cell carcinoma | ||
| Prostate | 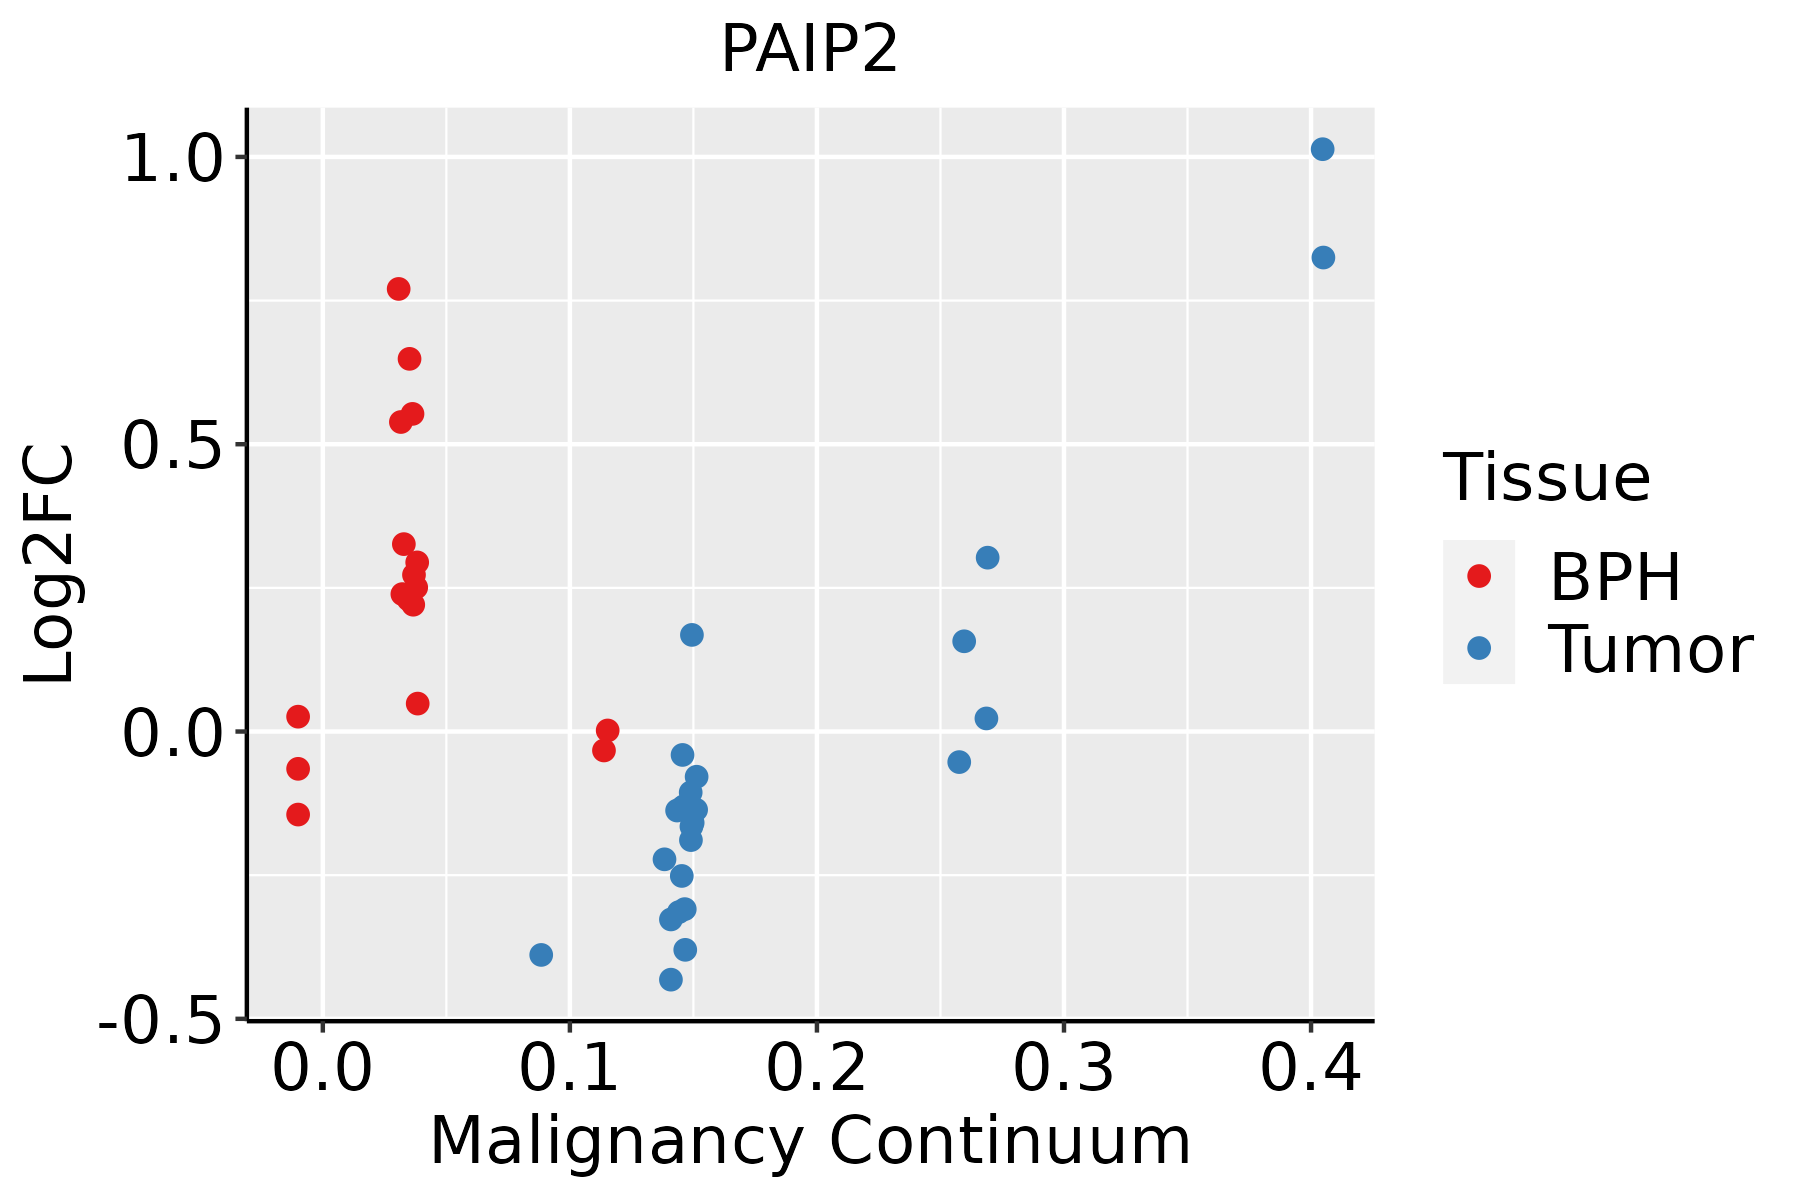 | BPH: Benign Prostatic Hyperplasia |
| Skin | 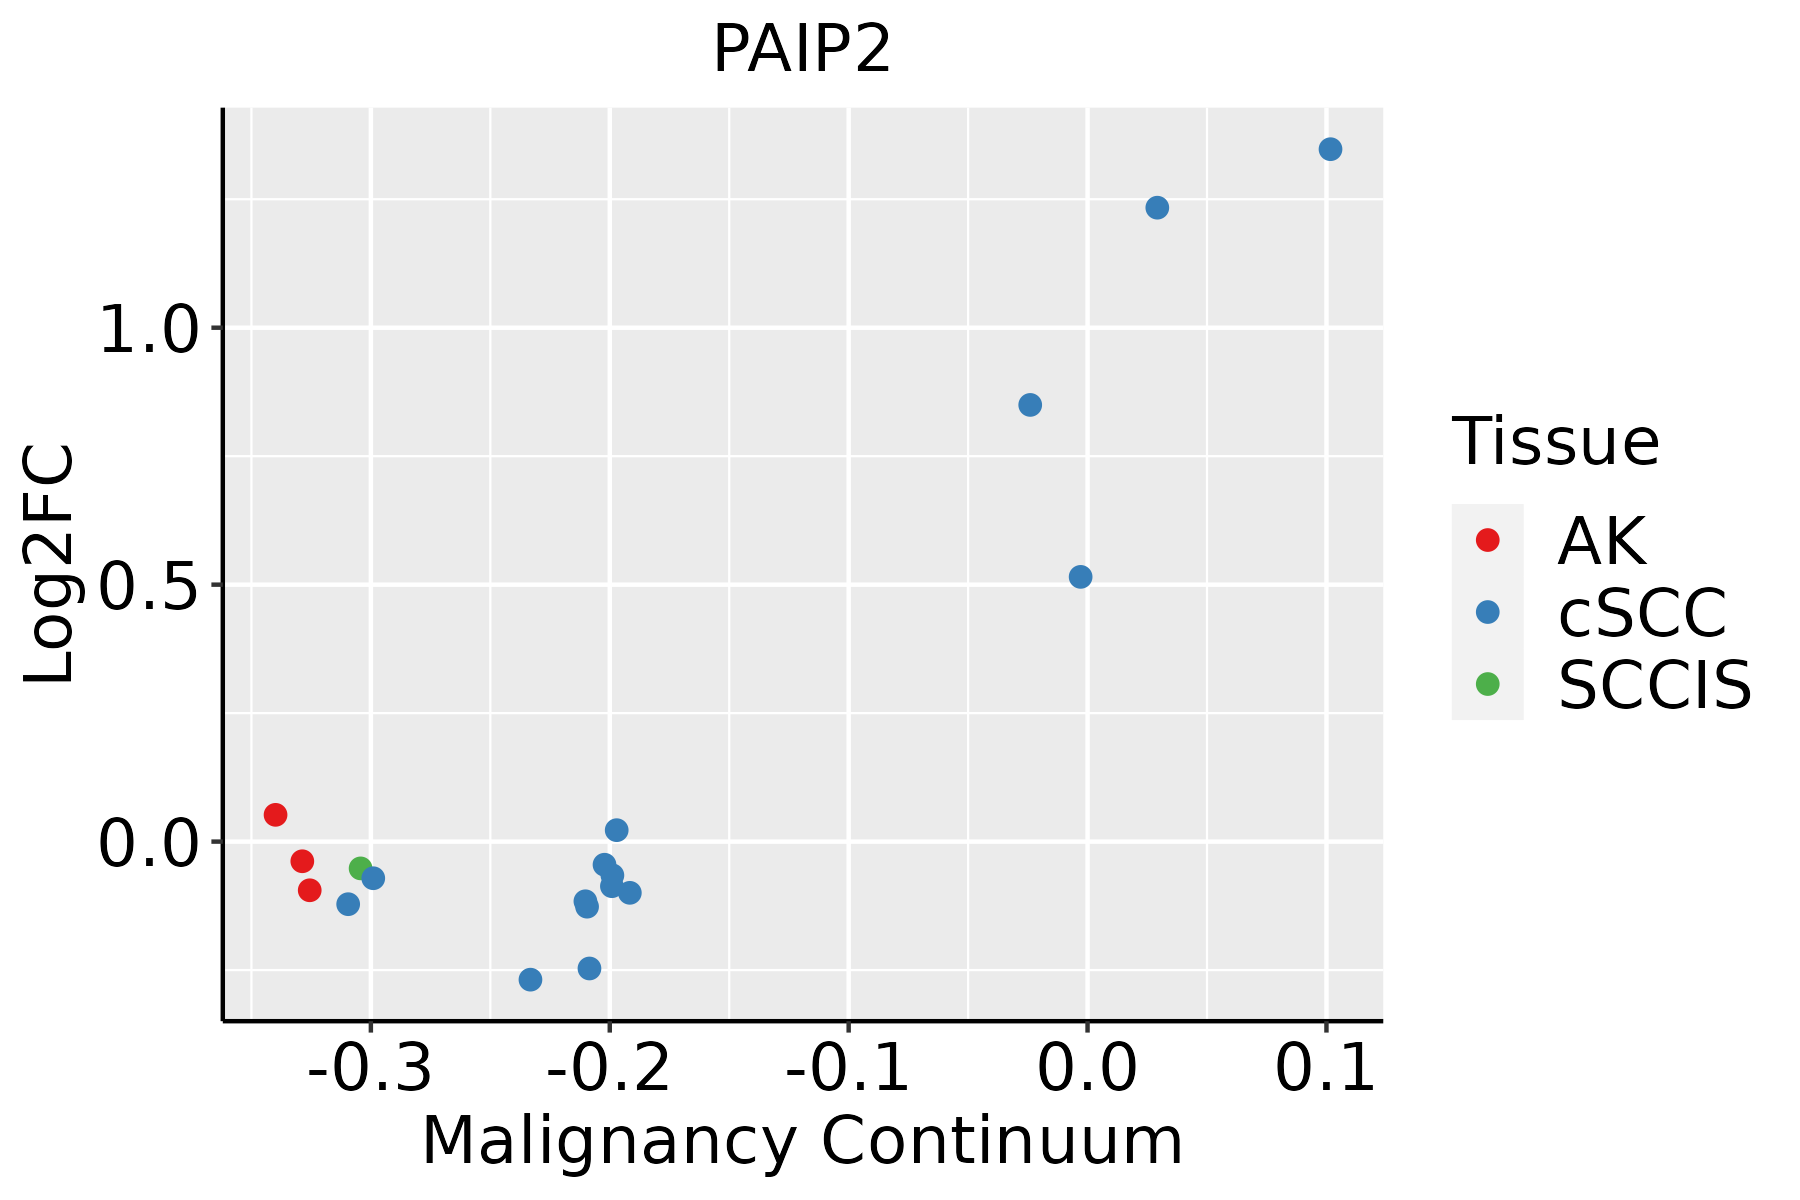 | AK: Actinic keratosis |
| cSCC: Cutaneous squamous cell carcinoma | ||
| SCCIS:squamous cell carcinoma in situ | ||
| Thyroid | 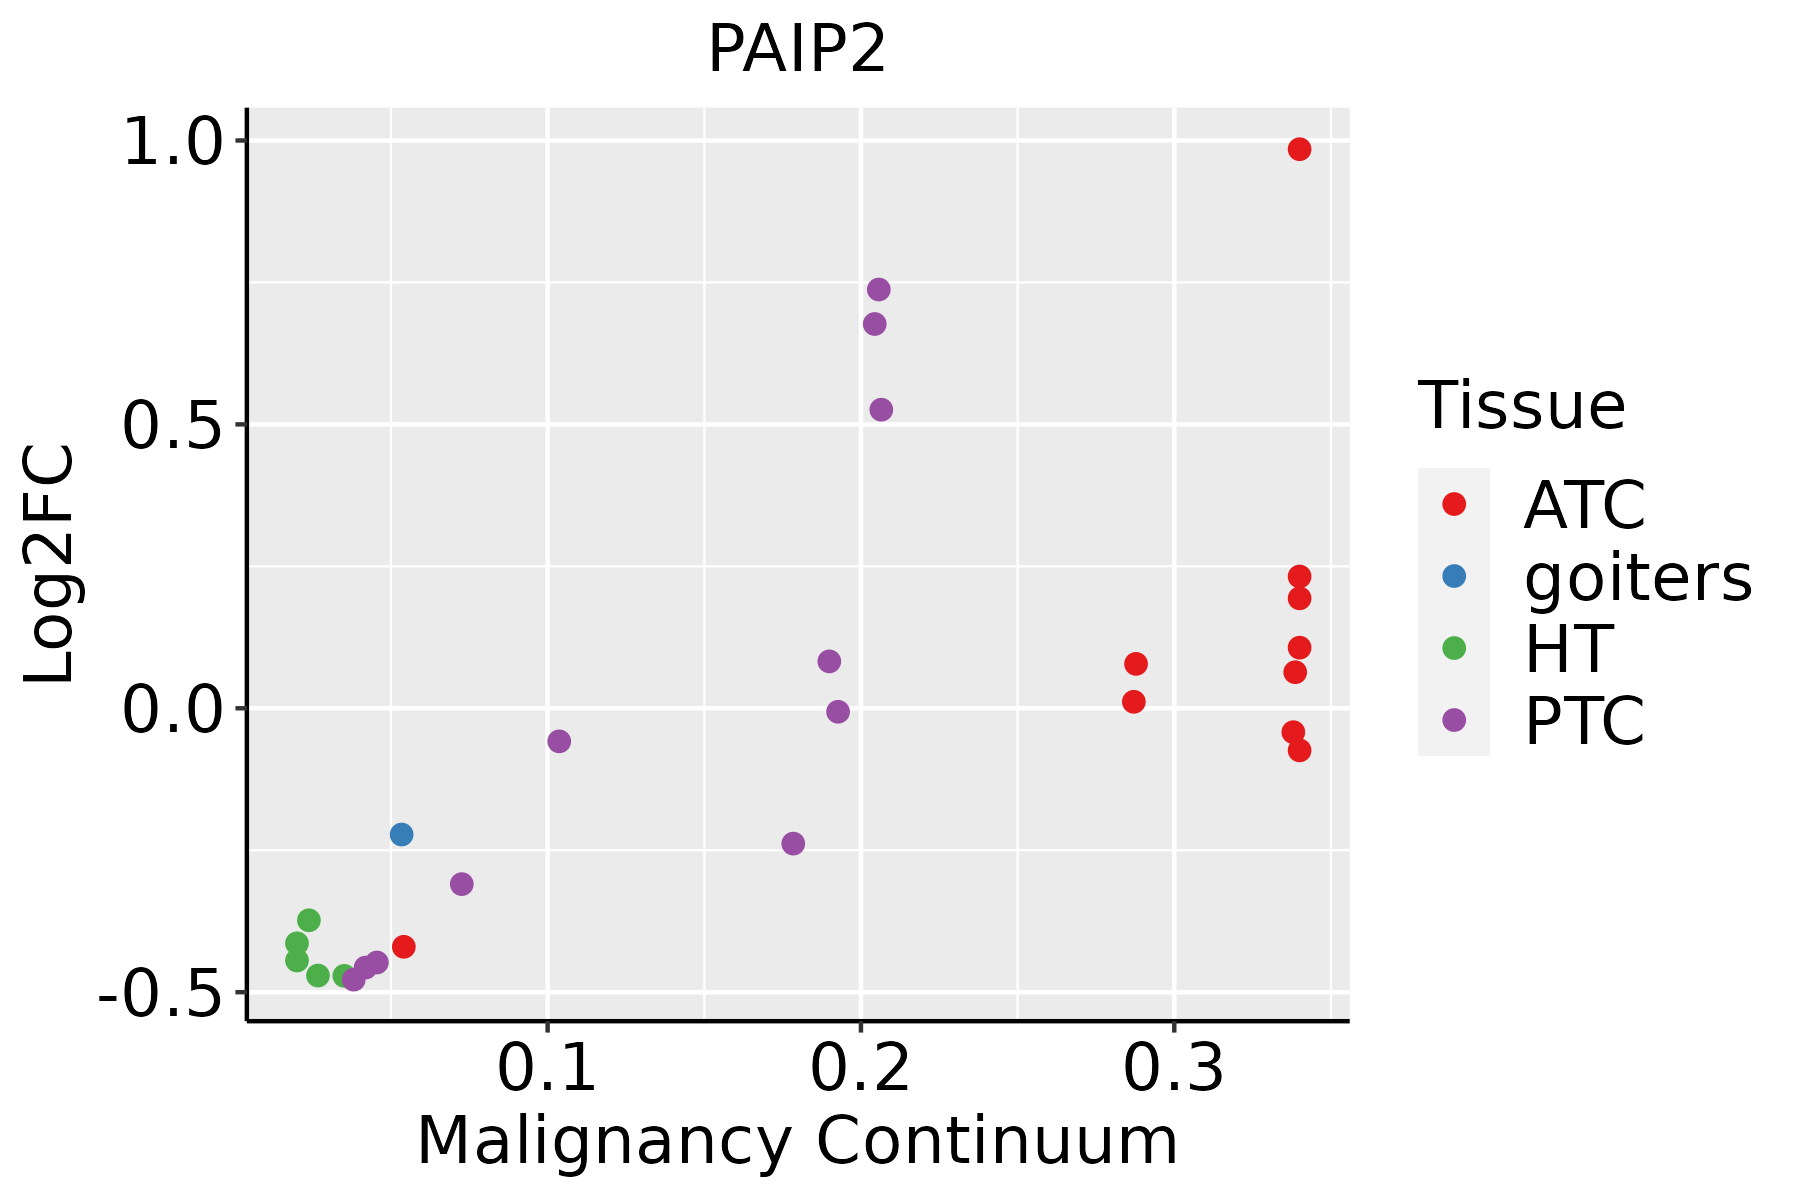 | ATC: Anaplastic thyroid cancer |
| HT: Hashimoto's thyroiditis | ||
| PTC: Papillary thyroid cancer |
| ∗log2FC in expression of this searched gene in stem-like cells from each diseased tissue sample relative to stem-like cells in normal samples in each tissue plotted against the malignancy continuum. Samples are colored based on if they are from different disease stage. |
Top |
Malignant transformation related pathway analysis |
| Find out the enriched GO biological processes and KEGG pathways involved in transition from healthy to precancer to cancer |
| Tissue | Disease Stage | Enriched GO biological Processes |
| Colorectum | AD |  |
| Colorectum | SER |  |
| Colorectum | MSS |  |
| Colorectum | MSI-H |  |
| Colorectum | FAP |  |
| ∗Top 15 enriched GO BP terms are showed in the bar plot of each disease state in each tissue. Each row represents a significant GO biological process which is colored according to the -log10(p.adjust). |
| Page: 1 2 3 4 5 6 7 8 9 |
| GO ID | Tissue | Disease Stage | Description | Gene Ratio | Bg Ratio | pvalue | p.adjust | Count |
| GO:000641727 | Esophagus | HGIN | regulation of translation | 139/2587 | 468/18723 | 1.46e-19 | 7.98e-17 | 139 |
| GO:000641320 | Esophagus | HGIN | translational initiation | 55/2587 | 118/18723 | 7.33e-18 | 2.31e-15 | 55 |
| GO:000644610 | Esophagus | HGIN | regulation of translational initiation | 34/2587 | 79/18723 | 2.09e-10 | 1.97e-08 | 34 |
| GO:00342496 | Esophagus | HGIN | negative regulation of cellular amide metabolic process | 66/2587 | 273/18723 | 2.74e-06 | 9.60e-05 | 66 |
| GO:00171486 | Esophagus | HGIN | negative regulation of translation | 59/2587 | 245/18723 | 1.03e-05 | 2.96e-04 | 59 |
| GO:00459475 | Esophagus | HGIN | negative regulation of translational initiation | 10/2587 | 19/18723 | 6.97e-05 | 1.59e-03 | 10 |
| GO:0006413110 | Esophagus | ESCC | translational initiation | 100/8552 | 118/18723 | 1.16e-18 | 1.25e-16 | 100 |
| GO:0006417111 | Esophagus | ESCC | regulation of translation | 304/8552 | 468/18723 | 1.53e-17 | 1.33e-15 | 304 |
| GO:000644617 | Esophagus | ESCC | regulation of translational initiation | 65/8552 | 79/18723 | 2.04e-11 | 7.07e-10 | 65 |
| GO:004594714 | Esophagus | ESCC | negative regulation of translational initiation | 16/8552 | 19/18723 | 6.45e-04 | 3.43e-03 | 16 |
| GO:003424914 | Esophagus | ESCC | negative regulation of cellular amide metabolic process | 144/8552 | 273/18723 | 1.08e-02 | 3.67e-02 | 144 |
| GO:000641312 | Liver | Cirrhotic | translational initiation | 76/4634 | 118/18723 | 8.36e-20 | 2.18e-17 | 76 |
| GO:000641712 | Liver | Cirrhotic | regulation of translation | 194/4634 | 468/18723 | 7.28e-16 | 8.79e-14 | 194 |
| GO:000644612 | Liver | Cirrhotic | regulation of translational initiation | 48/4634 | 79/18723 | 1.14e-11 | 7.14e-10 | 48 |
| GO:003424911 | Liver | Cirrhotic | negative regulation of cellular amide metabolic process | 100/4634 | 273/18723 | 7.34e-06 | 1.13e-04 | 100 |
| GO:001714811 | Liver | Cirrhotic | negative regulation of translation | 87/4634 | 245/18723 | 1.01e-04 | 1.05e-03 | 87 |
| GO:00459472 | Liver | Cirrhotic | negative regulation of translational initiation | 10/4634 | 19/18723 | 8.23e-03 | 3.83e-02 | 10 |
| GO:000641722 | Liver | HCC | regulation of translation | 287/7958 | 468/18723 | 8.79e-17 | 8.08e-15 | 287 |
| GO:000641322 | Liver | HCC | translational initiation | 94/7958 | 118/18723 | 1.39e-16 | 1.24e-14 | 94 |
| GO:000644622 | Liver | HCC | regulation of translational initiation | 62/7958 | 79/18723 | 6.85e-11 | 2.48e-09 | 62 |
| Page: 1 2 3 4 5 |
| Pathway ID | Tissue | Disease Stage | Description | Gene Ratio | Bg Ratio | pvalue | p.adjust | qvalue | Count |
| Page: 1 |
Top |
Cell-cell communication analysis |
| Identification of potential cell-cell interactions between two cell types and their ligand-receptor pairs for different disease states |
| Ligand | Receptor | LRpair | Pathway | Tissue | Disease Stage |
| Page: 1 |
Top |
Single-cell gene regulatory network inference analysis |
| Find out the significant the regulons (TFs) and the target genes of each regulon across cell types for different disease states |
| TF | Cell Type | Tissue | Disease Stage | Target Gene | RSS | Regulon Activity |
| ∗The dot plots of a searched regulon are shown for all cell subpopulations in each disease state of each tissue based on the regulon specific score inferred using pySCENIC and by calculating the average expression. |
| Page: 1 |
Top |
Somatic mutation of malignant transformation related genes |
| Annotation of somatic variants for genes involved in malignant transformation |
| Hugo Symbol | Variant Class | Variant Classification | dbSNP RS | HGVSc | HGVSp | HGVSp Short | SWISSPROT | BIOTYPE | SIFT | PolyPhen | Tumor Sample Barcode | Tissue | Histology | Sex | Age | Stage | Therapy Types | Drugs | Outcome |
| PAIP2 | insertion | Frame_Shift_Ins | novel | c.88_89insAAAAAGAAAA | p.Pro30GlnfsTer14 | p.P30Qfs*14 | Q9BPZ3 | protein_coding | TCGA-A8-A09C-01 | Breast | breast invasive carcinoma | Female | >=65 | I/II | Unknown | Unknown | SD | ||
| PAIP2 | SNV | Missense_Mutation | novel | c.64N>A | p.Gly22Ser | p.G22S | Q9BPZ3 | protein_coding | tolerated(0.14) | benign(0.013) | TCGA-F5-6814-01 | Colorectum | rectum adenocarcinoma | Male | <65 | I/II | Unknown | Unknown | SD |
| PAIP2 | SNV | Missense_Mutation | novel | c.296N>A | p.Gly99Asp | p.G99D | Q9BPZ3 | protein_coding | tolerated(0.32) | benign(0.284) | TCGA-A5-A0G2-01 | Endometrium | uterine corpus endometrioid carcinoma | Female | <65 | III/IV | Unknown | Unknown | SD |
| PAIP2 | SNV | Missense_Mutation | rs779602855 | c.175N>T | p.Arg59Cys | p.R59C | Q9BPZ3 | protein_coding | deleterious(0.03) | possibly_damaging(0.521) | TCGA-SL-A6J9-01 | Endometrium | uterine corpus endometrioid carcinoma | Female | >=65 | I/II | Unknown | Unknown | SD |
| PAIP2 | SNV | Missense_Mutation | c.253G>T | p.Asp85Tyr | p.D85Y | Q9BPZ3 | protein_coding | deleterious(0.01) | benign(0.354) | TCGA-75-5126-01 | Lung | lung adenocarcinoma | Female | Unknown | III/IV | Unknown | Unknown | SD | |
| PAIP2 | SNV | Missense_Mutation | novel | c.329A>T | p.Asn110Ile | p.N110I | Q9BPZ3 | protein_coding | tolerated(0.14) | benign(0.029) | TCGA-78-7155-01 | Lung | lung adenocarcinoma | Male | >=65 | I/II | Chemotherapy | carboplatin | PD |
| PAIP2 | SNV | Missense_Mutation | novel | c.257N>T | p.Gln86Leu | p.Q86L | Q9BPZ3 | protein_coding | deleterious(0.01) | benign(0.097) | TCGA-D7-A6EY-01 | Stomach | stomach adenocarcinoma | Female | >=65 | III/IV | Unknown | Unknown | PD |
| PAIP2 | SNV | Missense_Mutation | novel | c.176G>A | p.Arg59His | p.R59H | Q9BPZ3 | protein_coding | deleterious(0.01) | possibly_damaging(0.521) | TCGA-HU-A4H8-01 | Stomach | stomach adenocarcinoma | Male | >=65 | I/II | Chemotherapy | didox | PD |
| PAIP2 | SNV | Missense_Mutation | c.233N>A | p.Arg78Gln | p.R78Q | Q9BPZ3 | protein_coding | deleterious(0.05) | benign(0.006) | TCGA-VQ-A8P2-01 | Stomach | stomach adenocarcinoma | Male | >=65 | III/IV | Unspecific | Complete Response |
| Page: 1 |
Top |
Related drugs of malignant transformation related genes |
| Identification of chemicals and drugs interact with genes involved in malignant transfromation |
| (DGIdb 4.0) |
| Entrez ID | Symbol | Category | Interaction Types | Drug Claim Name | Drug Name | PMIDs |
| Page: 1 |

Copyright 2023-Present -The University of Texas Health Science Center at Houston |