
|
|||||
|
 | |
| |
| |
| |
| |
| |
|
Gene: PAIP1 |
Gene summary for PAIP1 |
| Gene information | Species | Human | Gene symbol | PAIP1 | Gene ID | 10605 |
| Gene name | poly(A) binding protein interacting protein 1 | |
| Gene Alias | PAIP1 | |
| Cytomap | 5p12 | |
| Gene Type | protein-coding | GO ID | GO:0006139 | UniProtAcc | Q9H074 |
Top |
Malignant transformation analysis |
| Identification of the aberrant gene expression in precancerous and cancerous lesions by comparing the gene expression of stem-like cells in diseased tissues with normal stem cells |
| Entrez ID | Symbol | Replicates | Species | Organ | Tissue | Adj P-value | Log2FC | Malignancy |
| 10605 | PAIP1 | LZE2T | Human | Esophagus | ESCC | 4.68e-05 | 8.89e-01 | 0.082 |
| 10605 | PAIP1 | LZE4T | Human | Esophagus | ESCC | 1.85e-21 | 4.99e-01 | 0.0811 |
| 10605 | PAIP1 | LZE5T | Human | Esophagus | ESCC | 2.19e-11 | 9.70e-01 | 0.0514 |
| 10605 | PAIP1 | LZE7T | Human | Esophagus | ESCC | 3.33e-05 | 3.61e-01 | 0.0667 |
| 10605 | PAIP1 | LZE8T | Human | Esophagus | ESCC | 7.55e-09 | 1.71e-01 | 0.067 |
| 10605 | PAIP1 | LZE20T | Human | Esophagus | ESCC | 5.24e-17 | 6.62e-01 | 0.0662 |
| 10605 | PAIP1 | LZE22T | Human | Esophagus | ESCC | 1.70e-12 | 1.09e+00 | 0.068 |
| 10605 | PAIP1 | LZE24T | Human | Esophagus | ESCC | 2.33e-37 | 9.68e-01 | 0.0596 |
| 10605 | PAIP1 | LZE21T | Human | Esophagus | ESCC | 2.43e-02 | 2.63e-01 | 0.0655 |
| 10605 | PAIP1 | LZE6T | Human | Esophagus | ESCC | 1.28e-13 | 8.18e-01 | 0.0845 |
| 10605 | PAIP1 | P1T-E | Human | Esophagus | ESCC | 2.25e-11 | 8.21e-01 | 0.0875 |
| 10605 | PAIP1 | P2T-E | Human | Esophagus | ESCC | 8.90e-71 | 1.28e+00 | 0.1177 |
| 10605 | PAIP1 | P4T-E | Human | Esophagus | ESCC | 2.18e-74 | 1.68e+00 | 0.1323 |
| 10605 | PAIP1 | P5T-E | Human | Esophagus | ESCC | 1.76e-36 | 8.67e-01 | 0.1327 |
| 10605 | PAIP1 | P8T-E | Human | Esophagus | ESCC | 3.97e-55 | 1.08e+00 | 0.0889 |
| 10605 | PAIP1 | P9T-E | Human | Esophagus | ESCC | 5.29e-45 | 1.04e+00 | 0.1131 |
| 10605 | PAIP1 | P10T-E | Human | Esophagus | ESCC | 7.19e-84 | 1.61e+00 | 0.116 |
| 10605 | PAIP1 | P11T-E | Human | Esophagus | ESCC | 4.41e-18 | 9.05e-01 | 0.1426 |
| 10605 | PAIP1 | P12T-E | Human | Esophagus | ESCC | 4.71e-53 | 1.21e+00 | 0.1122 |
| 10605 | PAIP1 | P15T-E | Human | Esophagus | ESCC | 1.95e-42 | 8.99e-01 | 0.1149 |
| Page: 1 2 3 4 5 6 7 |
| Tissue | Expression Dynamics | Abbreviation |
| Esophagus | 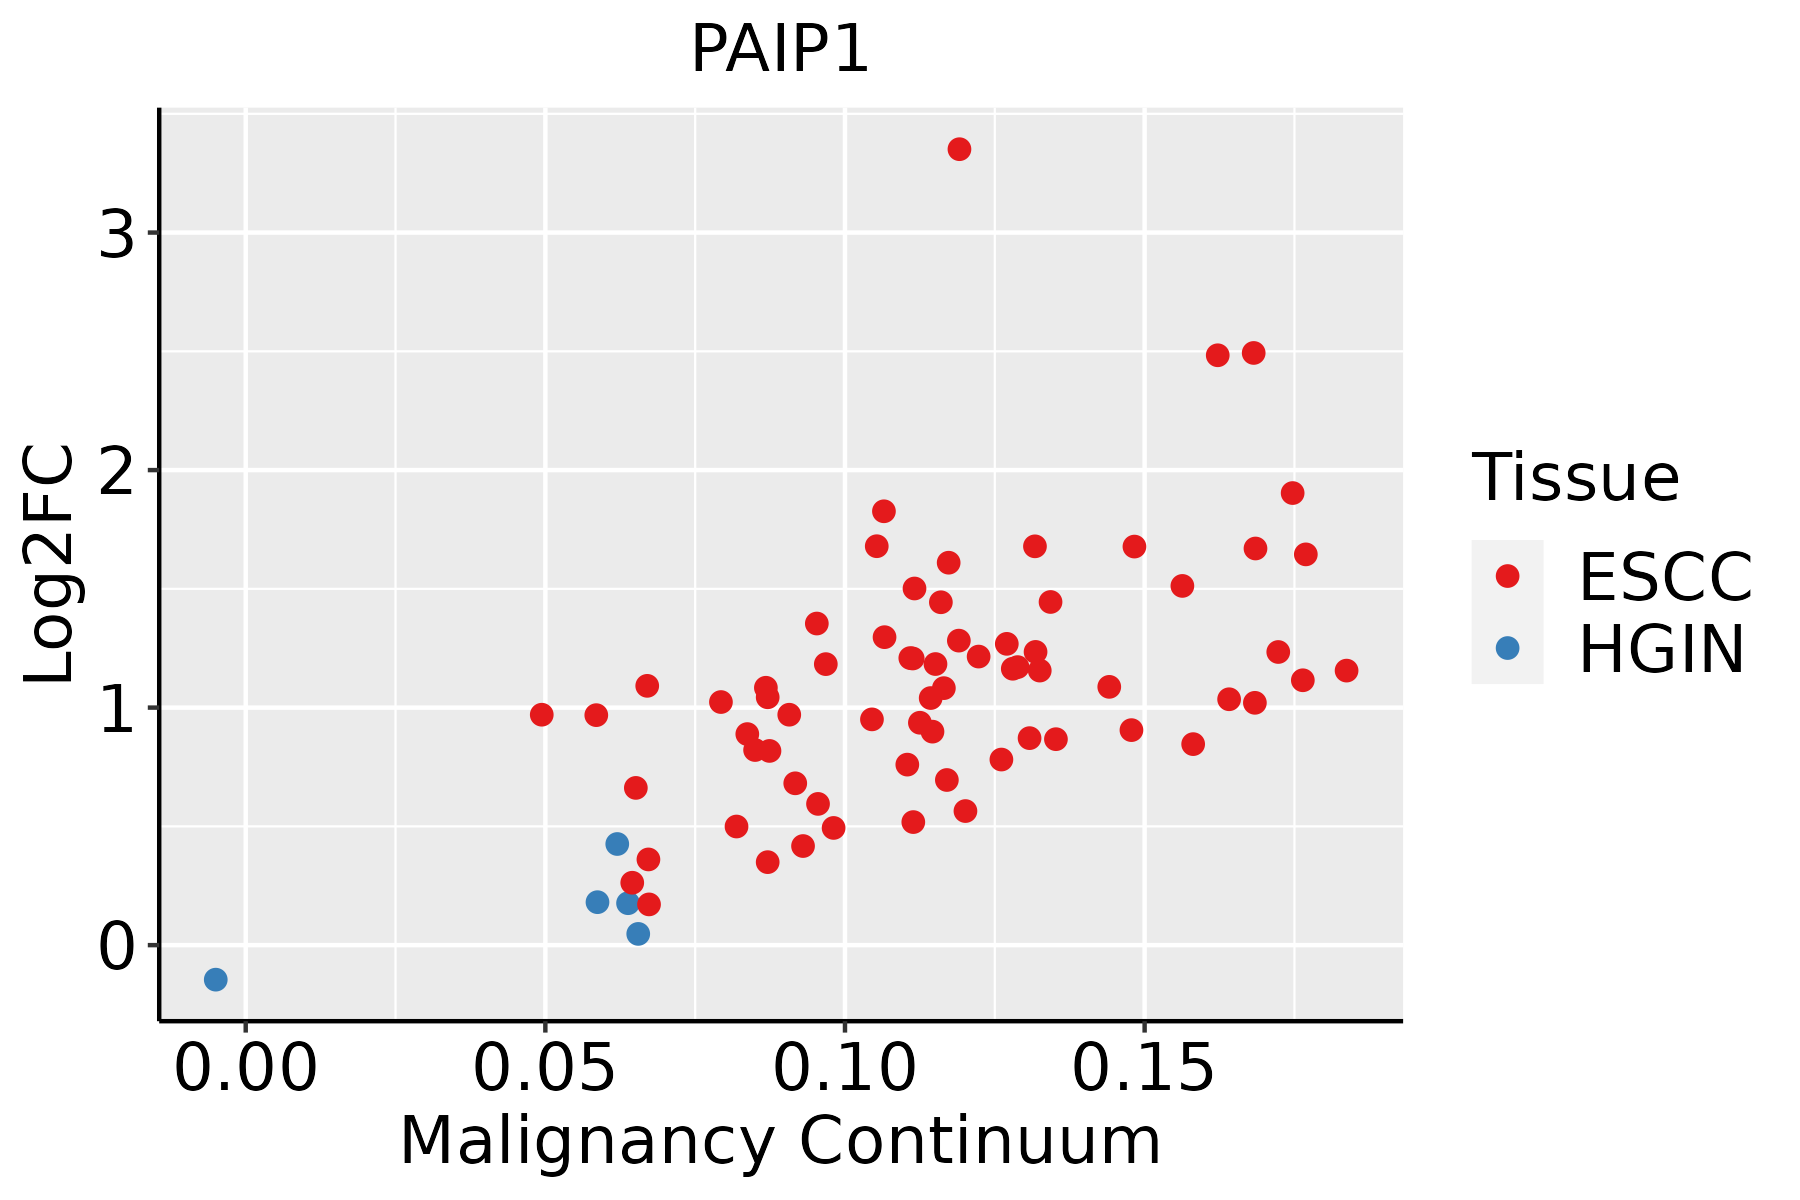 | ESCC: Esophageal squamous cell carcinoma |
| HGIN: High-grade intraepithelial neoplasias | ||
| LGIN: Low-grade intraepithelial neoplasias | ||
| Liver |  | HCC: Hepatocellular carcinoma |
| NAFLD: Non-alcoholic fatty liver disease | ||
| Oral Cavity | 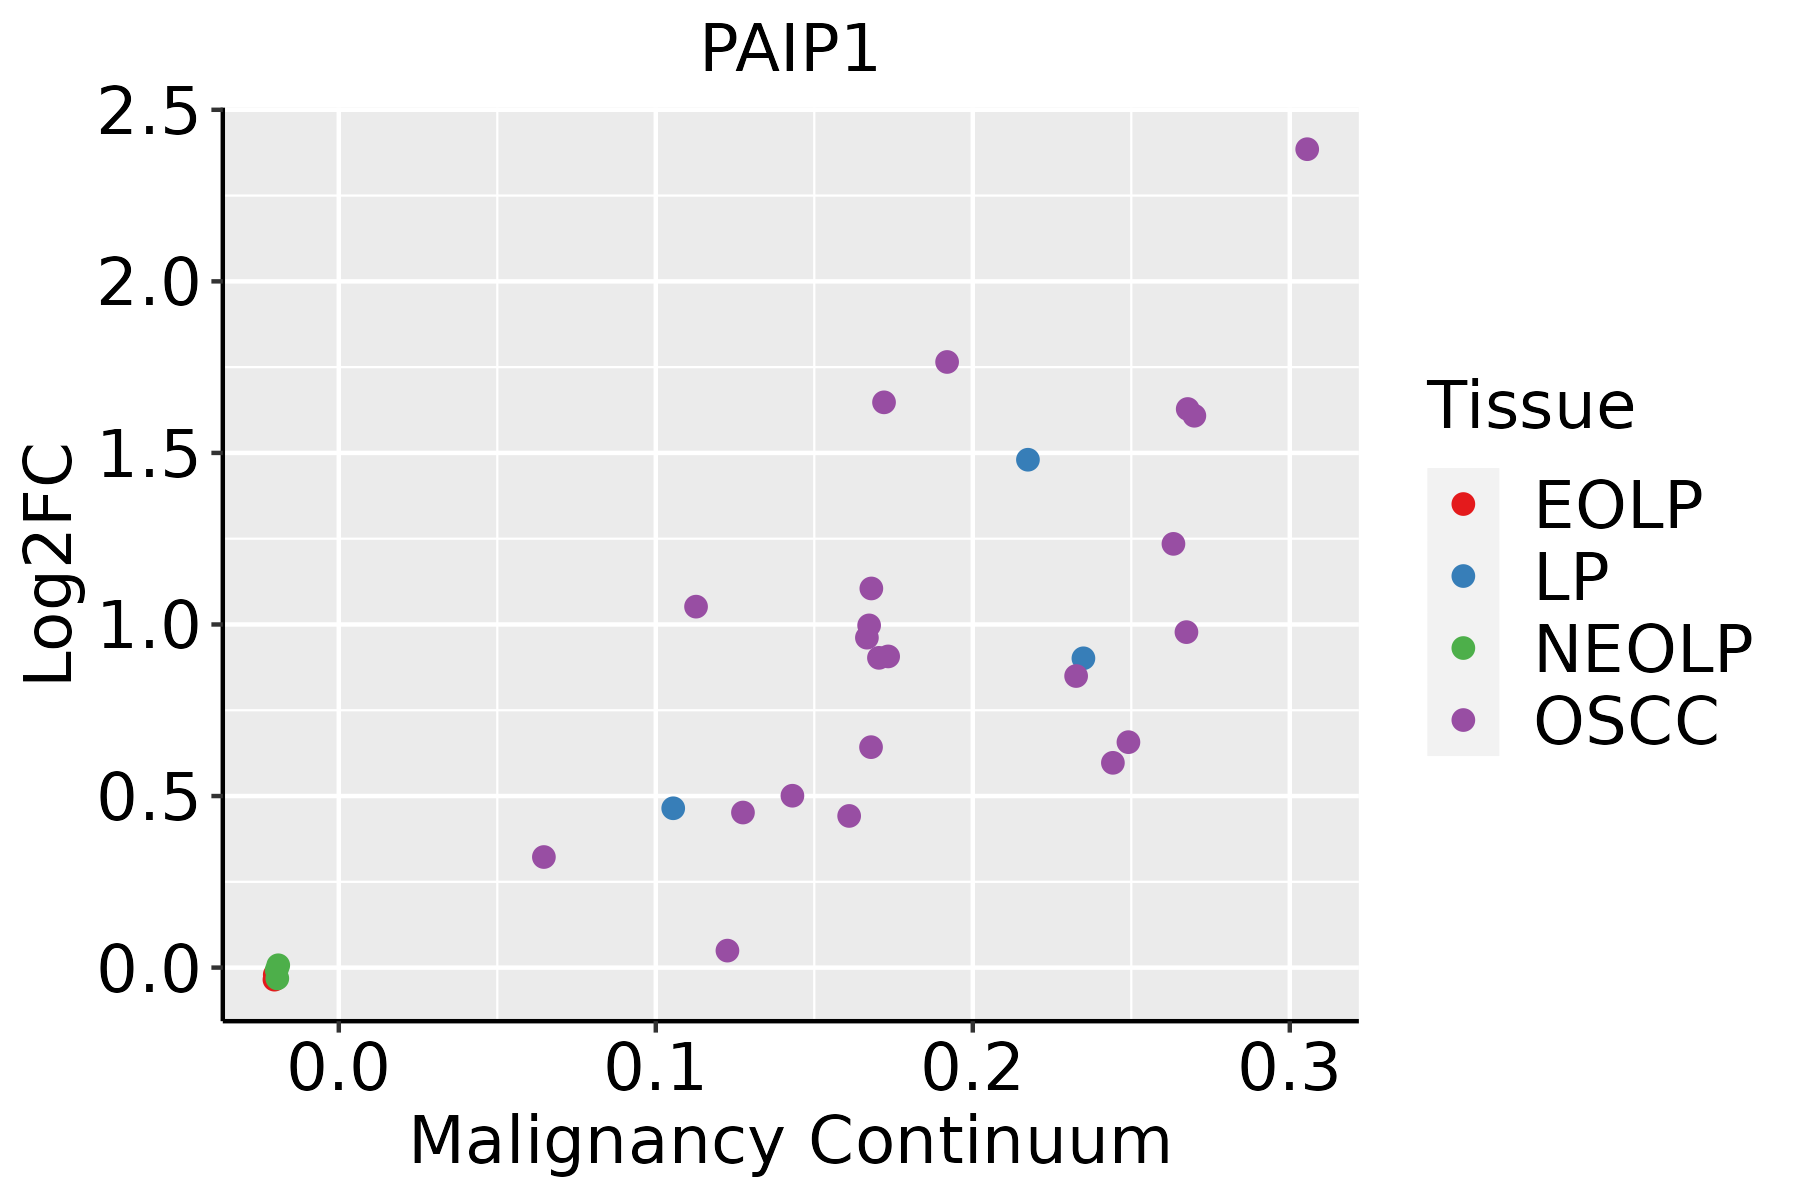 | EOLP: Erosive Oral lichen planus |
| LP: leukoplakia | ||
| NEOLP: Non-erosive oral lichen planus | ||
| OSCC: Oral squamous cell carcinoma | ||
| Skin | 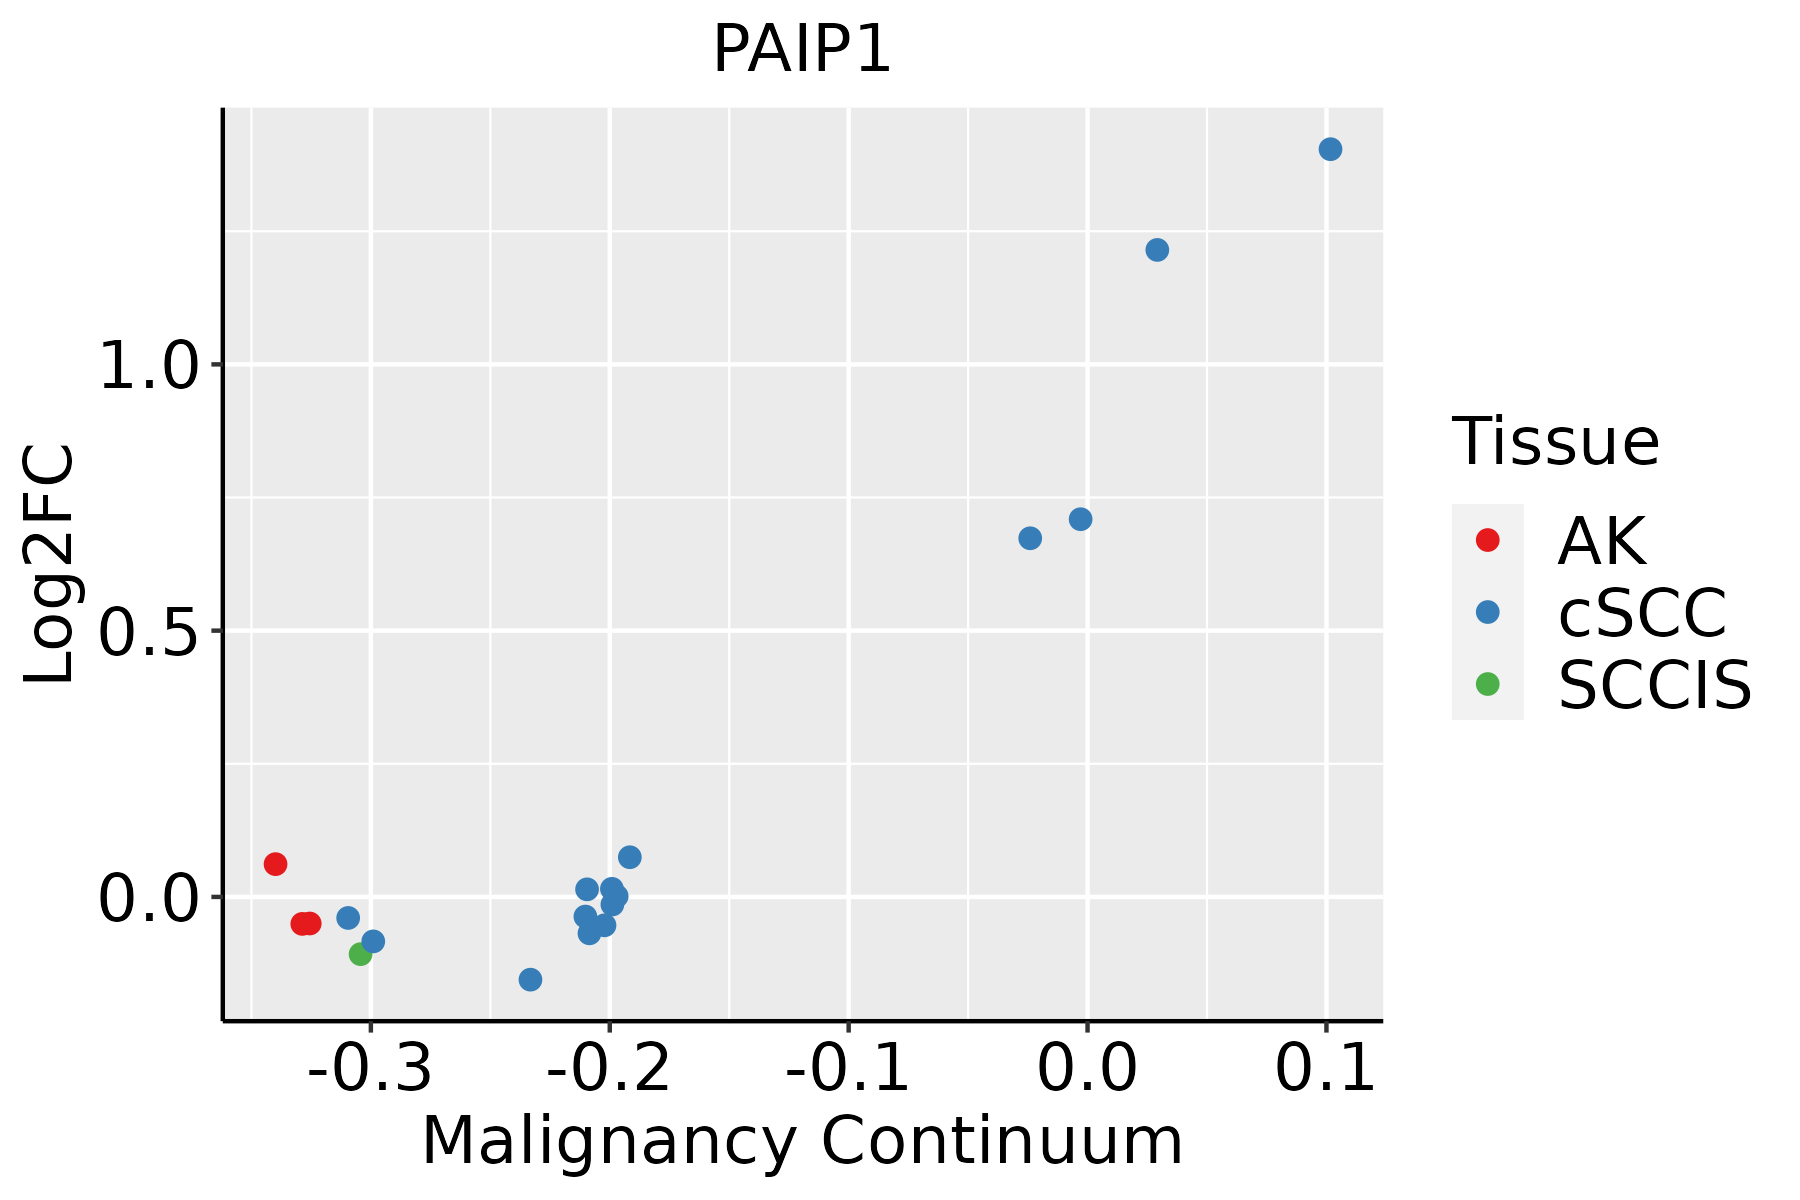 | AK: Actinic keratosis |
| cSCC: Cutaneous squamous cell carcinoma | ||
| SCCIS:squamous cell carcinoma in situ | ||
| Thyroid |  | ATC: Anaplastic thyroid cancer |
| HT: Hashimoto's thyroiditis | ||
| PTC: Papillary thyroid cancer |
| ∗log2FC in expression of this searched gene in stem-like cells from each diseased tissue sample relative to stem-like cells in normal samples in each tissue plotted against the malignancy continuum. Samples are colored based on if they are from different disease stage. |
Top |
Malignant transformation related pathway analysis |
| Find out the enriched GO biological processes and KEGG pathways involved in transition from healthy to precancer to cancer |
| Tissue | Disease Stage | Enriched GO biological Processes |
| Colorectum | AD |  |
| Colorectum | SER |  |
| Colorectum | MSS |  |
| Colorectum | MSI-H |  |
| Colorectum | FAP |  |
| ∗Top 15 enriched GO BP terms are showed in the bar plot of each disease state in each tissue. Each row represents a significant GO biological process which is colored according to the -log10(p.adjust). |
| Page: 1 2 3 4 5 6 7 8 9 |
| GO ID | Tissue | Disease Stage | Description | Gene Ratio | Bg Ratio | pvalue | p.adjust | Count |
| GO:1903311110 | Esophagus | ESCC | regulation of mRNA metabolic process | 210/8552 | 288/18723 | 3.25e-21 | 5.56e-19 | 210 |
| GO:0006401110 | Esophagus | ESCC | RNA catabolic process | 204/8552 | 278/18723 | 3.39e-21 | 5.66e-19 | 204 |
| GO:0006413110 | Esophagus | ESCC | translational initiation | 100/8552 | 118/18723 | 1.16e-18 | 1.25e-16 | 100 |
| GO:0034655110 | Esophagus | ESCC | nucleobase-containing compound catabolic process | 272/8552 | 407/18723 | 2.92e-18 | 2.90e-16 | 272 |
| GO:0006402110 | Esophagus | ESCC | mRNA catabolic process | 170/8552 | 232/18723 | 8.70e-18 | 8.00e-16 | 170 |
| GO:0006417111 | Esophagus | ESCC | regulation of translation | 304/8552 | 468/18723 | 1.53e-17 | 1.33e-15 | 304 |
| GO:004670018 | Esophagus | ESCC | heterocycle catabolic process | 286/8552 | 445/18723 | 1.12e-15 | 7.47e-14 | 286 |
| GO:0045727111 | Esophagus | ESCC | positive regulation of translation | 107/8552 | 136/18723 | 2.79e-15 | 1.68e-13 | 107 |
| GO:004427019 | Esophagus | ESCC | cellular nitrogen compound catabolic process | 288/8552 | 451/18723 | 3.03e-15 | 1.79e-13 | 288 |
| GO:0034250111 | Esophagus | ESCC | positive regulation of cellular amide metabolic process | 123/8552 | 162/18723 | 3.32e-15 | 1.93e-13 | 123 |
| GO:001943918 | Esophagus | ESCC | aromatic compound catabolic process | 295/8552 | 467/18723 | 1.09e-14 | 5.98e-13 | 295 |
| GO:190136118 | Esophagus | ESCC | organic cyclic compound catabolic process | 307/8552 | 495/18723 | 9.99e-14 | 4.80e-12 | 307 |
| GO:000644617 | Esophagus | ESCC | regulation of translational initiation | 65/8552 | 79/18723 | 2.04e-11 | 7.07e-10 | 65 |
| GO:0009895111 | Esophagus | ESCC | negative regulation of catabolic process | 201/8552 | 320/18723 | 3.88e-10 | 1.05e-08 | 201 |
| GO:006101319 | Esophagus | ESCC | regulation of mRNA catabolic process | 115/8552 | 166/18723 | 5.90e-10 | 1.49e-08 | 115 |
| GO:004348719 | Esophagus | ESCC | regulation of RNA stability | 117/8552 | 170/18723 | 7.91e-10 | 1.94e-08 | 117 |
| GO:004348819 | Esophagus | ESCC | regulation of mRNA stability | 109/8552 | 158/18723 | 2.40e-09 | 5.35e-08 | 109 |
| GO:0031330111 | Esophagus | ESCC | negative regulation of cellular catabolic process | 166/8552 | 262/18723 | 5.17e-09 | 1.08e-07 | 166 |
| GO:1903312111 | Esophagus | ESCC | negative regulation of mRNA metabolic process | 62/8552 | 92/18723 | 2.08e-05 | 1.80e-04 | 62 |
| GO:190236916 | Esophagus | ESCC | negative regulation of RNA catabolic process | 46/8552 | 75/18723 | 4.54e-03 | 1.78e-02 | 46 |
| Page: 1 2 3 4 5 6 7 8 9 10 |
| Pathway ID | Tissue | Disease Stage | Description | Gene Ratio | Bg Ratio | pvalue | p.adjust | qvalue | Count |
| Page: 1 |
Top |
Cell-cell communication analysis |
| Identification of potential cell-cell interactions between two cell types and their ligand-receptor pairs for different disease states |
| Ligand | Receptor | LRpair | Pathway | Tissue | Disease Stage |
| Page: 1 |
Top |
Single-cell gene regulatory network inference analysis |
| Find out the significant the regulons (TFs) and the target genes of each regulon across cell types for different disease states |
| TF | Cell Type | Tissue | Disease Stage | Target Gene | RSS | Regulon Activity |
| ∗The dot plots of a searched regulon are shown for all cell subpopulations in each disease state of each tissue based on the regulon specific score inferred using pySCENIC and by calculating the average expression. |
| Page: 1 |
Top |
Somatic mutation of malignant transformation related genes |
| Annotation of somatic variants for genes involved in malignant transformation |
| Hugo Symbol | Variant Class | Variant Classification | dbSNP RS | HGVSc | HGVSp | HGVSp Short | SWISSPROT | BIOTYPE | SIFT | PolyPhen | Tumor Sample Barcode | Tissue | Histology | Sex | Age | Stage | Therapy Types | Drugs | Outcome |
| PAIP1 | SNV | Missense_Mutation | novel | c.326N>T | p.Ser109Leu | p.S109L | Q9H074 | protein_coding | tolerated(0.37) | benign(0.062) | TCGA-OL-A6VQ-01 | Breast | breast invasive carcinoma | Female | <65 | I/II | Unknown | Unknown | SD |
| PAIP1 | SNV | Missense_Mutation | novel | c.1222N>A | p.Asp408Asn | p.D408N | Q9H074 | protein_coding | deleterious(0) | possibly_damaging(0.637) | TCGA-C5-A8XH-01 | Cervix | cervical & endocervical cancer | Female | <65 | I/II | Unknown | Unknown | SD |
| PAIP1 | SNV | Missense_Mutation | c.1420N>A | p.Glu474Lys | p.E474K | Q9H074 | protein_coding | deleterious(0) | possibly_damaging(0.681) | TCGA-EK-A3GK-01 | Cervix | cervical & endocervical cancer | Female | <65 | I/II | Unknown | Unknown | SD | |
| PAIP1 | SNV | Missense_Mutation | c.1005G>T | p.Lys335Asn | p.K335N | Q9H074 | protein_coding | deleterious(0.01) | possibly_damaging(0.895) | TCGA-AZ-6598-01 | Colorectum | colon adenocarcinoma | Female | >=65 | I/II | Unknown | Unknown | SD | |
| PAIP1 | SNV | Missense_Mutation | c.1381N>C | p.Glu461Gln | p.E461Q | Q9H074 | protein_coding | deleterious(0) | probably_damaging(0.991) | TCGA-CK-4950-01 | Colorectum | colon adenocarcinoma | Female | >=65 | III/IV | Chemotherapy | folfox | SD | |
| PAIP1 | SNV | Missense_Mutation | c.1263G>T | p.Glu421Asp | p.E421D | Q9H074 | protein_coding | tolerated(0.13) | benign(0.063) | TCGA-AG-A002-01 | Colorectum | rectum adenocarcinoma | Male | <65 | I/II | Unknown | Unknown | SD | |
| PAIP1 | SNV | Missense_Mutation | c.658C>T | p.Arg220Cys | p.R220C | Q9H074 | protein_coding | deleterious(0.01) | probably_damaging(1) | TCGA-AG-A002-01 | Colorectum | rectum adenocarcinoma | Male | <65 | I/II | Unknown | Unknown | SD | |
| PAIP1 | SNV | Missense_Mutation | novel | c.429T>G | p.Ser143Arg | p.S143R | Q9H074 | protein_coding | tolerated(0.28) | benign(0.005) | TCGA-AG-A002-01 | Colorectum | rectum adenocarcinoma | Male | <65 | I/II | Unknown | Unknown | SD |
| PAIP1 | SNV | Missense_Mutation | c.340N>C | p.Ala114Pro | p.A114P | Q9H074 | protein_coding | deleterious(0.02) | possibly_damaging(0.502) | TCGA-BM-6198-01 | Colorectum | rectum adenocarcinoma | Male | >=65 | III/IV | Chemotherapy | xeloda | SD | |
| PAIP1 | SNV | Missense_Mutation | novel | c.1034N>G | p.Ile345Ser | p.I345S | Q9H074 | protein_coding | deleterious(0) | benign(0.162) | TCGA-F5-6814-01 | Colorectum | rectum adenocarcinoma | Male | <65 | I/II | Unknown | Unknown | SD |
| Page: 1 2 3 4 5 |
Top |
Related drugs of malignant transformation related genes |
| Identification of chemicals and drugs interact with genes involved in malignant transfromation |
| (DGIdb 4.0) |
| Entrez ID | Symbol | Category | Interaction Types | Drug Claim Name | Drug Name | PMIDs |
| Page: 1 |

Copyright 2023-Present -The University of Texas Health Science Center at Houston |