
|
|||||
|
 | |
| |
| |
| |
| |
| |
|
Gene: PAICS |
Gene summary for PAICS |
| Gene information | Species | Human | Gene symbol | PAICS | Gene ID | 10606 |
| Gene name | phosphoribosylaminoimidazole carboxylase and phosphoribosylaminoimidazolesuccinocarboxamide synthase | |
| Gene Alias | ADE2 | |
| Cytomap | 4q12 | |
| Gene Type | protein-coding | GO ID | GO:0006139 | UniProtAcc | A0A024RD93 |
Top |
Malignant transformation analysis |
| Identification of the aberrant gene expression in precancerous and cancerous lesions by comparing the gene expression of stem-like cells in diseased tissues with normal stem cells |
| Entrez ID | Symbol | Replicates | Species | Organ | Tissue | Adj P-value | Log2FC | Malignancy |
| 10606 | PAICS | HTA11_7696_3000711011 | Human | Colorectum | AD | 1.96e-03 | 3.09e-01 | 0.0674 |
| 10606 | PAICS | HTA11_99999970781_79442 | Human | Colorectum | MSS | 2.84e-23 | 8.14e-01 | 0.294 |
| 10606 | PAICS | HTA11_99999965062_69753 | Human | Colorectum | MSI-H | 6.18e-03 | 1.21e+00 | 0.3487 |
| 10606 | PAICS | HTA11_99999965104_69814 | Human | Colorectum | MSS | 3.23e-03 | 5.33e-01 | 0.281 |
| 10606 | PAICS | HTA11_99999971662_82457 | Human | Colorectum | MSS | 8.72e-29 | 9.31e-01 | 0.3859 |
| 10606 | PAICS | A015-C-203 | Human | Colorectum | FAP | 3.12e-04 | -2.11e-01 | -0.1294 |
| 10606 | PAICS | A015-C-204 | Human | Colorectum | FAP | 9.52e-03 | -1.82e-01 | -0.0228 |
| 10606 | PAICS | A002-C-201 | Human | Colorectum | FAP | 7.39e-04 | -1.65e-01 | 0.0324 |
| 10606 | PAICS | A002-C-205 | Human | Colorectum | FAP | 6.74e-05 | -1.31e-01 | -0.1236 |
| 10606 | PAICS | A015-C-006 | Human | Colorectum | FAP | 5.45e-03 | -1.57e-01 | -0.0994 |
| 10606 | PAICS | A002-C-114 | Human | Colorectum | FAP | 1.29e-08 | -2.82e-01 | -0.1561 |
| 10606 | PAICS | A015-C-104 | Human | Colorectum | FAP | 2.10e-03 | -1.81e-01 | -0.1899 |
| 10606 | PAICS | A002-C-016 | Human | Colorectum | FAP | 2.45e-02 | -1.92e-01 | 0.0521 |
| 10606 | PAICS | A002-C-116 | Human | Colorectum | FAP | 2.89e-04 | -1.89e-01 | -0.0452 |
| 10606 | PAICS | A018-E-020 | Human | Colorectum | FAP | 5.13e-06 | -1.86e-01 | -0.2034 |
| 10606 | PAICS | LZE2T | Human | Esophagus | ESCC | 5.75e-03 | 8.72e-01 | 0.082 |
| 10606 | PAICS | LZE3D | Human | Esophagus | HGIN | 1.37e-03 | 3.58e-01 | 0.0668 |
| 10606 | PAICS | LZE4T | Human | Esophagus | ESCC | 5.63e-07 | 5.50e-01 | 0.0811 |
| 10606 | PAICS | LZE7T | Human | Esophagus | ESCC | 7.10e-05 | 6.64e-01 | 0.0667 |
| 10606 | PAICS | LZE24T | Human | Esophagus | ESCC | 3.50e-08 | 1.82e-01 | 0.0596 |
| Page: 1 2 3 4 5 6 7 |
| Tissue | Expression Dynamics | Abbreviation |
| Colorectum (GSE201348) |  | FAP: Familial adenomatous polyposis |
| CRC: Colorectal cancer | ||
| Colorectum (HTA11) |  | AD: Adenomas |
| SER: Sessile serrated lesions | ||
| MSI-H: Microsatellite-high colorectal cancer | ||
| MSS: Microsatellite stable colorectal cancer | ||
| Esophagus | 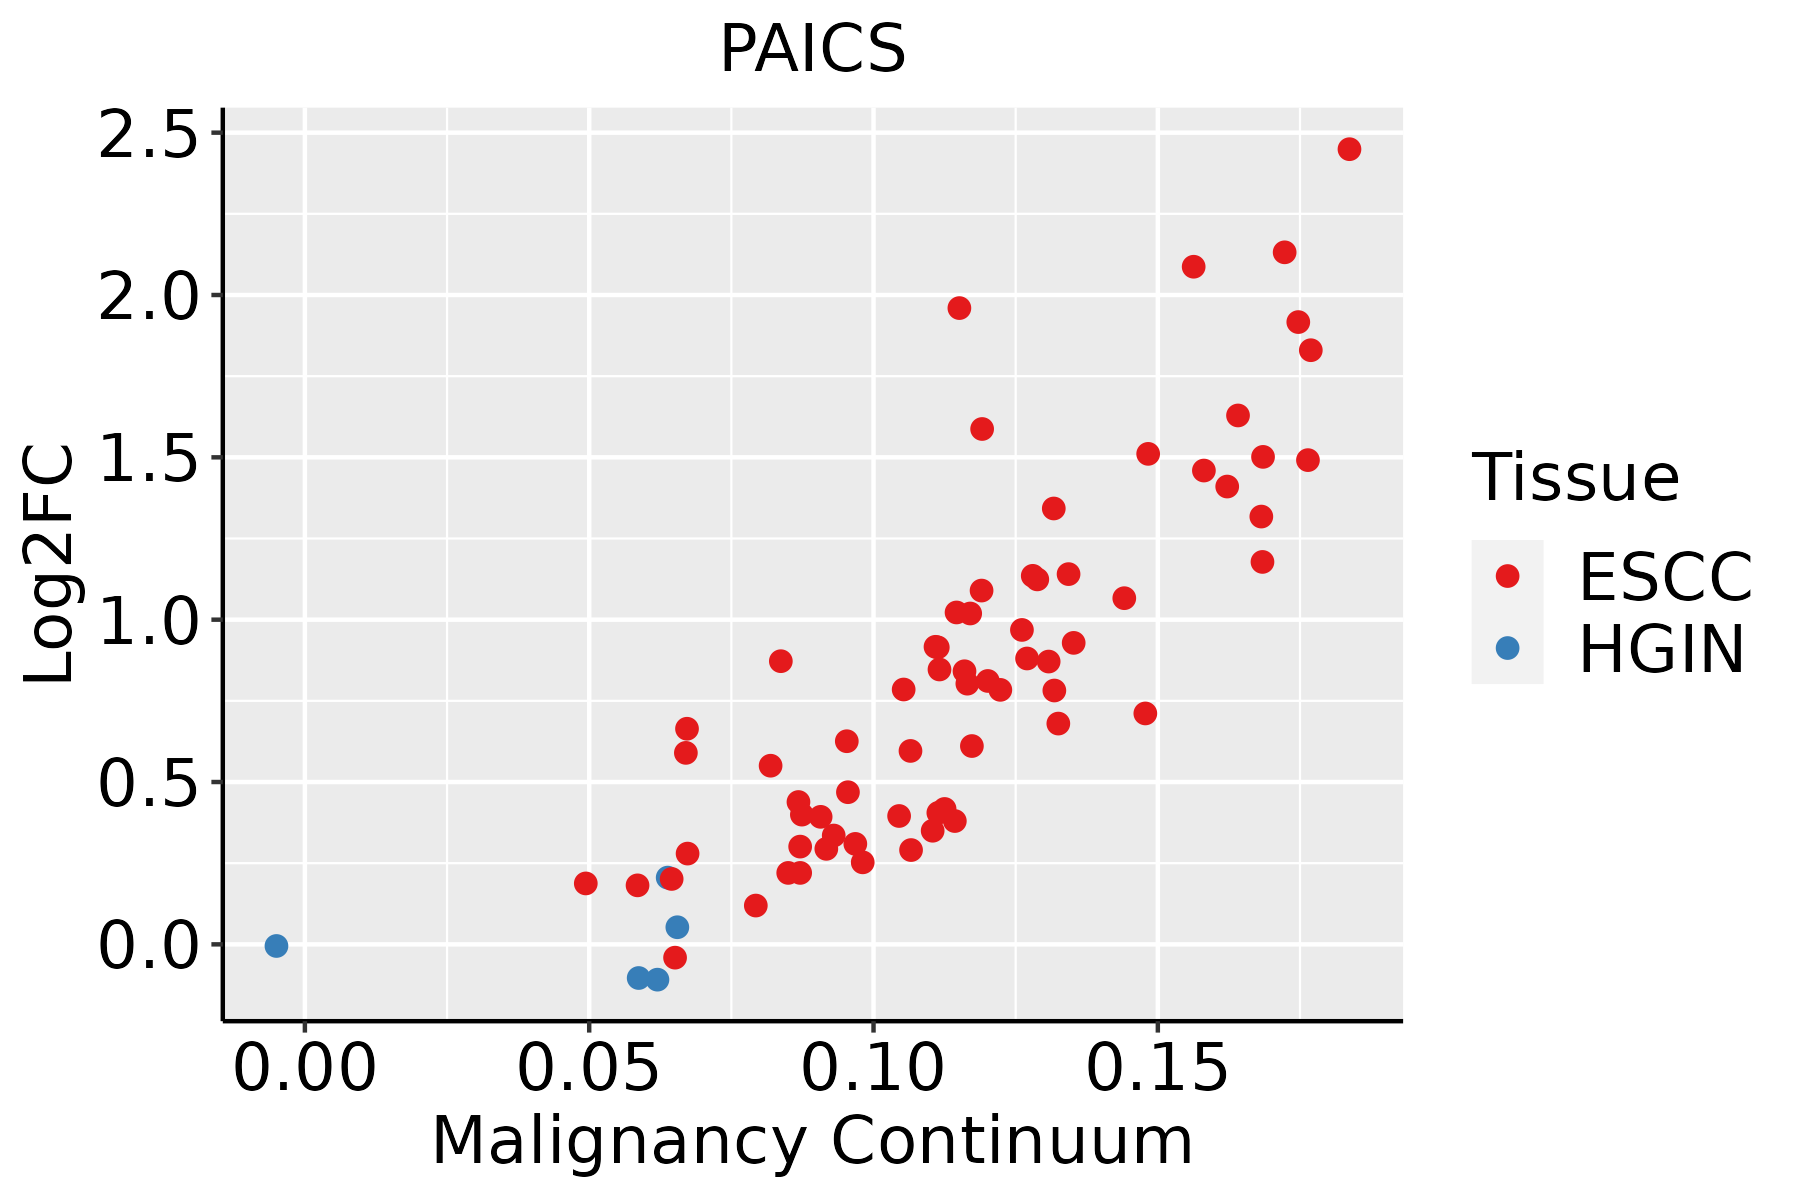 | ESCC: Esophageal squamous cell carcinoma |
| HGIN: High-grade intraepithelial neoplasias | ||
| LGIN: Low-grade intraepithelial neoplasias | ||
| Liver |  | HCC: Hepatocellular carcinoma |
| NAFLD: Non-alcoholic fatty liver disease | ||
| Oral Cavity | 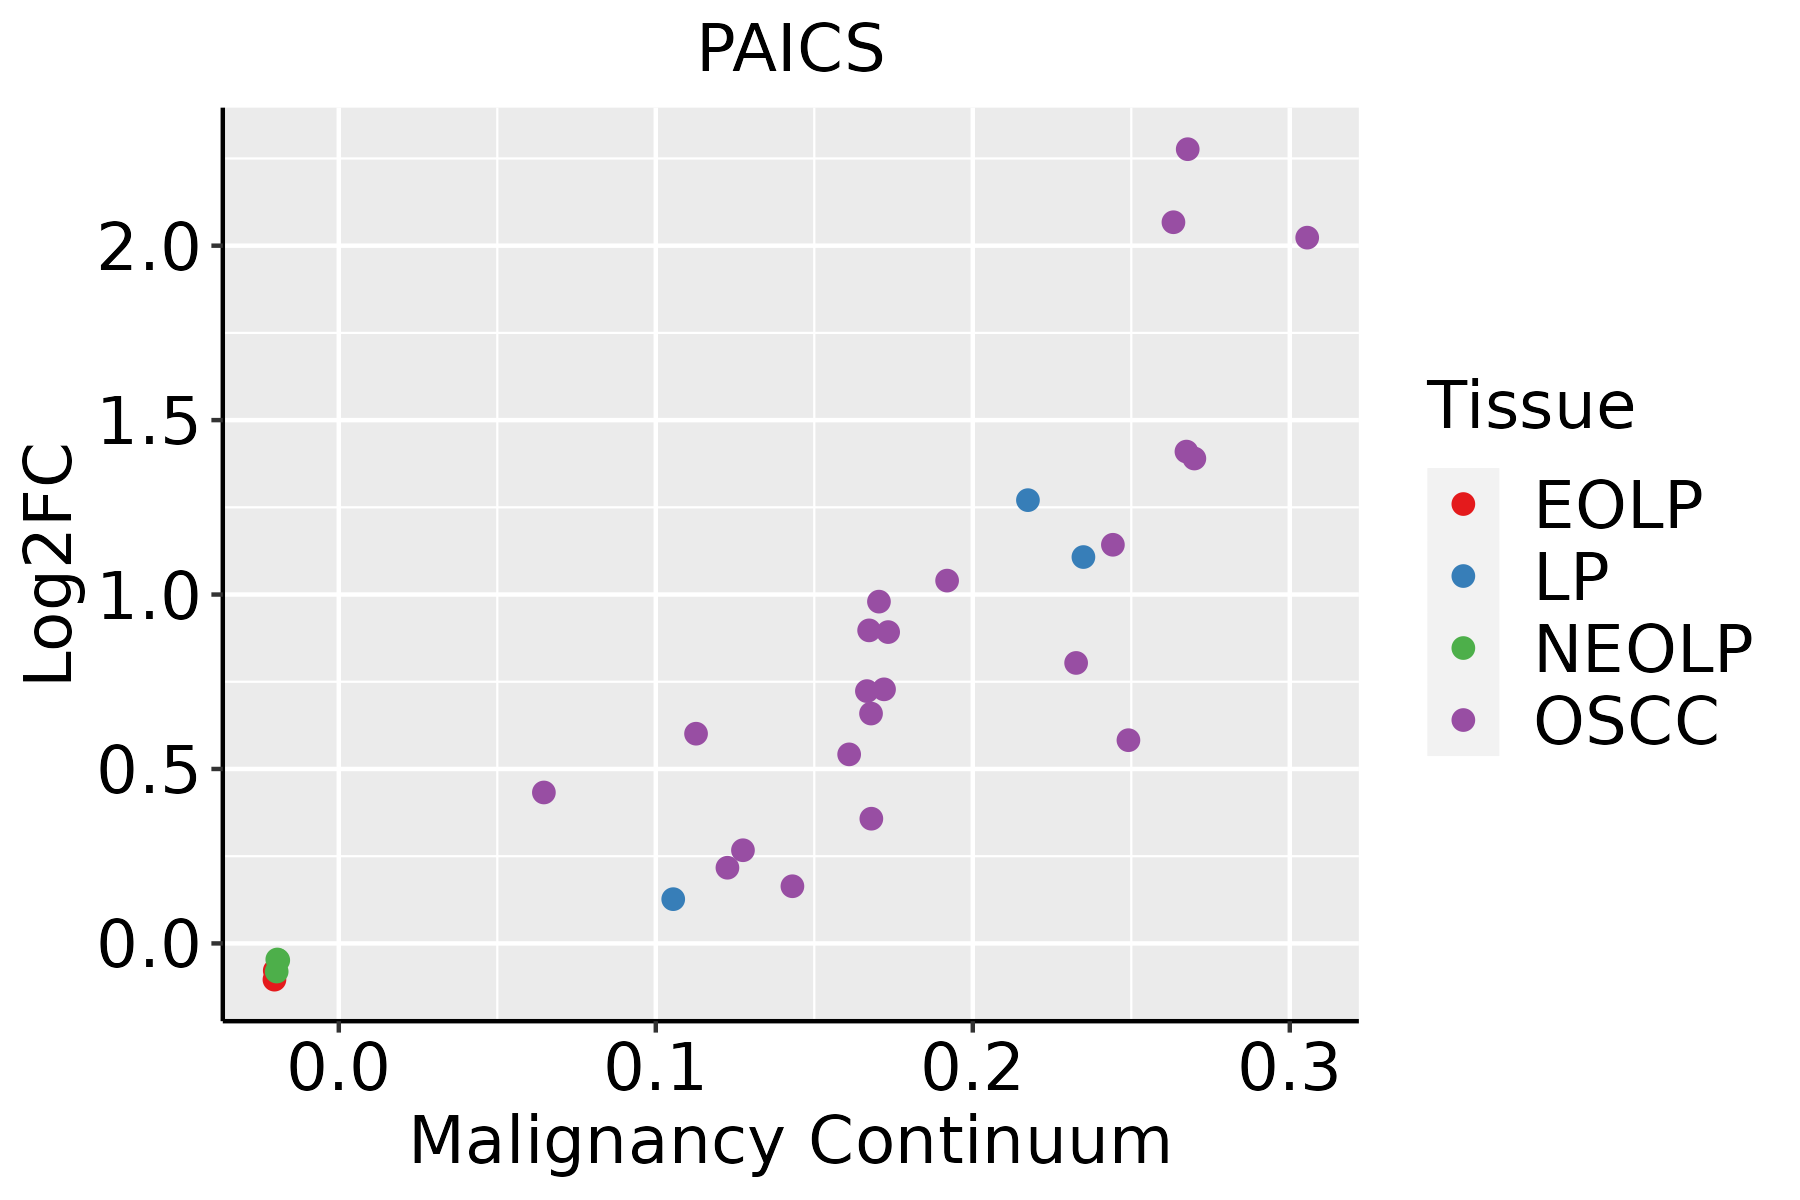 | EOLP: Erosive Oral lichen planus |
| LP: leukoplakia | ||
| NEOLP: Non-erosive oral lichen planus | ||
| OSCC: Oral squamous cell carcinoma | ||
| Skin |  | AK: Actinic keratosis |
| cSCC: Cutaneous squamous cell carcinoma | ||
| SCCIS:squamous cell carcinoma in situ | ||
| Thyroid | 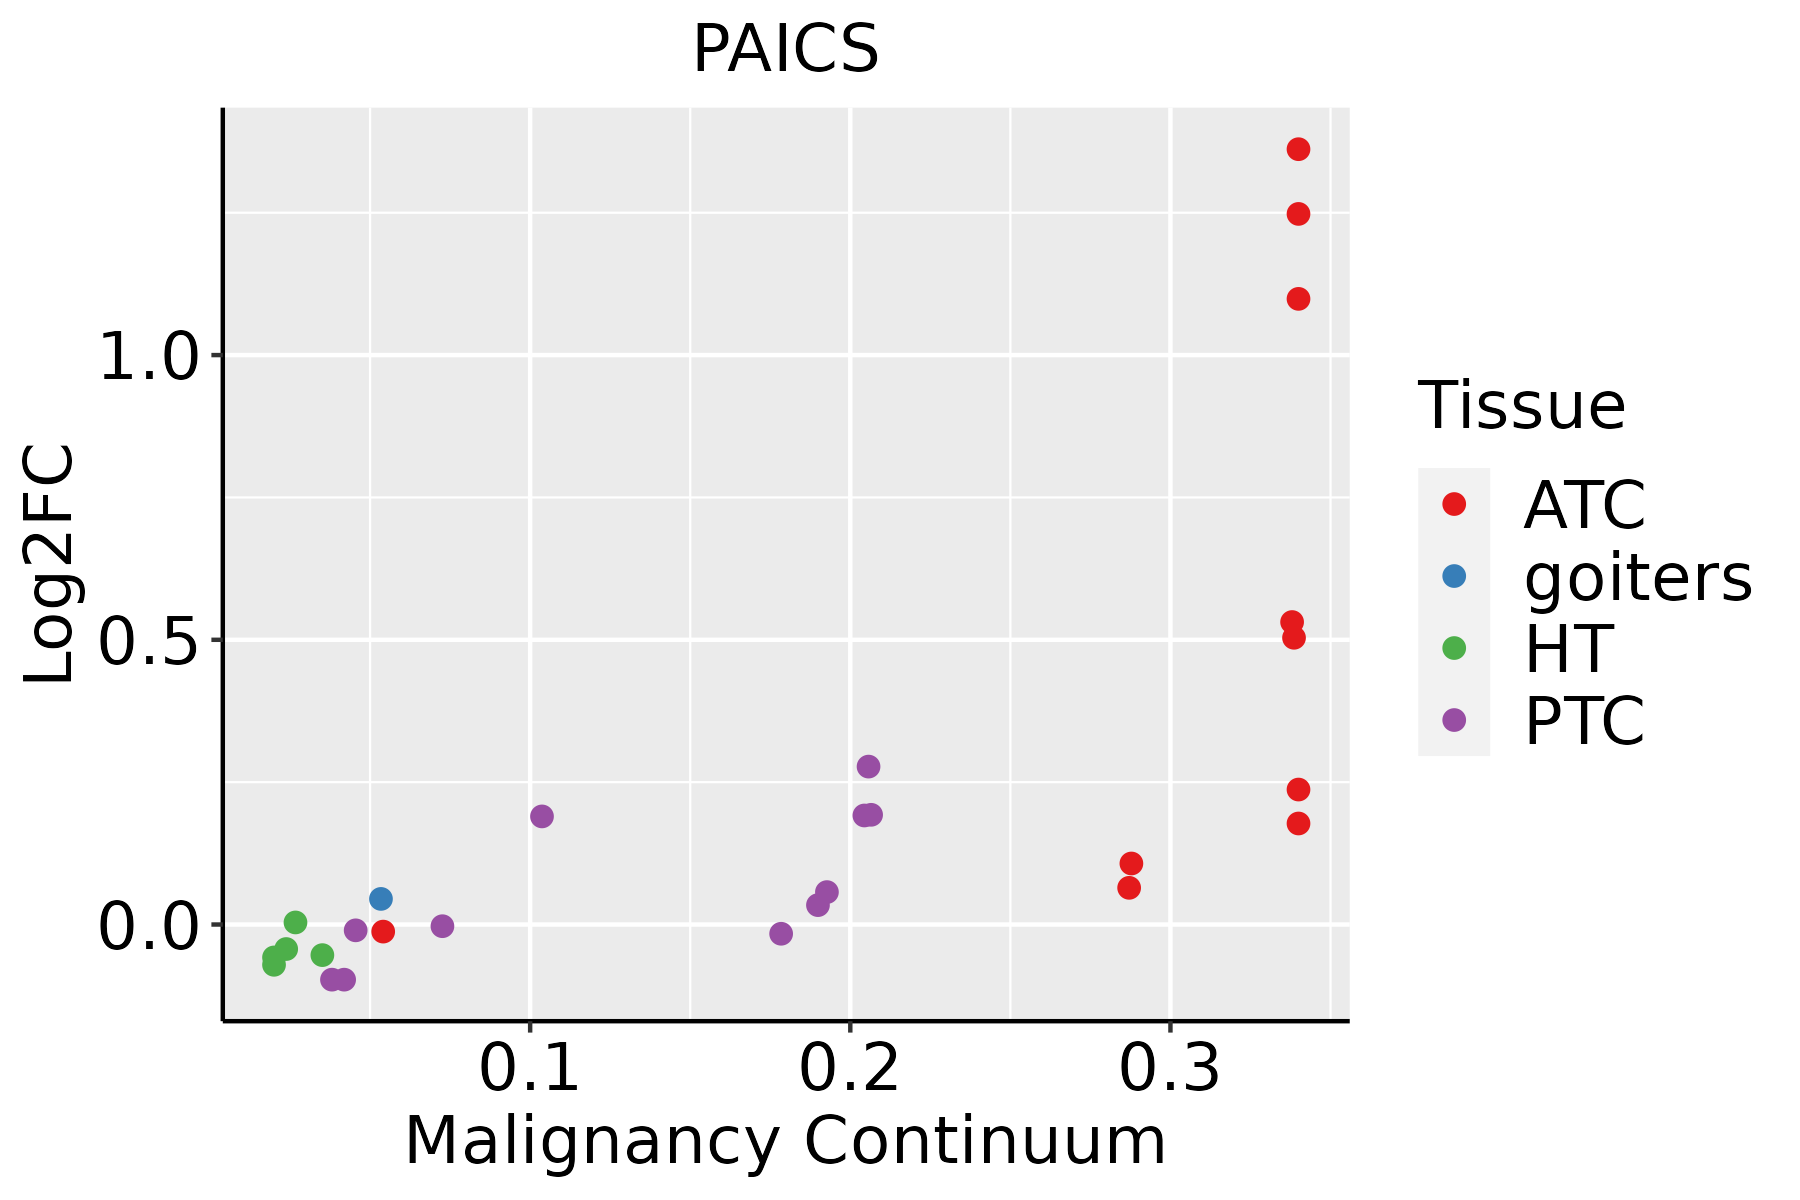 | ATC: Anaplastic thyroid cancer |
| HT: Hashimoto's thyroiditis | ||
| PTC: Papillary thyroid cancer |
| ∗log2FC in expression of this searched gene in stem-like cells from each diseased tissue sample relative to stem-like cells in normal samples in each tissue plotted against the malignancy continuum. Samples are colored based on if they are from different disease stage. |
Top |
Malignant transformation related pathway analysis |
| Find out the enriched GO biological processes and KEGG pathways involved in transition from healthy to precancer to cancer |
| Tissue | Disease Stage | Enriched GO biological Processes |
| Colorectum | AD |  |
| Colorectum | SER |  |
| Colorectum | MSS |  |
| Colorectum | MSI-H |  |
| Colorectum | FAP |  |
| ∗Top 15 enriched GO BP terms are showed in the bar plot of each disease state in each tissue. Each row represents a significant GO biological process which is colored according to the -log10(p.adjust). |
| Page: 1 2 3 4 5 6 7 8 9 |
| GO ID | Tissue | Disease Stage | Description | Gene Ratio | Bg Ratio | pvalue | p.adjust | Count |
| GO:0009150 | Colorectum | AD | purine ribonucleotide metabolic process | 142/3918 | 368/18723 | 4.29e-15 | 1.17e-12 | 142 |
| GO:0006163 | Colorectum | AD | purine nucleotide metabolic process | 149/3918 | 396/18723 | 1.08e-14 | 2.80e-12 | 149 |
| GO:0072521 | Colorectum | AD | purine-containing compound metabolic process | 153/3918 | 416/18723 | 4.34e-14 | 1.01e-11 | 153 |
| GO:0009259 | Colorectum | AD | ribonucleotide metabolic process | 144/3918 | 385/18723 | 5.25e-14 | 1.13e-11 | 144 |
| GO:0019693 | Colorectum | AD | ribose phosphate metabolic process | 145/3918 | 396/18723 | 3.01e-13 | 5.71e-11 | 145 |
| GO:0009117 | Colorectum | AD | nucleotide metabolic process | 168/3918 | 489/18723 | 2.20e-12 | 3.36e-10 | 168 |
| GO:0006753 | Colorectum | AD | nucleoside phosphate metabolic process | 169/3918 | 497/18723 | 4.99e-12 | 6.98e-10 | 169 |
| GO:0009152 | Colorectum | AD | purine ribonucleotide biosynthetic process | 64/3918 | 169/18723 | 3.09e-07 | 1.22e-05 | 64 |
| GO:0009260 | Colorectum | AD | ribonucleotide biosynthetic process | 66/3918 | 182/18723 | 1.25e-06 | 4.02e-05 | 66 |
| GO:0046390 | Colorectum | AD | ribose phosphate biosynthetic process | 67/3918 | 190/18723 | 3.21e-06 | 9.05e-05 | 67 |
| GO:0006164 | Colorectum | AD | purine nucleotide biosynthetic process | 66/3918 | 191/18723 | 8.22e-06 | 1.97e-04 | 66 |
| GO:0072522 | Colorectum | AD | purine-containing compound biosynthetic process | 68/3918 | 200/18723 | 1.12e-05 | 2.55e-04 | 68 |
| GO:1901293 | Colorectum | AD | nucleoside phosphate biosynthetic process | 80/3918 | 256/18723 | 6.31e-05 | 1.05e-03 | 80 |
| GO:0009165 | Colorectum | AD | nucleotide biosynthetic process | 79/3918 | 254/18723 | 8.33e-05 | 1.30e-03 | 79 |
| GO:0009126 | Colorectum | AD | purine nucleoside monophosphate metabolic process | 19/3918 | 44/18723 | 7.13e-04 | 7.21e-03 | 19 |
| GO:0009167 | Colorectum | AD | purine ribonucleoside monophosphate metabolic process | 18/3918 | 41/18723 | 7.71e-04 | 7.73e-03 | 18 |
| GO:00061632 | Colorectum | MSS | purine nucleotide metabolic process | 128/3467 | 396/18723 | 2.04e-11 | 3.02e-09 | 128 |
| GO:00091502 | Colorectum | MSS | purine ribonucleotide metabolic process | 121/3467 | 368/18723 | 2.08e-11 | 3.02e-09 | 121 |
| GO:00725212 | Colorectum | MSS | purine-containing compound metabolic process | 132/3467 | 416/18723 | 4.13e-11 | 4.86e-09 | 132 |
| GO:00092592 | Colorectum | MSS | ribonucleotide metabolic process | 123/3467 | 385/18723 | 1.17e-10 | 1.20e-08 | 123 |
| Page: 1 2 3 4 5 6 7 8 9 10 11 12 13 |
| Pathway ID | Tissue | Disease Stage | Description | Gene Ratio | Bg Ratio | pvalue | p.adjust | qvalue | Count |
| Page: 1 |
Top |
Cell-cell communication analysis |
| Identification of potential cell-cell interactions between two cell types and their ligand-receptor pairs for different disease states |
| Ligand | Receptor | LRpair | Pathway | Tissue | Disease Stage |
| Page: 1 |
Top |
Single-cell gene regulatory network inference analysis |
| Find out the significant the regulons (TFs) and the target genes of each regulon across cell types for different disease states |
| TF | Cell Type | Tissue | Disease Stage | Target Gene | RSS | Regulon Activity |
| ∗The dot plots of a searched regulon are shown for all cell subpopulations in each disease state of each tissue based on the regulon specific score inferred using pySCENIC and by calculating the average expression. |
| Page: 1 |
Top |
Somatic mutation of malignant transformation related genes |
| Annotation of somatic variants for genes involved in malignant transformation |
| Hugo Symbol | Variant Class | Variant Classification | dbSNP RS | HGVSc | HGVSp | HGVSp Short | SWISSPROT | BIOTYPE | SIFT | PolyPhen | Tumor Sample Barcode | Tissue | Histology | Sex | Age | Stage | Therapy Types | Drugs | Outcome |
| PAICS | SNV | Missense_Mutation | novel | c.541N>C | p.Glu181Gln | p.E181Q | P22234 | protein_coding | benign(0.381) | TCGA-BH-A0B6-01 | Breast | breast invasive carcinoma | Female | <65 | I/II | Unknown | Unknown | SD | |
| PAICS | SNV | Missense_Mutation | c.610G>C | p.Asp204His | p.D204H | P22234 | protein_coding | possibly_damaging(0.885) | TCGA-BH-A0DZ-01 | Breast | breast invasive carcinoma | Female | <65 | I/II | Chemotherapy | docetaxel | SD | ||
| PAICS | SNV | Missense_Mutation | novel | c.1012A>G | p.Arg338Gly | p.R338G | P22234 | protein_coding | benign(0.262) | TCGA-E2-A1L8-01 | Breast | breast invasive carcinoma | Female | <65 | I/II | Chemotherapy | cyclophosphamide | SD | |
| PAICS | SNV | Missense_Mutation | c.326N>A | p.Arg109Lys | p.R109K | P22234 | protein_coding | benign(0.162) | TCGA-IR-A3LA-01 | Cervix | cervical & endocervical cancer | Female | <65 | I/II | Chemotherapy | cisplatin | CR | ||
| PAICS | SNV | Missense_Mutation | c.898N>G | p.Ile300Val | p.I300V | P22234 | protein_coding | benign(0.003) | TCGA-A6-6653-01 | Colorectum | colon adenocarcinoma | Male | >=65 | I/II | Unknown | Unknown | SD | ||
| PAICS | SNV | Missense_Mutation | rs773166026 | c.67N>A | p.Glu23Lys | p.E23K | P22234 | protein_coding | benign(0.101) | TCGA-CA-6717-01 | Colorectum | colon adenocarcinoma | Male | <65 | I/II | Chemotherapy | oxaliplatin | CR | |
| PAICS | SNV | Missense_Mutation | c.535N>G | p.Ile179Val | p.I179V | P22234 | protein_coding | benign(0.001) | TCGA-G4-6588-01 | Colorectum | colon adenocarcinoma | Female | <65 | I/II | Unknown | Unknown | SD | ||
| PAICS | SNV | Missense_Mutation | c.869A>C | p.Lys290Thr | p.K290T | P22234 | protein_coding | benign(0.183) | TCGA-AG-A00Y-01 | Colorectum | rectum adenocarcinoma | Male | >=65 | I/II | Unknown | Unknown | PD | ||
| PAICS | SNV | Missense_Mutation | novel | c.380A>G | p.Lys127Arg | p.K127R | P22234 | protein_coding | benign(0) | TCGA-AJ-A3BG-01 | Endometrium | uterine corpus endometrioid carcinoma | Female | >=65 | I/II | Chemotherapy | carboplatin | PD | |
| PAICS | SNV | Missense_Mutation | rs761243513 | c.686N>A | p.Arg229Gln | p.R229Q | P22234 | protein_coding | benign(0.102) | TCGA-AP-A056-01 | Endometrium | uterine corpus endometrioid carcinoma | Female | <65 | I/II | Unknown | Unknown | SD |
| Page: 1 2 3 |
Top |
Related drugs of malignant transformation related genes |
| Identification of chemicals and drugs interact with genes involved in malignant transfromation |
| (DGIdb 4.0) |
| Entrez ID | Symbol | Category | Interaction Types | Drug Claim Name | Drug Name | PMIDs |
| Page: 1 |

Copyright 2023-Present -The University of Texas Health Science Center at Houston |