
|
|||||
|
 | |
| |
| |
| |
| |
| |
|
Gene: PAH |
Gene summary for PAH |
| Gene information | Species | Human | Gene symbol | PAH | Gene ID | 5053 |
| Gene name | phenylalanine hydroxylase | |
| Gene Alias | PH | |
| Cytomap | 12q23.2 | |
| Gene Type | protein-coding | GO ID | GO:0001505 | UniProtAcc | A0A024RBG4 |
Top |
Malignant transformation analysis |
| Identification of the aberrant gene expression in precancerous and cancerous lesions by comparing the gene expression of stem-like cells in diseased tissues with normal stem cells |
| Entrez ID | Symbol | Replicates | Species | Organ | Tissue | Adj P-value | Log2FC | Malignancy |
| 5053 | PAH | NAFLD1 | Human | Liver | NAFLD | 2.05e-06 | 8.47e-01 | -0.04 |
| 5053 | PAH | S41 | Human | Liver | Cirrhotic | 1.72e-07 | 4.84e-01 | -0.0343 |
| 5053 | PAH | S43 | Human | Liver | Cirrhotic | 2.04e-17 | -5.04e-01 | -0.0187 |
| 5053 | PAH | S44 | Human | Liver | HCC | 4.64e-06 | 5.20e-01 | -0.0083 |
| 5053 | PAH | HCC1_Meng | Human | Liver | HCC | 3.01e-102 | -2.05e-01 | 0.0246 |
| 5053 | PAH | HCC2_Meng | Human | Liver | HCC | 1.68e-29 | -8.26e-01 | 0.0107 |
| 5053 | PAH | cirrhotic1 | Human | Liver | Cirrhotic | 2.31e-19 | -3.31e-01 | 0.0202 |
| 5053 | PAH | cirrhotic2 | Human | Liver | Cirrhotic | 1.50e-23 | 2.79e-02 | 0.0201 |
| 5053 | PAH | cirrhotic3 | Human | Liver | Cirrhotic | 9.08e-09 | -4.89e-01 | 0.0215 |
| 5053 | PAH | p6 | Human | Liver | Cyst | 1.10e-04 | -8.42e-01 | -0.0218 |
| 5053 | PAH | HCC1 | Human | Liver | HCC | 1.29e-26 | 5.67e+00 | 0.5336 |
| 5053 | PAH | HCC2 | Human | Liver | HCC | 1.46e-33 | 5.49e+00 | 0.5341 |
| 5053 | PAH | HCC5 | Human | Liver | HCC | 2.16e-04 | 2.08e+00 | 0.4932 |
| 5053 | PAH | Pt13.a | Human | Liver | HCC | 5.29e-15 | -4.97e-01 | 0.021 |
| 5053 | PAH | Pt13.b | Human | Liver | HCC | 2.07e-25 | -4.34e-01 | 0.0251 |
| 5053 | PAH | Pt13.c | Human | Liver | HCC | 1.03e-10 | -7.89e-01 | 0.0076 |
| 5053 | PAH | Pt14.a | Human | Liver | HCC | 4.92e-04 | 1.23e-01 | 0.0169 |
| 5053 | PAH | Pt14.b | Human | Liver | HCC | 9.58e-07 | 9.68e-02 | 0.018 |
| 5053 | PAH | Pt14.d | Human | Liver | HCC | 4.64e-10 | -3.06e-01 | 0.0143 |
| 5053 | PAH | S028 | Human | Liver | HCC | 2.18e-10 | 9.36e-01 | 0.2503 |
| Page: 1 2 |
| Tissue | Expression Dynamics | Abbreviation |
| Liver | 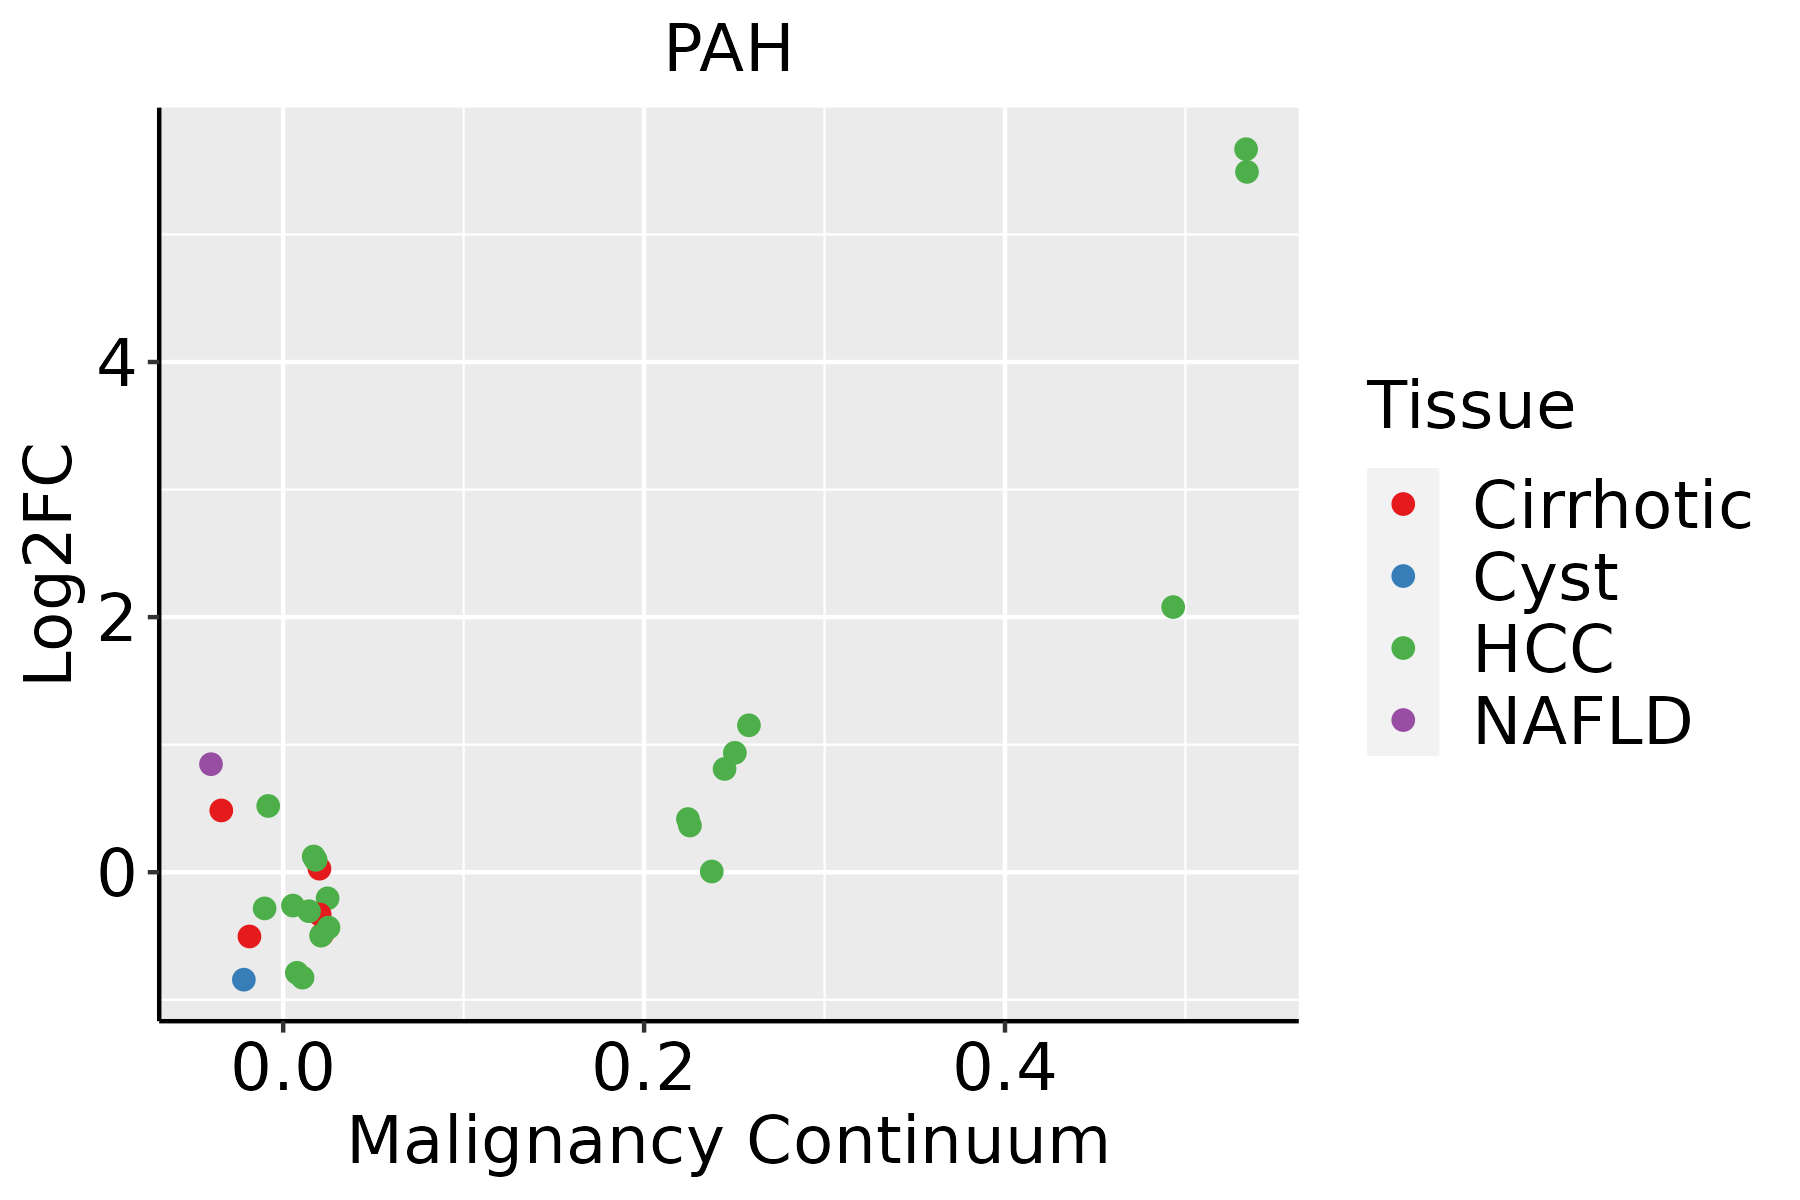 | HCC: Hepatocellular carcinoma |
| NAFLD: Non-alcoholic fatty liver disease |
| ∗log2FC in expression of this searched gene in stem-like cells from each diseased tissue sample relative to stem-like cells in normal samples in each tissue plotted against the malignancy continuum. Samples are colored based on if they are from different disease stage. |
Top |
Malignant transformation related pathway analysis |
| Find out the enriched GO biological processes and KEGG pathways involved in transition from healthy to precancer to cancer |
| Tissue | Disease Stage | Enriched GO biological Processes |
| Colorectum | AD |  |
| Colorectum | SER |  |
| Colorectum | MSS |  |
| Colorectum | MSI-H |  |
| Colorectum | FAP |  |
| ∗Top 15 enriched GO BP terms are showed in the bar plot of each disease state in each tissue. Each row represents a significant GO biological process which is colored according to the -log10(p.adjust). |
| Page: 1 2 3 4 5 6 7 8 9 |
| GO ID | Tissue | Disease Stage | Description | Gene Ratio | Bg Ratio | pvalue | p.adjust | Count |
| GO:00463953 | Liver | NAFLD | carboxylic acid catabolic process | 73/1882 | 236/18723 | 4.16e-19 | 1.22e-15 | 73 |
| GO:00160544 | Liver | NAFLD | organic acid catabolic process | 73/1882 | 240/18723 | 1.20e-18 | 2.34e-15 | 73 |
| GO:00442825 | Liver | NAFLD | small molecule catabolic process | 91/1882 | 376/18723 | 8.96e-16 | 1.31e-12 | 91 |
| GO:00194396 | Liver | NAFLD | aromatic compound catabolic process | 102/1882 | 467/18723 | 2.29e-14 | 1.91e-11 | 102 |
| GO:19013616 | Liver | NAFLD | organic cyclic compound catabolic process | 105/1882 | 495/18723 | 7.04e-14 | 5.15e-11 | 105 |
| GO:00160535 | Liver | NAFLD | organic acid biosynthetic process | 77/1882 | 316/18723 | 1.03e-13 | 6.69e-11 | 77 |
| GO:00463945 | Liver | NAFLD | carboxylic acid biosynthetic process | 75/1882 | 314/18723 | 6.37e-13 | 3.39e-10 | 75 |
| GO:0009063 | Liver | NAFLD | cellular amino acid catabolic process | 36/1882 | 110/18723 | 6.56e-11 | 1.99e-08 | 36 |
| GO:00065203 | Liver | NAFLD | cellular amino acid metabolic process | 63/1882 | 284/18723 | 1.14e-09 | 2.17e-07 | 63 |
| GO:00086523 | Liver | NAFLD | cellular amino acid biosynthetic process | 26/1882 | 76/18723 | 1.00e-08 | 1.33e-06 | 26 |
| GO:19016053 | Liver | NAFLD | alpha-amino acid metabolic process | 46/1882 | 195/18723 | 2.74e-08 | 2.86e-06 | 46 |
| GO:19016073 | Liver | NAFLD | alpha-amino acid biosynthetic process | 22/1882 | 68/18723 | 4.13e-07 | 2.62e-05 | 22 |
| GO:1901606 | Liver | NAFLD | alpha-amino acid catabolic process | 25/1882 | 87/18723 | 8.67e-07 | 4.60e-05 | 25 |
| GO:0009074 | Liver | NAFLD | aromatic amino acid family catabolic process | 8/1882 | 16/18723 | 6.30e-05 | 1.37e-03 | 8 |
| GO:0009072 | Liver | NAFLD | aromatic amino acid family metabolic process | 9/1882 | 30/18723 | 2.07e-03 | 2.05e-02 | 9 |
| GO:1901617 | Liver | NAFLD | organic hydroxy compound biosynthetic process | 37/1882 | 237/18723 | 4.58e-03 | 3.68e-02 | 37 |
| GO:190136111 | Liver | Cirrhotic | organic cyclic compound catabolic process | 213/4634 | 495/18723 | 1.58e-19 | 3.67e-17 | 213 |
| GO:001943911 | Liver | Cirrhotic | aromatic compound catabolic process | 202/4634 | 467/18723 | 6.93e-19 | 1.28e-16 | 202 |
| GO:001605312 | Liver | Cirrhotic | organic acid biosynthetic process | 139/4634 | 316/18723 | 4.28e-14 | 3.83e-12 | 139 |
| GO:004639412 | Liver | Cirrhotic | carboxylic acid biosynthetic process | 137/4634 | 314/18723 | 1.40e-13 | 1.14e-11 | 137 |
| Page: 1 2 3 |
| Pathway ID | Tissue | Disease Stage | Description | Gene Ratio | Bg Ratio | pvalue | p.adjust | qvalue | Count |
| hsa012304 | Liver | Cirrhotic | Biosynthesis of amino acids | 35/2530 | 75/8465 | 1.54e-03 | 7.83e-03 | 4.83e-03 | 35 |
| hsa0123011 | Liver | Cirrhotic | Biosynthesis of amino acids | 35/2530 | 75/8465 | 1.54e-03 | 7.83e-03 | 4.83e-03 | 35 |
| hsa0123021 | Liver | HCC | Biosynthesis of amino acids | 53/4020 | 75/8465 | 3.79e-05 | 2.11e-04 | 1.18e-04 | 53 |
| hsa0123031 | Liver | HCC | Biosynthesis of amino acids | 53/4020 | 75/8465 | 3.79e-05 | 2.11e-04 | 1.18e-04 | 53 |
| Page: 1 |
Top |
Cell-cell communication analysis |
| Identification of potential cell-cell interactions between two cell types and their ligand-receptor pairs for different disease states |
| Ligand | Receptor | LRpair | Pathway | Tissue | Disease Stage |
| Page: 1 |
Top |
Single-cell gene regulatory network inference analysis |
| Find out the significant the regulons (TFs) and the target genes of each regulon across cell types for different disease states |
| TF | Cell Type | Tissue | Disease Stage | Target Gene | RSS | Regulon Activity |
| ∗The dot plots of a searched regulon are shown for all cell subpopulations in each disease state of each tissue based on the regulon specific score inferred using pySCENIC and by calculating the average expression. |
| Page: 1 |
Top |
Somatic mutation of malignant transformation related genes |
| Annotation of somatic variants for genes involved in malignant transformation |
| Hugo Symbol | Variant Class | Variant Classification | dbSNP RS | HGVSc | HGVSp | HGVSp Short | SWISSPROT | BIOTYPE | SIFT | PolyPhen | Tumor Sample Barcode | Tissue | Histology | Sex | Age | Stage | Therapy Types | Drugs | Outcome |
| PAH | SNV | Missense_Mutation | rs79931499 | c.1238N>A | p.Arg413His | p.R413H | P00439 | protein_coding | tolerated(0.22) | benign(0.021) | TCGA-AN-A046-01 | Breast | breast invasive carcinoma | Female | >=65 | I/II | Unknown | Unknown | SD |
| PAH | SNV | Missense_Mutation | c.1226C>A | p.Pro409His | p.P409H | P00439 | protein_coding | deleterious(0) | probably_damaging(0.974) | TCGA-BH-A0BZ-01 | Breast | breast invasive carcinoma | Female | <65 | III/IV | Chemotherapy | doxorubicin | CR | |
| PAH | SNV | Missense_Mutation | rs199475678 | c.205C>T | p.Pro69Ser | p.P69S | P00439 | protein_coding | tolerated(0.11) | possibly_damaging(0.502) | TCGA-D8-A1XW-01 | Breast | breast invasive carcinoma | Female | <65 | I/II | Chemotherapy | adriamycin+cyclophosphamide | SD |
| PAH | insertion | In_Frame_Ins | novel | c.847_848insGCCTCCTGAGTGGCTGGGACTACAAGCACATAC | p.Ile283delinsSerLeuLeuSerGlyTrpAspTyrLysHisIleLeu | p.I283delinsSLLSGWDYKHIL | P00439 | protein_coding | TCGA-B6-A0IE-01 | Breast | breast invasive carcinoma | Female | <65 | III/IV | Unknown | Unknown | PD | ||
| PAH | deletion | Frame_Shift_Del | novel | c.1026delN | p.Tyr343MetfsTer57 | p.Y343Mfs*57 | P00439 | protein_coding | TCGA-D8-A27V-01 | Breast | breast invasive carcinoma | Female | <65 | I/II | Hormone Therapy | tamoxiphen | SD | ||
| PAH | SNV | Missense_Mutation | novel | c.572T>G | p.Phe191Cys | p.F191C | P00439 | protein_coding | deleterious(0) | probably_damaging(0.998) | TCGA-EA-A3HU-01 | Cervix | cervical & endocervical cancer | Female | <65 | I/II | Unknown | Unknown | SD |
| PAH | SNV | Missense_Mutation | rs62642939 | c.890G>A | p.Arg297His | p.R297H | P00439 | protein_coding | deleterious(0) | possibly_damaging(0.505) | TCGA-VS-A94Y-01 | Cervix | cervical & endocervical cancer | Female | <65 | I/II | Chemotherapy | cisplatin | PD |
| PAH | insertion | Frame_Shift_Ins | novel | c.306dupT | p.Gly103TrpfsTer6 | p.G103Wfs*6 | P00439 | protein_coding | TCGA-EA-A3HU-01 | Cervix | cervical & endocervical cancer | Female | <65 | I/II | Unknown | Unknown | SD | ||
| PAH | SNV | Missense_Mutation | c.1019T>A | p.Ile340Lys | p.I340K | P00439 | protein_coding | deleterious(0.04) | benign(0.015) | TCGA-AA-3860-01 | Colorectum | colon adenocarcinoma | Female | <65 | III/IV | Chemotherapy | folinic | CR | |
| PAH | SNV | Missense_Mutation | c.222N>C | p.Lys74Asn | p.K74N | P00439 | protein_coding | tolerated(0.48) | benign(0.018) | TCGA-AA-A010-01 | Colorectum | colon adenocarcinoma | Female | <65 | I/II | Chemotherapy | folinic | CR |
| Page: 1 2 3 4 5 6 7 8 9 |
Top |
Related drugs of malignant transformation related genes |
| Identification of chemicals and drugs interact with genes involved in malignant transfromation |
| (DGIdb 4.0) |
| Entrez ID | Symbol | Category | Interaction Types | Drug Claim Name | Drug Name | PMIDs |
| 5053 | PAH | DRUGGABLE GENOME, ENZYME | TETRAHYDROBIOPTERIN | SAPROPTERIN | ||
| 5053 | PAH | DRUGGABLE GENOME, ENZYME | activator | CHEMBL1201775 | SAPROPTERIN DIHYDROCHLORIDE | |
| 5053 | PAH | DRUGGABLE GENOME, ENZYME | inhibitor | 178101924 | FENCLONINE | |
| 5053 | PAH | DRUGGABLE GENOME, ENZYME | carbocisteine | CARBOCYSTEINE | 19036622 | |
| 5053 | PAH | DRUGGABLE GENOME, ENZYME | Pegvaliase | PEGVALIASE | ||
| 5053 | PAH | DRUGGABLE GENOME, ENZYME | SAPROPTERIN | SAPROPTERIN | ||
| 5053 | PAH | DRUGGABLE GENOME, ENZYME | activator | 178101959 | SAPROPTERIN | |
| 5053 | PAH | DRUGGABLE GENOME, ENZYME | SAPROPTERIN | SAPROPTERIN | ||
| 5053 | PAH | DRUGGABLE GENOME, ENZYME | HepaStem | |||
| 5053 | PAH | DRUGGABLE GENOME, ENZYME | PP-1420 |
| Page: 1 2 |

Copyright 2023-Present -The University of Texas Health Science Center at Houston |