
|
|||||
|
 | |
| |
| |
| |
| |
| |
|
Gene: PAGR1 |
Gene summary for PAGR1 |
| Gene information | Species | Human | Gene symbol | PAGR1 | Gene ID | 79447 |
| Gene name | PAXIP1 associated glutamate rich protein 1 | |
| Gene Alias | C16orf53 | |
| Cytomap | 16p11.2 | |
| Gene Type | protein-coding | GO ID | GO:0006139 | UniProtAcc | Q9BTK6 |
Top |
Malignant transformation analysis |
| Identification of the aberrant gene expression in precancerous and cancerous lesions by comparing the gene expression of stem-like cells in diseased tissues with normal stem cells |
| Entrez ID | Symbol | Replicates | Species | Organ | Tissue | Adj P-value | Log2FC | Malignancy |
| 79447 | PAGR1 | LZE2T | Human | Esophagus | ESCC | 3.94e-07 | 6.52e-01 | 0.082 |
| 79447 | PAGR1 | LZE4T | Human | Esophagus | ESCC | 2.35e-12 | 4.24e-01 | 0.0811 |
| 79447 | PAGR1 | LZE5T | Human | Esophagus | ESCC | 1.28e-07 | 4.41e-01 | 0.0514 |
| 79447 | PAGR1 | LZE7T | Human | Esophagus | ESCC | 6.11e-12 | 5.92e-01 | 0.0667 |
| 79447 | PAGR1 | LZE8T | Human | Esophagus | ESCC | 9.77e-06 | 2.44e-01 | 0.067 |
| 79447 | PAGR1 | LZE20T | Human | Esophagus | ESCC | 1.97e-04 | 2.19e-01 | 0.0662 |
| 79447 | PAGR1 | LZE22T | Human | Esophagus | ESCC | 1.28e-07 | 4.90e-01 | 0.068 |
| 79447 | PAGR1 | LZE24D1 | Human | Esophagus | HGIN | 3.66e-03 | 5.85e-01 | 0.054 |
| 79447 | PAGR1 | LZE24T | Human | Esophagus | ESCC | 5.96e-45 | 1.15e+00 | 0.0596 |
| 79447 | PAGR1 | LZE21T | Human | Esophagus | ESCC | 1.16e-05 | 4.49e-01 | 0.0655 |
| 79447 | PAGR1 | LZE6T | Human | Esophagus | ESCC | 2.19e-23 | 8.56e-01 | 0.0845 |
| 79447 | PAGR1 | P1T-E | Human | Esophagus | ESCC | 7.17e-16 | 6.28e-01 | 0.0875 |
| 79447 | PAGR1 | P2T-E | Human | Esophagus | ESCC | 2.25e-69 | 1.10e+00 | 0.1177 |
| 79447 | PAGR1 | P4T-E | Human | Esophagus | ESCC | 1.31e-36 | 8.12e-01 | 0.1323 |
| 79447 | PAGR1 | P5T-E | Human | Esophagus | ESCC | 2.28e-35 | 6.24e-01 | 0.1327 |
| 79447 | PAGR1 | P8T-E | Human | Esophagus | ESCC | 2.20e-17 | 3.40e-01 | 0.0889 |
| 79447 | PAGR1 | P9T-E | Human | Esophagus | ESCC | 4.11e-15 | 3.32e-01 | 0.1131 |
| 79447 | PAGR1 | P10T-E | Human | Esophagus | ESCC | 1.53e-19 | 3.34e-01 | 0.116 |
| 79447 | PAGR1 | P11T-E | Human | Esophagus | ESCC | 5.37e-25 | 8.17e-01 | 0.1426 |
| 79447 | PAGR1 | P12T-E | Human | Esophagus | ESCC | 6.49e-58 | 9.08e-01 | 0.1122 |
| Page: 1 2 3 4 |
| Tissue | Expression Dynamics | Abbreviation |
| Esophagus | 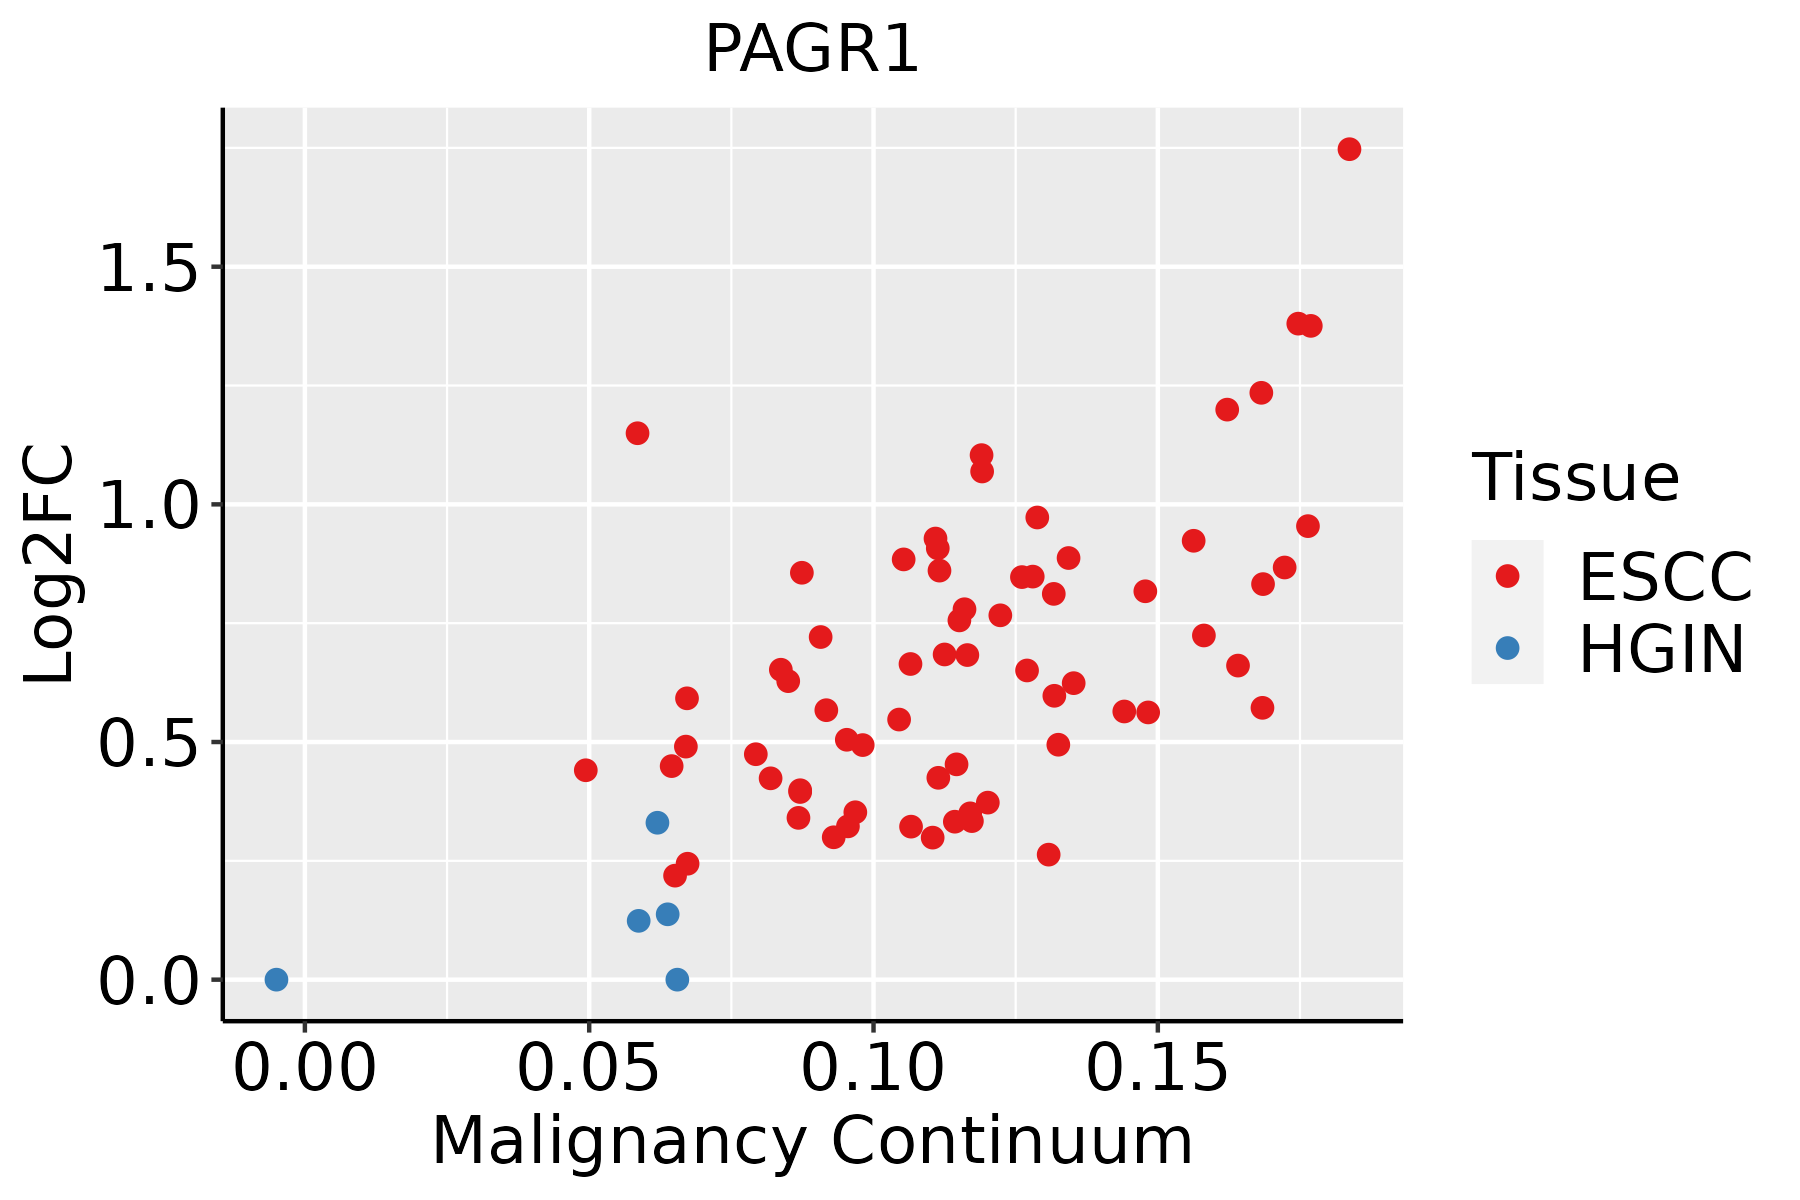 | ESCC: Esophageal squamous cell carcinoma |
| HGIN: High-grade intraepithelial neoplasias | ||
| LGIN: Low-grade intraepithelial neoplasias | ||
| Liver | 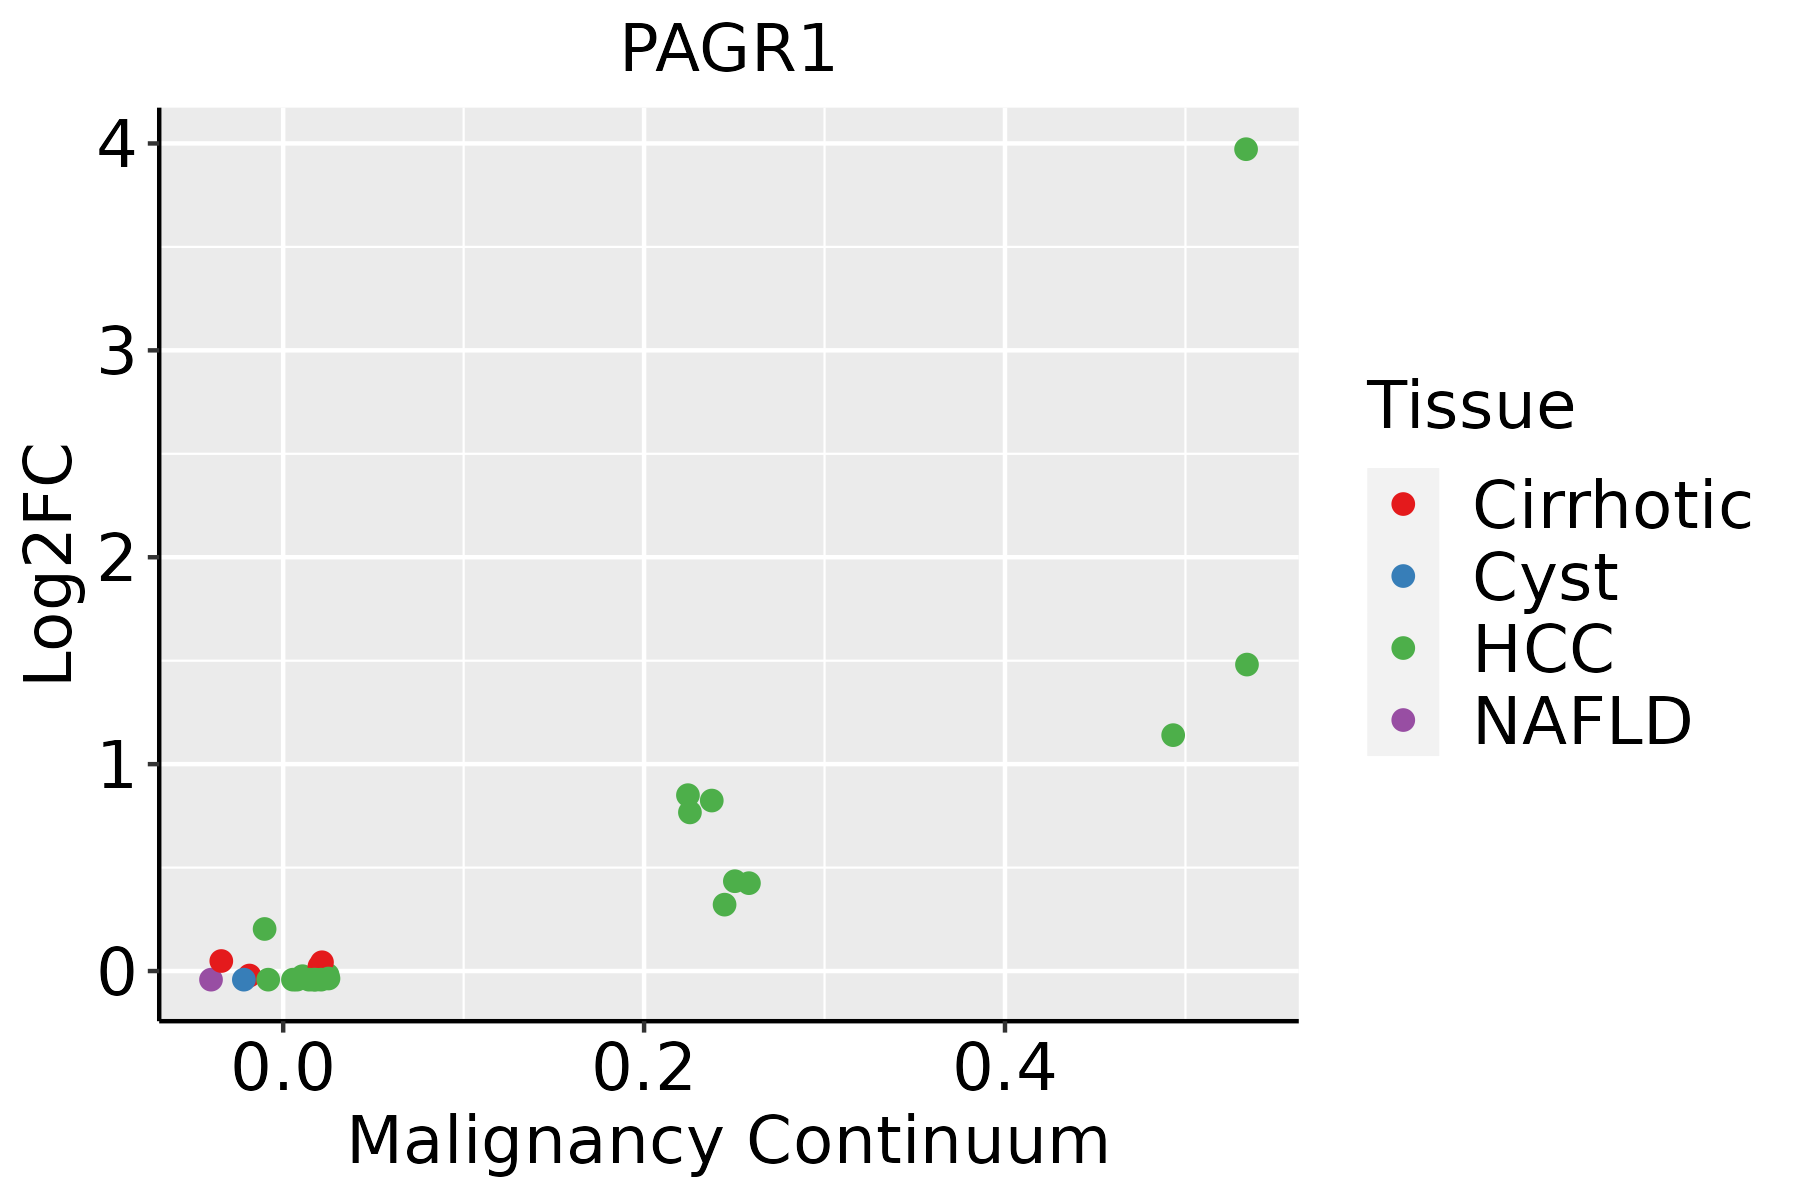 | HCC: Hepatocellular carcinoma |
| NAFLD: Non-alcoholic fatty liver disease |
| ∗log2FC in expression of this searched gene in stem-like cells from each diseased tissue sample relative to stem-like cells in normal samples in each tissue plotted against the malignancy continuum. Samples are colored based on if they are from different disease stage. |
Top |
Malignant transformation related pathway analysis |
| Find out the enriched GO biological processes and KEGG pathways involved in transition from healthy to precancer to cancer |
| Tissue | Disease Stage | Enriched GO biological Processes |
| Colorectum | AD |  |
| Colorectum | SER |  |
| Colorectum | MSS |  |
| Colorectum | MSI-H |  |
| Colorectum | FAP |  |
| ∗Top 15 enriched GO BP terms are showed in the bar plot of each disease state in each tissue. Each row represents a significant GO biological process which is colored according to the -log10(p.adjust). |
| Page: 1 2 3 4 5 6 7 8 9 |
| GO ID | Tissue | Disease Stage | Description | Gene Ratio | Bg Ratio | pvalue | p.adjust | Count |
| GO:001657015 | Esophagus | ESCC | histone modification | 323/8552 | 463/18723 | 2.61e-26 | 7.88e-24 | 323 |
| GO:001820514 | Esophagus | ESCC | peptidyl-lysine modification | 259/8552 | 376/18723 | 3.90e-20 | 5.26e-18 | 259 |
| GO:190198713 | Esophagus | ESCC | regulation of cell cycle phase transition | 242/8552 | 390/18723 | 3.86e-11 | 1.26e-09 | 242 |
| GO:00434143 | Esophagus | ESCC | macromolecule methylation | 199/8552 | 316/18723 | 3.44e-10 | 9.57e-09 | 199 |
| GO:0030522110 | Esophagus | ESCC | intracellular receptor signaling pathway | 170/8552 | 265/18723 | 8.58e-10 | 2.09e-08 | 170 |
| GO:004578710 | Esophagus | ESCC | positive regulation of cell cycle | 196/8552 | 313/18723 | 9.27e-10 | 2.24e-08 | 196 |
| GO:00322592 | Esophagus | ESCC | methylation | 222/8552 | 364/18723 | 2.26e-09 | 5.09e-08 | 222 |
| GO:0048545111 | Esophagus | ESCC | response to steroid hormone | 204/8552 | 339/18723 | 4.47e-08 | 8.11e-07 | 204 |
| GO:004484314 | Esophagus | ESCC | cell cycle G1/S phase transition | 148/8552 | 241/18723 | 5.68e-07 | 7.48e-06 | 148 |
| GO:000647914 | Esophagus | ESCC | protein methylation | 115/8552 | 181/18723 | 9.07e-07 | 1.16e-05 | 115 |
| GO:000821314 | Esophagus | ESCC | protein alkylation | 115/8552 | 181/18723 | 9.07e-07 | 1.16e-05 | 115 |
| GO:0071383110 | Esophagus | ESCC | cellular response to steroid hormone stimulus | 127/8552 | 204/18723 | 1.26e-06 | 1.55e-05 | 127 |
| GO:19019896 | Esophagus | ESCC | positive regulation of cell cycle phase transition | 77/8552 | 115/18723 | 3.20e-06 | 3.58e-05 | 77 |
| GO:00900689 | Esophagus | ESCC | positive regulation of cell cycle process | 142/8552 | 236/18723 | 4.79e-06 | 5.08e-05 | 142 |
| GO:003051819 | Esophagus | ESCC | intracellular steroid hormone receptor signaling pathway | 76/8552 | 116/18723 | 1.25e-05 | 1.15e-04 | 76 |
| GO:004340119 | Esophagus | ESCC | steroid hormone mediated signaling pathway | 87/8552 | 136/18723 | 1.25e-05 | 1.15e-04 | 87 |
| GO:00165718 | Esophagus | ESCC | histone methylation | 89/8552 | 141/18723 | 2.17e-05 | 1.87e-04 | 89 |
| GO:00331438 | Esophagus | ESCC | regulation of intracellular steroid hormone receptor signaling pathway | 50/8552 | 74/18723 | 1.16e-04 | 8.04e-04 | 50 |
| GO:003496814 | Esophagus | ESCC | histone lysine methylation | 72/8552 | 115/18723 | 1.85e-04 | 1.18e-03 | 72 |
| GO:001802214 | Esophagus | ESCC | peptidyl-lysine methylation | 79/8552 | 131/18723 | 5.17e-04 | 2.86e-03 | 79 |
| Page: 1 2 3 |
| Pathway ID | Tissue | Disease Stage | Description | Gene Ratio | Bg Ratio | pvalue | p.adjust | qvalue | Count |
| Page: 1 |
Top |
Cell-cell communication analysis |
| Identification of potential cell-cell interactions between two cell types and their ligand-receptor pairs for different disease states |
| Ligand | Receptor | LRpair | Pathway | Tissue | Disease Stage |
| Page: 1 |
Top |
Single-cell gene regulatory network inference analysis |
| Find out the significant the regulons (TFs) and the target genes of each regulon across cell types for different disease states |
| TF | Cell Type | Tissue | Disease Stage | Target Gene | RSS | Regulon Activity |
| ∗The dot plots of a searched regulon are shown for all cell subpopulations in each disease state of each tissue based on the regulon specific score inferred using pySCENIC and by calculating the average expression. |
| Page: 1 |
Top |
Somatic mutation of malignant transformation related genes |
| Annotation of somatic variants for genes involved in malignant transformation |
| Hugo Symbol | Variant Class | Variant Classification | dbSNP RS | HGVSc | HGVSp | HGVSp Short | SWISSPROT | BIOTYPE | SIFT | PolyPhen | Tumor Sample Barcode | Tissue | Histology | Sex | Age | Stage | Therapy Types | Drugs | Outcome |
| PAGR1 | SNV | Missense_Mutation | c.282N>C | p.Glu94Asp | p.E94D | Q9BTK6 | protein_coding | tolerated(0.23) | benign(0.007) | TCGA-E9-A243-01 | Breast | breast invasive carcinoma | Female | <65 | I/II | Chemotherapy | 5-fluorouracil | PD | |
| PAGR1 | deletion | Frame_Shift_Del | novel | c.746delC | p.Pro249LeufsTer14 | p.P249Lfs*14 | Q9BTK6 | protein_coding | TCGA-EW-A2FV-01 | Breast | breast invasive carcinoma | Female | <65 | III/IV | Chemotherapy | docetaxel | SD | ||
| PAGR1 | SNV | Missense_Mutation | novel | c.388G>A | p.Glu130Lys | p.E130K | Q9BTK6 | protein_coding | tolerated(0.58) | benign(0.055) | TCGA-EA-A3HU-01 | Cervix | cervical & endocervical cancer | Female | <65 | I/II | Unknown | Unknown | SD |
| PAGR1 | SNV | Missense_Mutation | novel | c.185C>T | p.Ser62Phe | p.S62F | Q9BTK6 | protein_coding | deleterious(0.04) | benign(0.082) | TCGA-VS-A8EB-01 | Cervix | cervical & endocervical cancer | Female | <65 | III/IV | Unknown | Unknown | PD |
| PAGR1 | SNV | Missense_Mutation | novel | c.553A>G | p.Arg185Gly | p.R185G | Q9BTK6 | protein_coding | deleterious(0.03) | possibly_damaging(0.747) | TCGA-CA-6717-01 | Colorectum | colon adenocarcinoma | Male | <65 | I/II | Chemotherapy | oxaliplatin | CR |
| PAGR1 | SNV | Missense_Mutation | novel | c.142N>T | p.Asp48Tyr | p.D48Y | Q9BTK6 | protein_coding | deleterious(0) | benign(0.33) | TCGA-AX-A2HC-01 | Endometrium | uterine corpus endometrioid carcinoma | Female | <65 | III/IV | Chemotherapy | paclitaxel | PD |
| PAGR1 | SNV | Missense_Mutation | novel | c.574N>T | p.Ala192Ser | p.A192S | Q9BTK6 | protein_coding | tolerated(0.21) | benign(0.254) | TCGA-B5-A3FA-01 | Endometrium | uterine corpus endometrioid carcinoma | Female | >=65 | I/II | Unknown | Unknown | SD |
| PAGR1 | SNV | Missense_Mutation | novel | c.343N>T | p.Leu115Phe | p.L115F | Q9BTK6 | protein_coding | deleterious(0) | probably_damaging(0.998) | TCGA-B5-A3FC-01 | Endometrium | uterine corpus endometrioid carcinoma | Female | <65 | I/II | Unknown | Unknown | SD |
| PAGR1 | SNV | Missense_Mutation | novel | c.524N>C | p.Val175Ala | p.V175A | Q9BTK6 | protein_coding | tolerated(0.58) | benign(0.001) | TCGA-E6-A2P8-01 | Endometrium | uterine corpus endometrioid carcinoma | Female | <65 | III/IV | Unknown | Unknown | PD |
| PAGR1 | SNV | Missense_Mutation | novel | c.744N>A | p.Phe248Leu | p.F248L | Q9BTK6 | protein_coding | deleterious(0) | possibly_damaging(0.888) | TCGA-EO-A3B0-01 | Endometrium | uterine corpus endometrioid carcinoma | Female | <65 | III/IV | Unknown | Unknown | SD |
| Page: 1 2 |
Top |
Related drugs of malignant transformation related genes |
| Identification of chemicals and drugs interact with genes involved in malignant transfromation |
| (DGIdb 4.0) |
| Entrez ID | Symbol | Category | Interaction Types | Drug Claim Name | Drug Name | PMIDs |
| Page: 1 |

Copyright 2023-Present -The University of Texas Health Science Center at Houston |