
|
|||||
|
 | |
| |
| |
| |
| |
| |
|
Gene: PAFAH2 |
Gene summary for PAFAH2 |
| Gene information | Species | Human | Gene symbol | PAFAH2 | Gene ID | 5051 |
| Gene name | platelet activating factor acetylhydrolase 2 | |
| Gene Alias | HSD-PLA2 | |
| Cytomap | 1p36.11 | |
| Gene Type | protein-coding | GO ID | GO:0006629 | UniProtAcc | Q99487 |
Top |
Malignant transformation analysis |
| Identification of the aberrant gene expression in precancerous and cancerous lesions by comparing the gene expression of stem-like cells in diseased tissues with normal stem cells |
| Entrez ID | Symbol | Replicates | Species | Organ | Tissue | Adj P-value | Log2FC | Malignancy |
| 5051 | PAFAH2 | HTA11_2487_2000001011 | Human | Colorectum | SER | 2.88e-09 | 3.84e-01 | -0.1808 |
| 5051 | PAFAH2 | HTA11_1938_2000001011 | Human | Colorectum | AD | 6.98e-06 | 2.92e-01 | -0.0811 |
| 5051 | PAFAH2 | HTA11_78_2000001011 | Human | Colorectum | AD | 4.06e-08 | 3.68e-01 | -0.1088 |
| 5051 | PAFAH2 | HTA11_347_2000001011 | Human | Colorectum | AD | 1.41e-22 | 5.84e-01 | -0.1954 |
| 5051 | PAFAH2 | HTA11_411_2000001011 | Human | Colorectum | SER | 2.05e-03 | 5.01e-01 | -0.2602 |
| 5051 | PAFAH2 | HTA11_2112_2000001011 | Human | Colorectum | SER | 8.86e-04 | 5.59e-01 | -0.2196 |
| 5051 | PAFAH2 | HTA11_83_2000001011 | Human | Colorectum | SER | 1.60e-06 | 3.54e-01 | -0.1526 |
| 5051 | PAFAH2 | HTA11_696_2000001011 | Human | Colorectum | AD | 3.48e-08 | 4.30e-01 | -0.1464 |
| 5051 | PAFAH2 | HTA11_866_2000001011 | Human | Colorectum | AD | 8.34e-03 | 2.56e-01 | -0.1001 |
| 5051 | PAFAH2 | HTA11_1391_2000001011 | Human | Colorectum | AD | 1.34e-08 | 4.29e-01 | -0.059 |
| 5051 | PAFAH2 | HTA11_2992_2000001011 | Human | Colorectum | SER | 1.61e-05 | 3.86e-01 | -0.1706 |
| 5051 | PAFAH2 | HTA11_5212_2000001011 | Human | Colorectum | AD | 6.62e-05 | 3.97e-01 | -0.2061 |
| 5051 | PAFAH2 | HTA11_7663_2000001011 | Human | Colorectum | SER | 1.19e-04 | 3.54e-01 | 0.0131 |
| 5051 | PAFAH2 | HTA11_10623_2000001011 | Human | Colorectum | AD | 1.10e-02 | 3.70e-01 | -0.0177 |
| 5051 | PAFAH2 | HTA11_10711_2000001011 | Human | Colorectum | AD | 4.54e-03 | 2.20e-01 | 0.0338 |
| 5051 | PAFAH2 | HTA11_99999965104_69814 | Human | Colorectum | MSS | 1.92e-05 | 1.36e-01 | 0.281 |
| 5051 | PAFAH2 | HCC1_Meng | Human | Liver | HCC | 9.96e-16 | -1.34e-02 | 0.0246 |
| 5051 | PAFAH2 | HCC2_Meng | Human | Liver | HCC | 7.78e-03 | -2.27e-03 | 0.0107 |
| 5051 | PAFAH2 | HCC1 | Human | Liver | HCC | 3.21e-11 | 2.56e+00 | 0.5336 |
| 5051 | PAFAH2 | HCC2 | Human | Liver | HCC | 6.84e-22 | 2.84e+00 | 0.5341 |
| Page: 1 2 |
| Tissue | Expression Dynamics | Abbreviation |
| Colorectum (GSE201348) |  | FAP: Familial adenomatous polyposis |
| CRC: Colorectal cancer | ||
| Colorectum (HTA11) |  | AD: Adenomas |
| SER: Sessile serrated lesions | ||
| MSI-H: Microsatellite-high colorectal cancer | ||
| MSS: Microsatellite stable colorectal cancer | ||
| Liver | 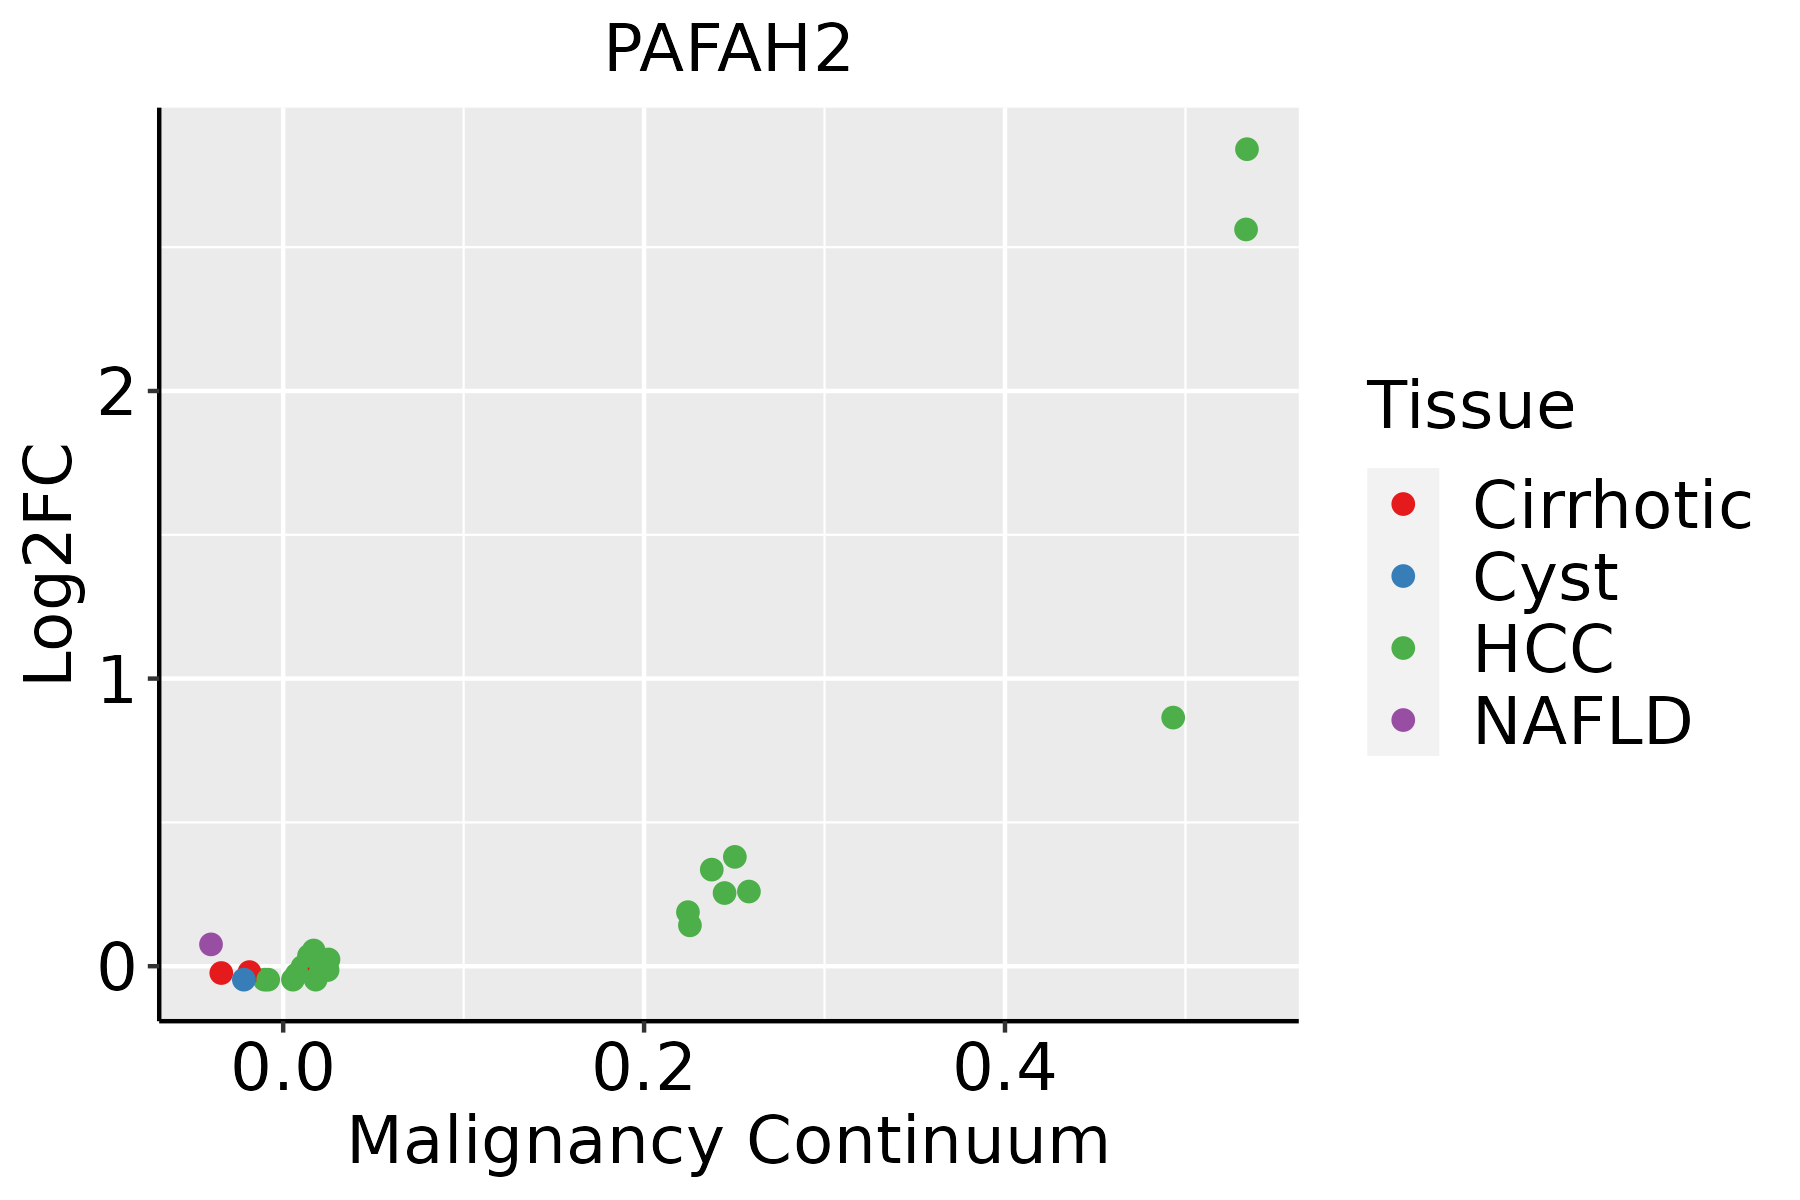 | HCC: Hepatocellular carcinoma |
| NAFLD: Non-alcoholic fatty liver disease |
| ∗log2FC in expression of this searched gene in stem-like cells from each diseased tissue sample relative to stem-like cells in normal samples in each tissue plotted against the malignancy continuum. Samples are colored based on if they are from different disease stage. |
Top |
Malignant transformation related pathway analysis |
| Find out the enriched GO biological processes and KEGG pathways involved in transition from healthy to precancer to cancer |
| Tissue | Disease Stage | Enriched GO biological Processes |
| Colorectum | AD |  |
| Colorectum | SER |  |
| Colorectum | MSS |  |
| Colorectum | MSI-H |  |
| Colorectum | FAP |  |
| ∗Top 15 enriched GO BP terms are showed in the bar plot of each disease state in each tissue. Each row represents a significant GO biological process which is colored according to the -log10(p.adjust). |
| Page: 1 2 3 4 5 6 7 8 9 |
| GO ID | Tissue | Disease Stage | Description | Gene Ratio | Bg Ratio | pvalue | p.adjust | Count |
| GO:0042060 | Colorectum | AD | wound healing | 128/3918 | 422/18723 | 2.73e-06 | 7.89e-05 | 128 |
| GO:0016042 | Colorectum | AD | lipid catabolic process | 97/3918 | 320/18723 | 4.31e-05 | 7.56e-04 | 97 |
| GO:0050878 | Colorectum | AD | regulation of body fluid levels | 108/3918 | 379/18723 | 2.54e-04 | 3.20e-03 | 108 |
| GO:00420601 | Colorectum | SER | wound healing | 97/2897 | 422/18723 | 2.69e-05 | 7.30e-04 | 97 |
| GO:00160421 | Colorectum | SER | lipid catabolic process | 77/2897 | 320/18723 | 3.52e-05 | 9.18e-04 | 77 |
| GO:00508781 | Colorectum | SER | regulation of body fluid levels | 81/2897 | 379/18723 | 1.28e-03 | 1.43e-02 | 81 |
| GO:00420602 | Colorectum | MSS | wound healing | 119/3467 | 422/18723 | 5.93e-07 | 2.24e-05 | 119 |
| GO:00508782 | Colorectum | MSS | regulation of body fluid levels | 99/3467 | 379/18723 | 1.40e-04 | 2.07e-03 | 99 |
| GO:00160422 | Colorectum | MSS | lipid catabolic process | 77/3467 | 320/18723 | 7.43e-03 | 4.71e-02 | 77 |
| GO:001604221 | Liver | HCC | lipid catabolic process | 175/7958 | 320/18723 | 6.50e-06 | 7.88e-05 | 175 |
| GO:004206022 | Liver | HCC | wound healing | 219/7958 | 422/18723 | 5.34e-05 | 5.04e-04 | 219 |
| GO:00075962 | Liver | HCC | blood coagulation | 118/7958 | 217/18723 | 2.63e-04 | 1.94e-03 | 118 |
| GO:00075992 | Liver | HCC | hemostasis | 119/7958 | 222/18723 | 5.25e-04 | 3.41e-03 | 119 |
| GO:00508172 | Liver | HCC | coagulation | 118/7958 | 222/18723 | 8.41e-04 | 5.03e-03 | 118 |
| GO:005087822 | Liver | HCC | regulation of body fluid levels | 191/7958 | 379/18723 | 1.06e-03 | 6.11e-03 | 191 |
| Page: 1 |
| Pathway ID | Tissue | Disease Stage | Description | Gene Ratio | Bg Ratio | pvalue | p.adjust | qvalue | Count |
| Page: 1 |
Top |
Cell-cell communication analysis |
| Identification of potential cell-cell interactions between two cell types and their ligand-receptor pairs for different disease states |
| Ligand | Receptor | LRpair | Pathway | Tissue | Disease Stage |
| Page: 1 |
Top |
Single-cell gene regulatory network inference analysis |
| Find out the significant the regulons (TFs) and the target genes of each regulon across cell types for different disease states |
| TF | Cell Type | Tissue | Disease Stage | Target Gene | RSS | Regulon Activity |
| ∗The dot plots of a searched regulon are shown for all cell subpopulations in each disease state of each tissue based on the regulon specific score inferred using pySCENIC and by calculating the average expression. |
| Page: 1 |
Top |
Somatic mutation of malignant transformation related genes |
| Annotation of somatic variants for genes involved in malignant transformation |
| Hugo Symbol | Variant Class | Variant Classification | dbSNP RS | HGVSc | HGVSp | HGVSp Short | SWISSPROT | BIOTYPE | SIFT | PolyPhen | Tumor Sample Barcode | Tissue | Histology | Sex | Age | Stage | Therapy Types | Drugs | Outcome |
| PAFAH2 | SNV | Missense_Mutation | rs769270945 | c.254G>A | p.Arg85His | p.R85H | Q99487 | protein_coding | tolerated(0.12) | benign(0.028) | TCGA-B6-A0WY-01 | Breast | breast invasive carcinoma | Female | <65 | III/IV | Unknown | Unknown | PD |
| PAFAH2 | SNV | Missense_Mutation | c.1160N>C | p.His387Pro | p.H387P | Q99487 | protein_coding | tolerated(0.2) | benign(0) | TCGA-E9-A1NH-01 | Breast | breast invasive carcinoma | Female | >=65 | I/II | Hormone Therapy | tamoxiphen | SD | |
| PAFAH2 | insertion | Frame_Shift_Ins | novel | c.604_605insGTATTCCGATTGGCCTGCCTAGGTTACATTC | p.Val202GlyfsTer35 | p.V202Gfs*35 | Q99487 | protein_coding | TCGA-A7-A0CE-01 | Breast | breast invasive carcinoma | Female | <65 | I/II | Chemotherapy | adriamycin | SD | ||
| PAFAH2 | insertion | In_Frame_Ins | novel | c.415_416insAGAAAT | p.Arg139delinsGlnLysTrp | p.R139delinsQKW | Q99487 | protein_coding | TCGA-AN-A0FJ-01 | Breast | breast invasive carcinoma | Female | <65 | III/IV | Unknown | Unknown | SD | ||
| PAFAH2 | insertion | Frame_Shift_Ins | novel | c.413_414insACAAAATGGGAAGTTCCCA | p.Asp138GlufsTer28 | p.D138Efs*28 | Q99487 | protein_coding | TCGA-AN-A0FJ-01 | Breast | breast invasive carcinoma | Female | <65 | III/IV | Unknown | Unknown | SD | ||
| PAFAH2 | SNV | Missense_Mutation | novel | c.111N>G | p.Phe37Leu | p.F37L | Q99487 | protein_coding | deleterious(0) | possibly_damaging(0.856) | TCGA-5M-AATE-01 | Colorectum | colon adenocarcinoma | Male | >=65 | I/II | Unknown | Unknown | PD |
| PAFAH2 | SNV | Missense_Mutation | c.903T>G | p.His301Gln | p.H301Q | Q99487 | protein_coding | tolerated(0.61) | possibly_damaging(0.69) | TCGA-A6-5665-01 | Colorectum | colon adenocarcinoma | Female | >=65 | I/II | Unknown | Unknown | PD | |
| PAFAH2 | SNV | Missense_Mutation | rs200838441 | c.239C>T | p.Ala80Val | p.A80V | Q99487 | protein_coding | tolerated(0.29) | benign(0.007) | TCGA-AA-3994-01 | Colorectum | colon adenocarcinoma | Male | >=65 | III/IV | Chemotherapy | capecitabine | CR |
| PAFAH2 | SNV | Missense_Mutation | rs779769461 | c.506N>A | p.Arg169His | p.R169H | Q99487 | protein_coding | deleterious(0.04) | benign(0.027) | TCGA-CK-6746-01 | Colorectum | colon adenocarcinoma | Female | >=65 | I/II | Unknown | Unknown | SD |
| PAFAH2 | SNV | Missense_Mutation | rs148490669 | c.190N>A | p.Glu64Lys | p.E64K | Q99487 | protein_coding | tolerated(0.56) | benign(0.041) | TCGA-DM-A0XD-01 | Colorectum | colon adenocarcinoma | Male | >=65 | I/II | Unknown | Unknown | PD |
| Page: 1 2 3 4 |
Top |
Related drugs of malignant transformation related genes |
| Identification of chemicals and drugs interact with genes involved in malignant transfromation |
| (DGIdb 4.0) |
| Entrez ID | Symbol | Category | Interaction Types | Drug Claim Name | Drug Name | PMIDs |
| Page: 1 |

Copyright 2023-Present -The University of Texas Health Science Center at Houston |