
|
|||||
|
 | |
| |
| |
| |
| |
| |
|
Gene: PAFAH1B3 |
Gene summary for PAFAH1B3 |
| Gene information | Species | Human | Gene symbol | PAFAH1B3 | Gene ID | 5050 |
| Gene name | platelet activating factor acetylhydrolase 1b catalytic subunit 3 | |
| Gene Alias | PAFAHG | |
| Cytomap | 19q13.2 | |
| Gene Type | protein-coding | GO ID | GO:0000003 | UniProtAcc | A0A024R0L6 |
Top |
Malignant transformation analysis |
| Identification of the aberrant gene expression in precancerous and cancerous lesions by comparing the gene expression of stem-like cells in diseased tissues with normal stem cells |
| Entrez ID | Symbol | Replicates | Species | Organ | Tissue | Adj P-value | Log2FC | Malignancy |
| 5050 | PAFAH1B3 | GSM4909281 | Human | Breast | IDC | 3.90e-13 | 4.48e-01 | 0.21 |
| 5050 | PAFAH1B3 | GSM4909285 | Human | Breast | IDC | 1.17e-19 | 4.86e-01 | 0.21 |
| 5050 | PAFAH1B3 | GSM4909286 | Human | Breast | IDC | 1.45e-08 | 3.11e-01 | 0.1081 |
| 5050 | PAFAH1B3 | GSM4909287 | Human | Breast | IDC | 1.45e-05 | 3.59e-01 | 0.2057 |
| 5050 | PAFAH1B3 | GSM4909288 | Human | Breast | IDC | 7.40e-03 | 2.66e-01 | 0.0988 |
| 5050 | PAFAH1B3 | GSM4909290 | Human | Breast | IDC | 8.07e-04 | 3.24e-01 | 0.2096 |
| 5050 | PAFAH1B3 | GSM4909291 | Human | Breast | IDC | 5.41e-10 | 4.98e-01 | 0.1753 |
| 5050 | PAFAH1B3 | GSM4909294 | Human | Breast | IDC | 3.08e-06 | 3.10e-01 | 0.2022 |
| 5050 | PAFAH1B3 | GSM4909296 | Human | Breast | IDC | 1.45e-15 | 4.04e-01 | 0.1524 |
| 5050 | PAFAH1B3 | GSM4909297 | Human | Breast | IDC | 1.66e-12 | 2.31e-01 | 0.1517 |
| 5050 | PAFAH1B3 | GSM4909298 | Human | Breast | IDC | 2.61e-08 | 3.46e-01 | 0.1551 |
| 5050 | PAFAH1B3 | GSM4909301 | Human | Breast | IDC | 3.27e-29 | 6.96e-01 | 0.1577 |
| 5050 | PAFAH1B3 | GSM4909302 | Human | Breast | IDC | 4.19e-06 | 3.65e-01 | 0.1545 |
| 5050 | PAFAH1B3 | GSM4909304 | Human | Breast | IDC | 9.57e-20 | 5.31e-01 | 0.1636 |
| 5050 | PAFAH1B3 | GSM4909306 | Human | Breast | IDC | 7.06e-14 | 5.09e-01 | 0.1564 |
| 5050 | PAFAH1B3 | GSM4909307 | Human | Breast | IDC | 1.86e-26 | 6.50e-01 | 0.1569 |
| 5050 | PAFAH1B3 | GSM4909308 | Human | Breast | IDC | 2.14e-32 | 6.96e-01 | 0.158 |
| 5050 | PAFAH1B3 | GSM4909311 | Human | Breast | IDC | 1.15e-17 | 6.88e-02 | 0.1534 |
| 5050 | PAFAH1B3 | GSM4909312 | Human | Breast | IDC | 2.46e-10 | 2.55e-01 | 0.1552 |
| 5050 | PAFAH1B3 | GSM4909315 | Human | Breast | IDC | 1.20e-12 | 5.11e-01 | 0.21 |
| Page: 1 2 3 4 5 6 7 8 9 10 |
| Tissue | Expression Dynamics | Abbreviation |
| Breast | 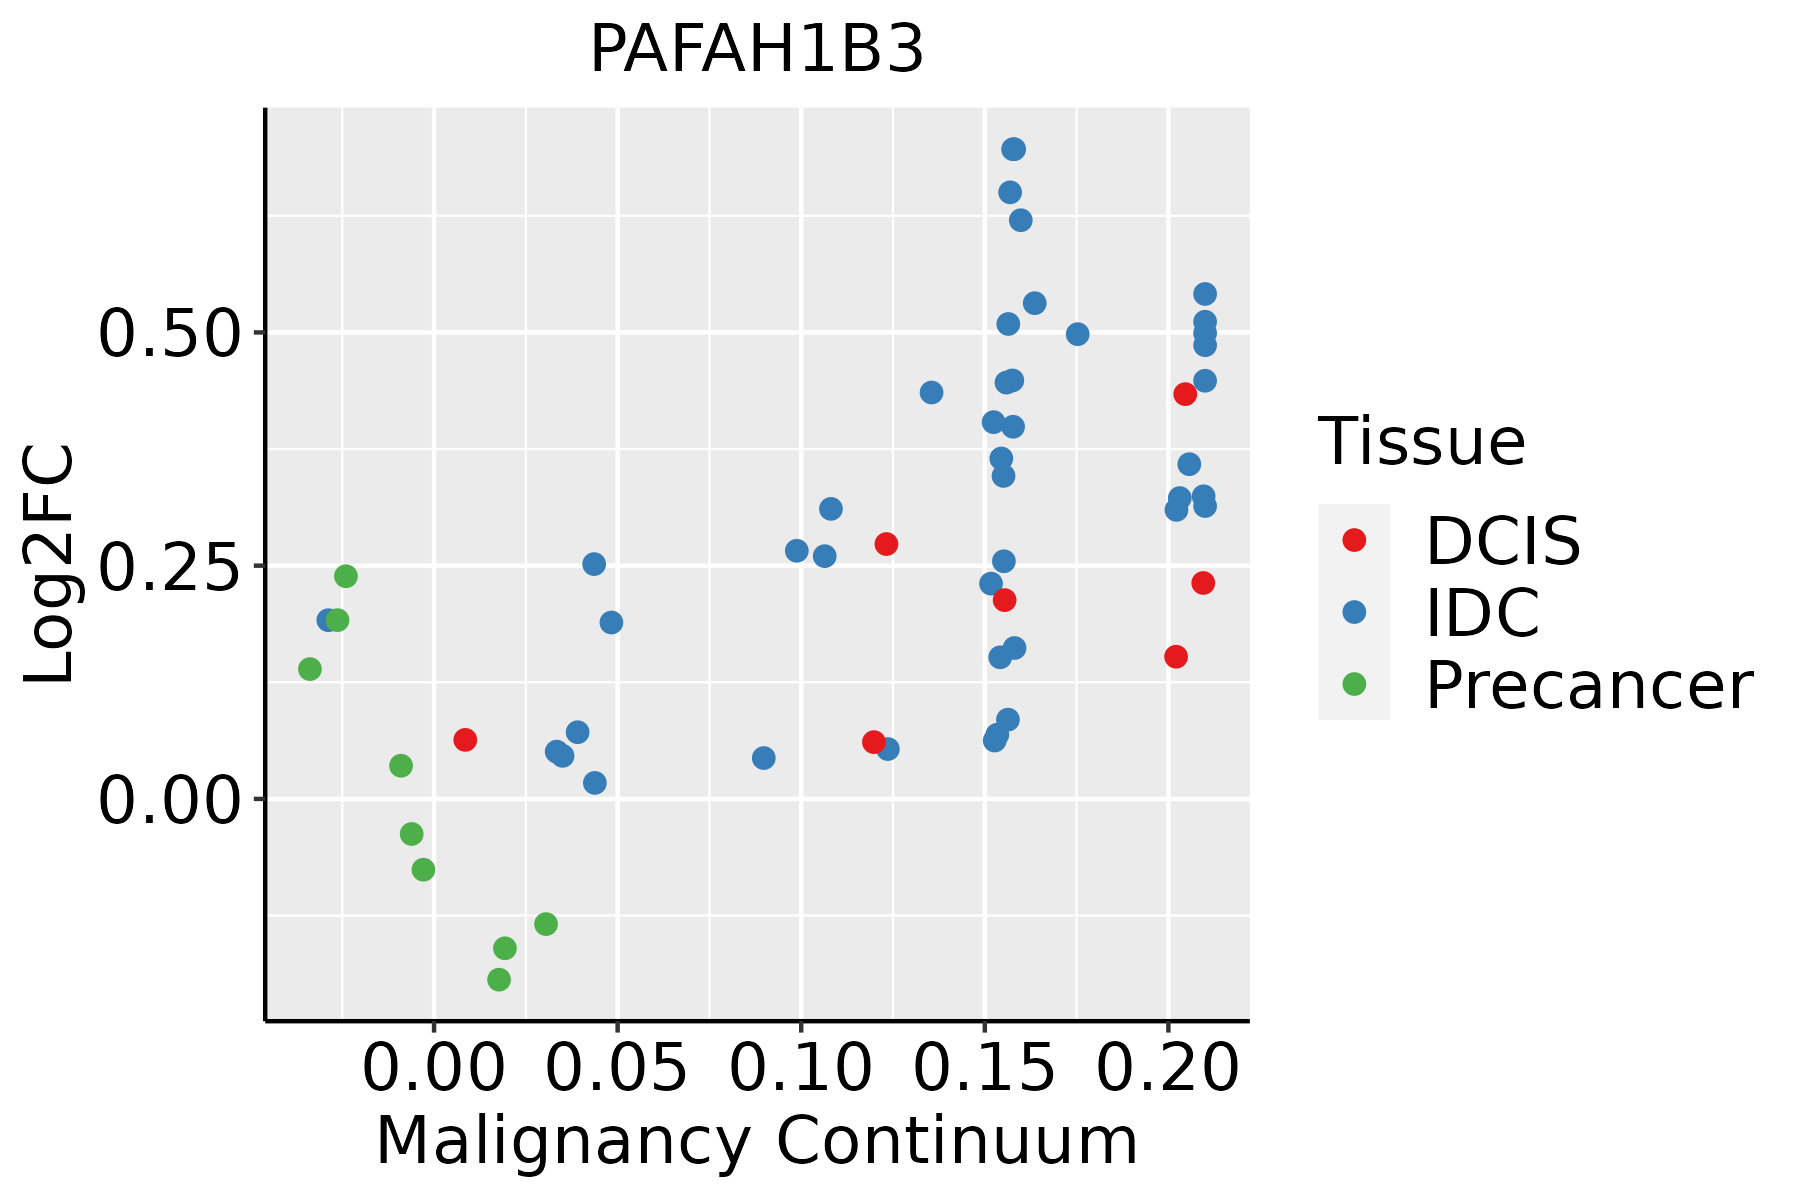 | IDC: Invasive ductal carcinoma |
| DCIS: Ductal carcinoma in situ | ||
| Precancer(BRCA1-mut): Precancerous lesion from BRCA1 mutation carriers | ||
| Colorectum (GSE201348) |  | FAP: Familial adenomatous polyposis |
| CRC: Colorectal cancer | ||
| Colorectum (HTA11) |  | AD: Adenomas |
| SER: Sessile serrated lesions | ||
| MSI-H: Microsatellite-high colorectal cancer | ||
| MSS: Microsatellite stable colorectal cancer | ||
| Esophagus |  | ESCC: Esophageal squamous cell carcinoma |
| HGIN: High-grade intraepithelial neoplasias | ||
| LGIN: Low-grade intraepithelial neoplasias | ||
| Liver | 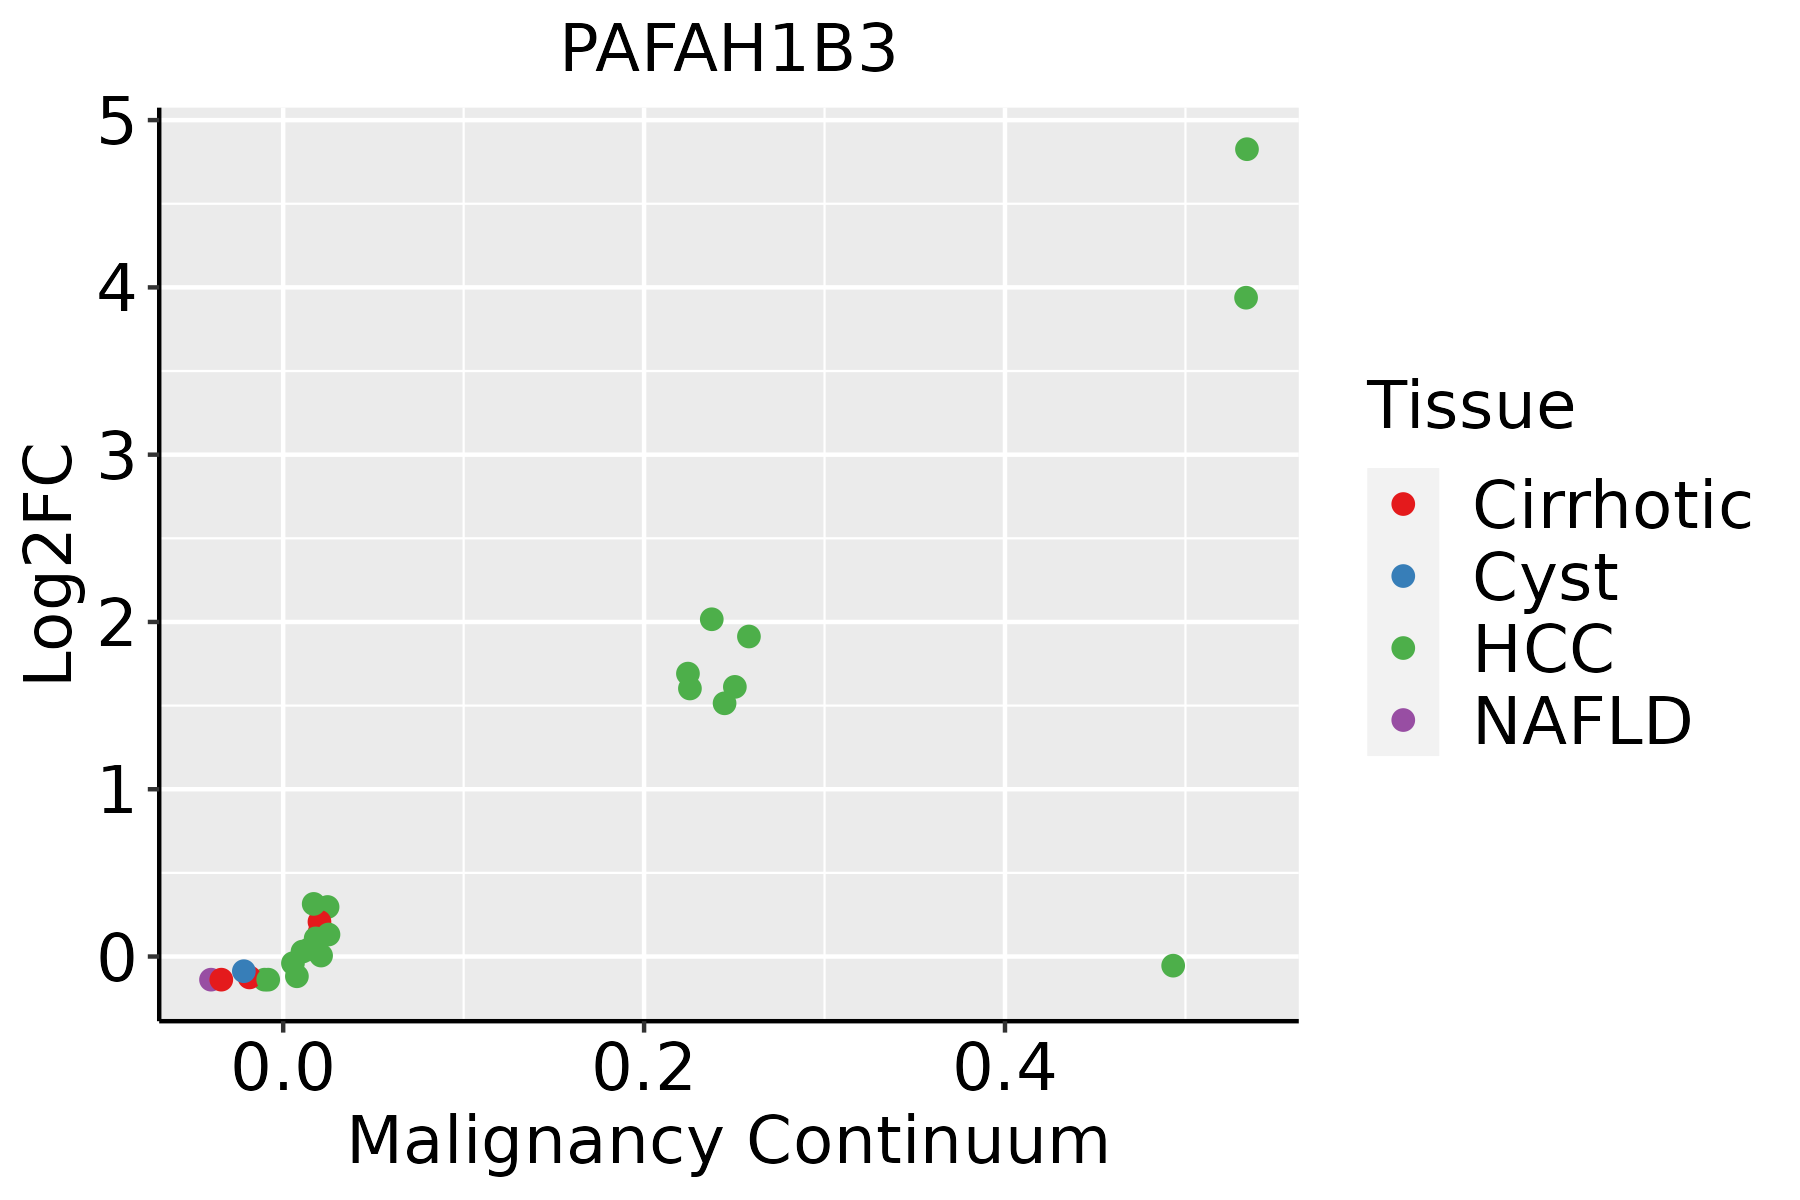 | HCC: Hepatocellular carcinoma |
| NAFLD: Non-alcoholic fatty liver disease | ||
| Oral Cavity | 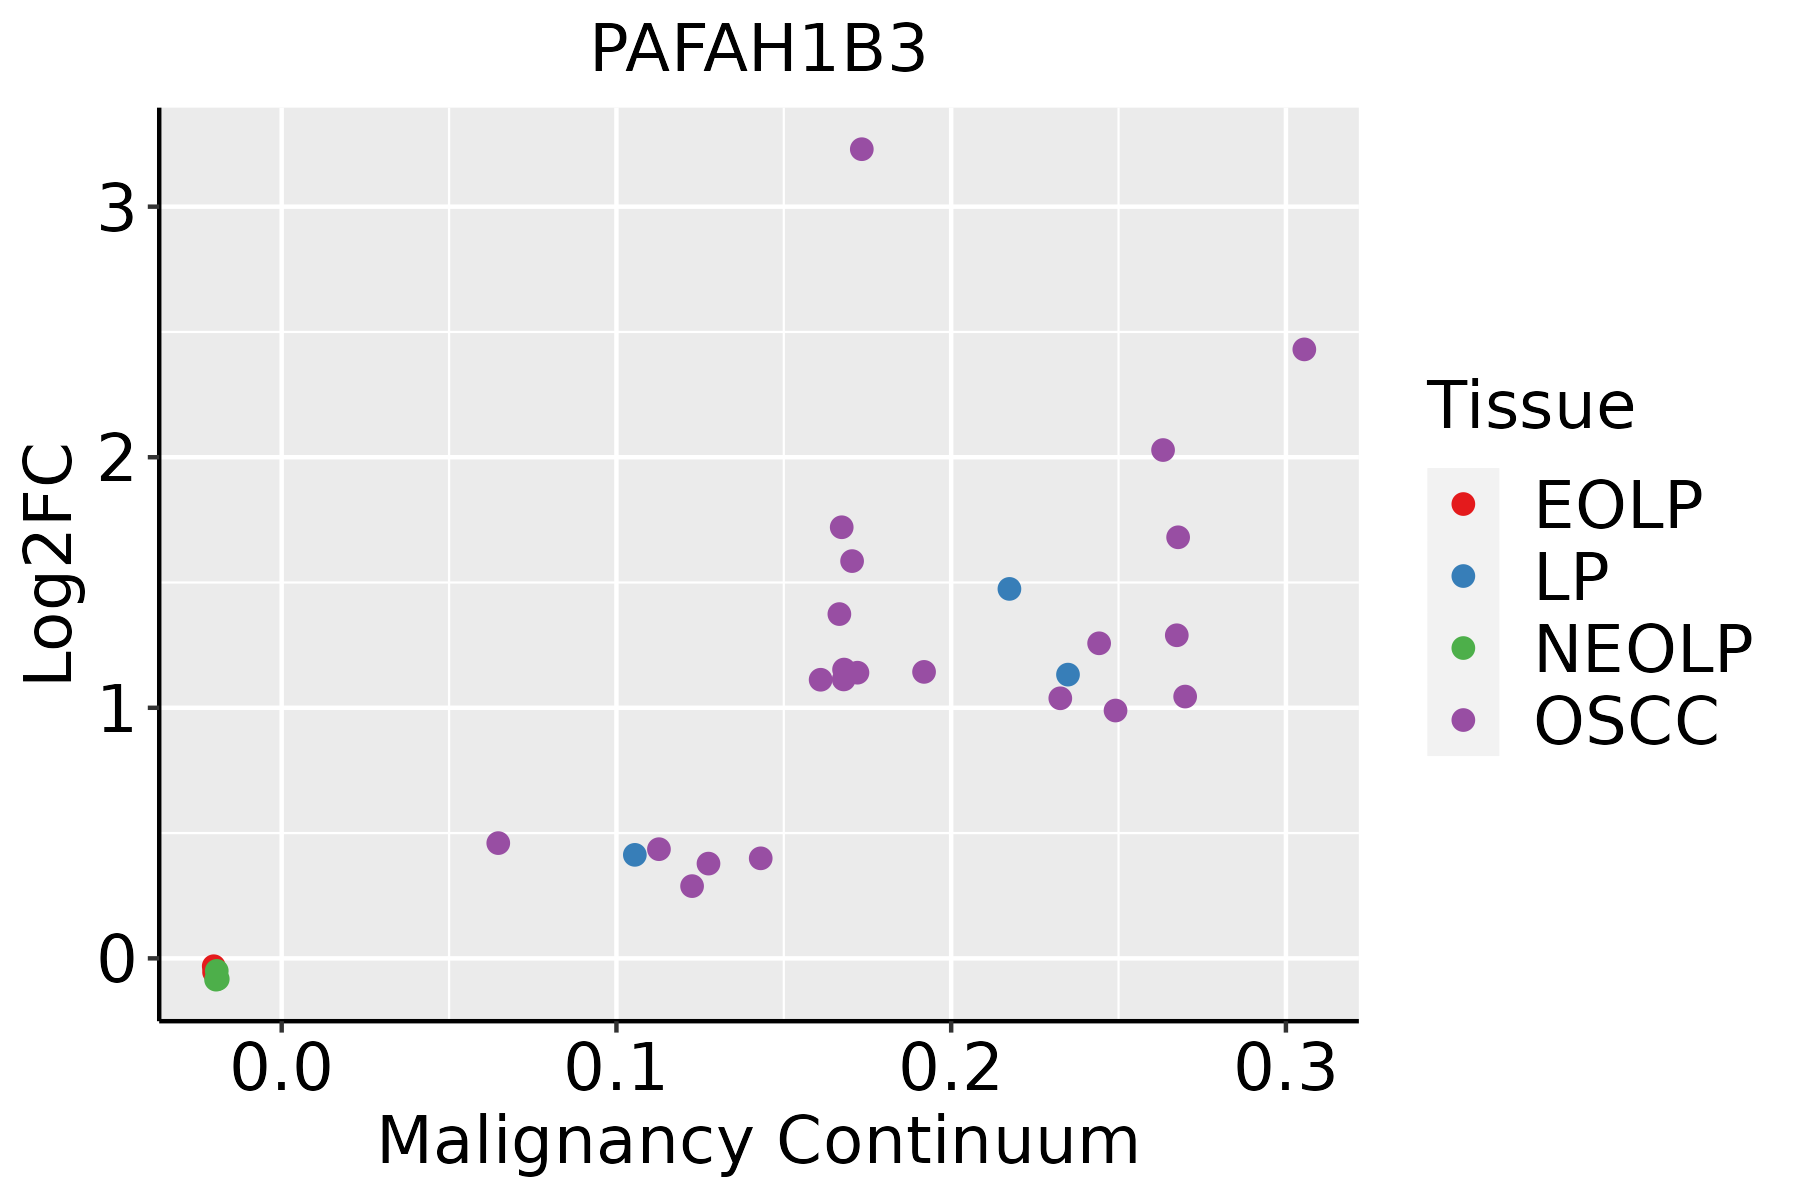 | EOLP: Erosive Oral lichen planus |
| LP: leukoplakia | ||
| NEOLP: Non-erosive oral lichen planus | ||
| OSCC: Oral squamous cell carcinoma | ||
| Prostate | 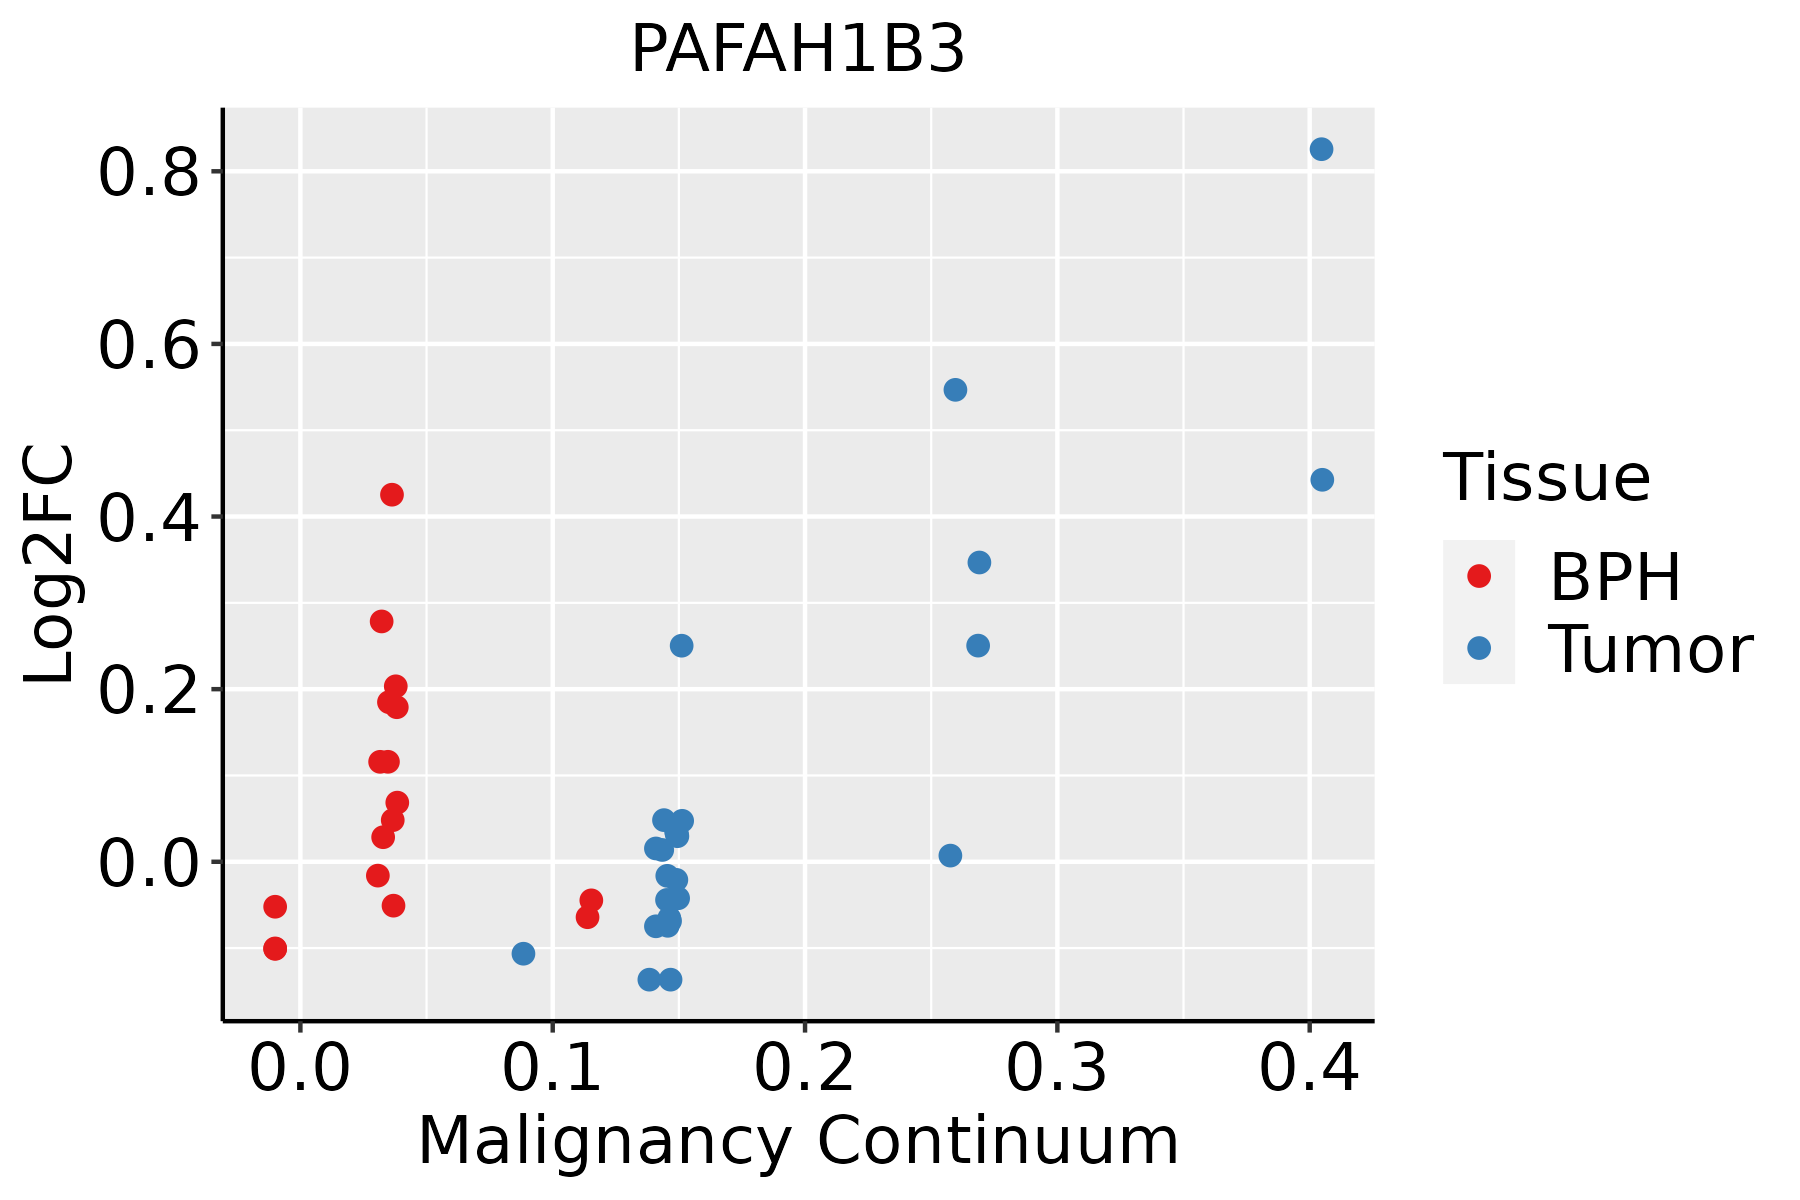 | BPH: Benign Prostatic Hyperplasia |
| Skin |  | AK: Actinic keratosis |
| cSCC: Cutaneous squamous cell carcinoma | ||
| SCCIS:squamous cell carcinoma in situ | ||
| Thyroid | 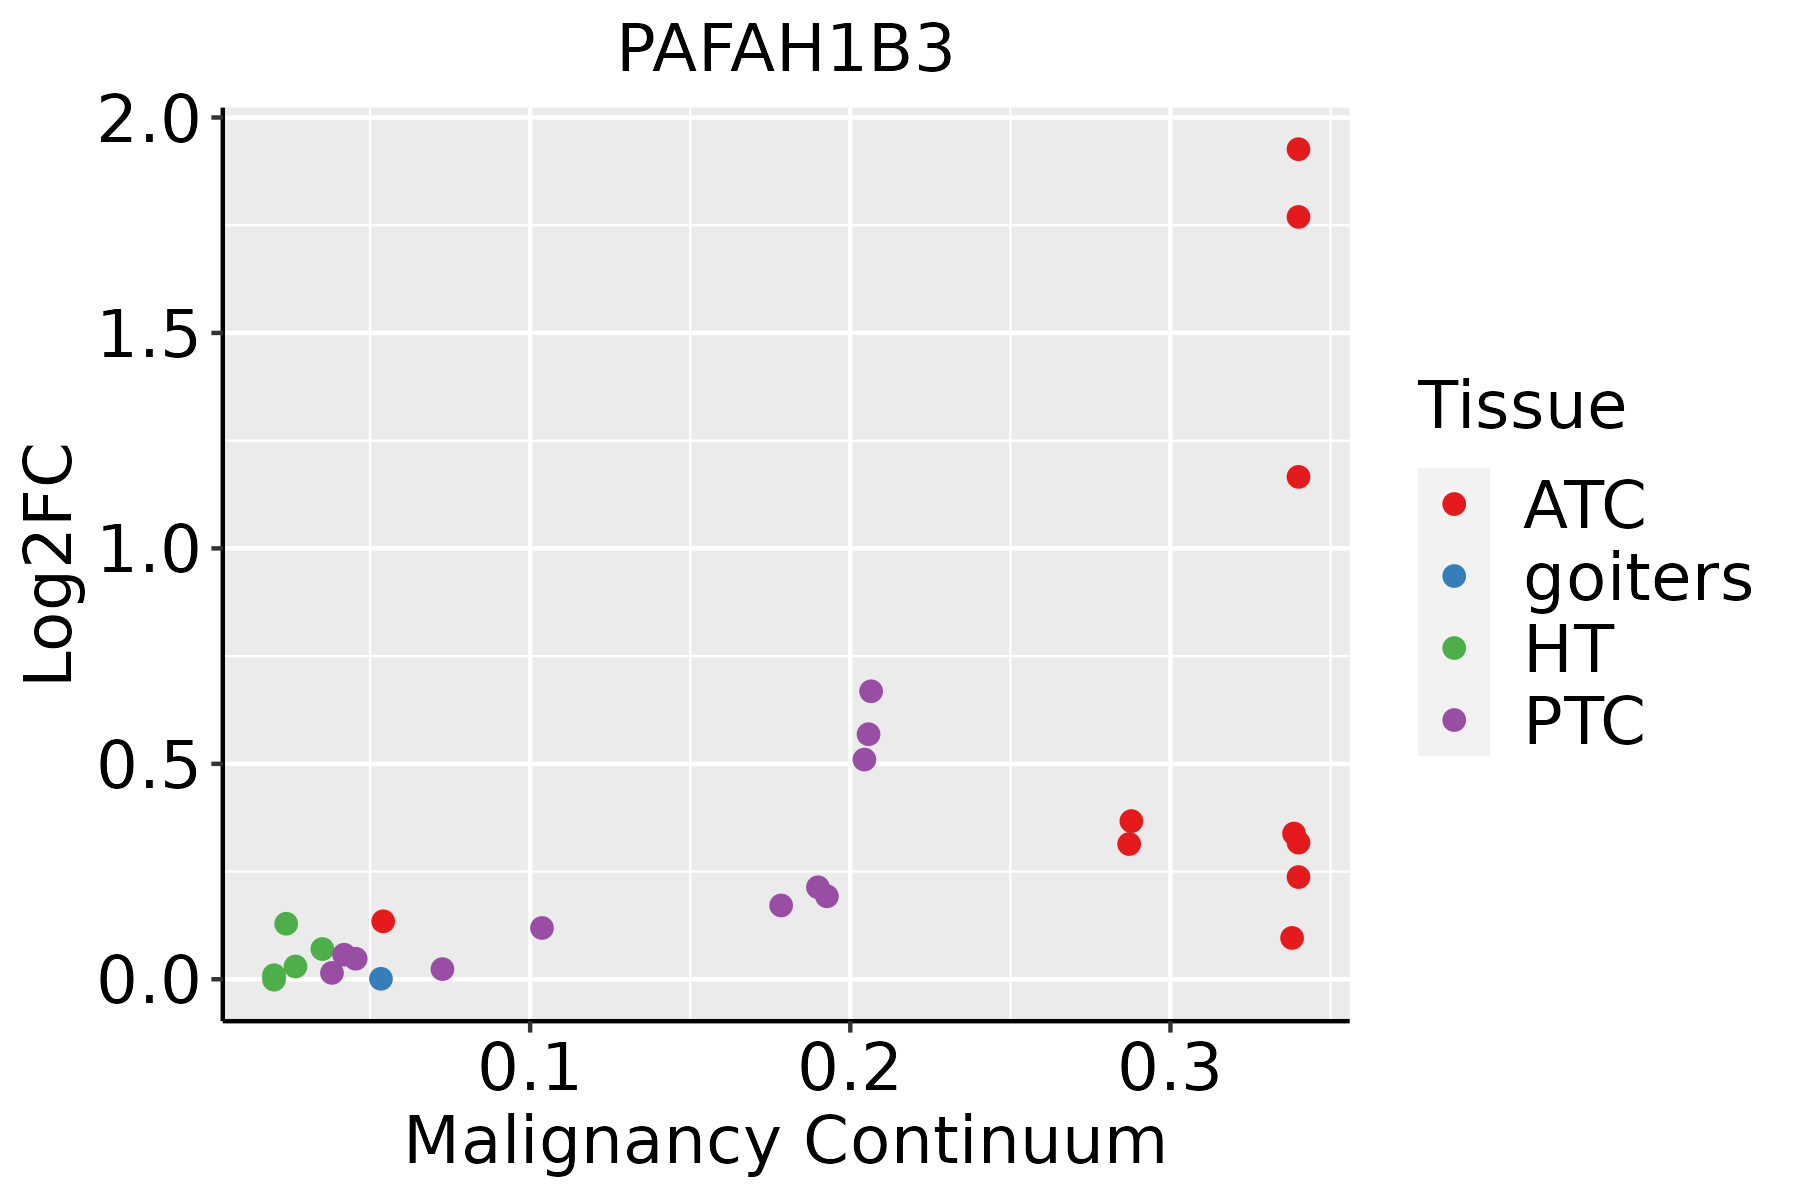 | ATC: Anaplastic thyroid cancer |
| HT: Hashimoto's thyroiditis | ||
| PTC: Papillary thyroid cancer |
| ∗log2FC in expression of this searched gene in stem-like cells from each diseased tissue sample relative to stem-like cells in normal samples in each tissue plotted against the malignancy continuum. Samples are colored based on if they are from different disease stage. |
Top |
Malignant transformation related pathway analysis |
| Find out the enriched GO biological processes and KEGG pathways involved in transition from healthy to precancer to cancer |
| Tissue | Disease Stage | Enriched GO biological Processes |
| Colorectum | AD |  |
| Colorectum | SER |  |
| Colorectum | MSS |  |
| Colorectum | MSI-H |  |
| Colorectum | FAP |  |
| ∗Top 15 enriched GO BP terms are showed in the bar plot of each disease state in each tissue. Each row represents a significant GO biological process which is colored according to the -log10(p.adjust). |
| Page: 1 2 3 4 5 6 7 8 9 |
| GO ID | Tissue | Disease Stage | Description | Gene Ratio | Bg Ratio | pvalue | p.adjust | Count |
| GO:0016042 | Colorectum | AD | lipid catabolic process | 97/3918 | 320/18723 | 4.31e-05 | 7.56e-04 | 97 |
| GO:00160421 | Colorectum | SER | lipid catabolic process | 77/2897 | 320/18723 | 3.52e-05 | 9.18e-04 | 77 |
| GO:00160422 | Colorectum | MSS | lipid catabolic process | 77/3467 | 320/18723 | 7.43e-03 | 4.71e-02 | 77 |
| GO:00160427 | Esophagus | ESCC | lipid catabolic process | 168/8552 | 320/18723 | 7.97e-03 | 2.84e-02 | 168 |
| GO:001604212 | Liver | Cirrhotic | lipid catabolic process | 112/4634 | 320/18723 | 2.31e-05 | 3.03e-04 | 112 |
| GO:001604221 | Liver | HCC | lipid catabolic process | 175/7958 | 320/18723 | 6.50e-06 | 7.88e-05 | 175 |
| Page: 1 |
| Pathway ID | Tissue | Disease Stage | Description | Gene Ratio | Bg Ratio | pvalue | p.adjust | qvalue | Count |
| Page: 1 |
Top |
Cell-cell communication analysis |
| Identification of potential cell-cell interactions between two cell types and their ligand-receptor pairs for different disease states |
| Ligand | Receptor | LRpair | Pathway | Tissue | Disease Stage |
| Page: 1 |
Top |
Single-cell gene regulatory network inference analysis |
| Find out the significant the regulons (TFs) and the target genes of each regulon across cell types for different disease states |
| TF | Cell Type | Tissue | Disease Stage | Target Gene | RSS | Regulon Activity |
| ∗The dot plots of a searched regulon are shown for all cell subpopulations in each disease state of each tissue based on the regulon specific score inferred using pySCENIC and by calculating the average expression. |
| Page: 1 |
Top |
Somatic mutation of malignant transformation related genes |
| Annotation of somatic variants for genes involved in malignant transformation |
| Hugo Symbol | Variant Class | Variant Classification | dbSNP RS | HGVSc | HGVSp | HGVSp Short | SWISSPROT | BIOTYPE | SIFT | PolyPhen | Tumor Sample Barcode | Tissue | Histology | Sex | Age | Stage | Therapy Types | Drugs | Outcome |
| PAFAH1B3 | SNV | Missense_Mutation | novel | c.641N>C | p.Arg214Pro | p.R214P | Q15102 | protein_coding | deleterious(0.01) | benign(0.01) | TCGA-DS-A1OB-01 | Cervix | cervical & endocervical cancer | Female | <65 | I/II | Chemotherapy | carboplatin | PD |
| PAFAH1B3 | SNV | Missense_Mutation | rs199807899 | c.448N>A | p.Glu150Lys | p.E150K | Q15102 | protein_coding | deleterious(0.01) | benign(0.093) | TCGA-HM-A4S6-01 | Cervix | cervical & endocervical cancer | Female | <65 | III/IV | Chemotherapy | cisplatin | CR |
| PAFAH1B3 | insertion | Frame_Shift_Ins | novel | c.642_643insTGCAGAA | p.Leu215CysfsTer? | p.L215Cfs*? | Q15102 | protein_coding | TCGA-DS-A1OB-01 | Cervix | cervical & endocervical cancer | Female | <65 | I/II | Chemotherapy | carboplatin | PD | ||
| PAFAH1B3 | SNV | Missense_Mutation | c.223N>A | p.Asp75Asn | p.D75N | Q15102 | protein_coding | deleterious(0) | probably_damaging(0.999) | TCGA-CK-4951-01 | Colorectum | colon adenocarcinoma | Female | >=65 | I/II | Unknown | Unknown | PD | |
| PAFAH1B3 | SNV | Missense_Mutation | novel | c.156N>T | p.Met52Ile | p.M52I | Q15102 | protein_coding | deleterious(0.02) | benign(0.021) | TCGA-AG-4001-01 | Colorectum | rectum adenocarcinoma | Female | >=65 | I/II | Unknown | Unknown | SD |
| PAFAH1B3 | SNV | Missense_Mutation | rs771659012 | c.380N>A | p.Arg127Gln | p.R127Q | Q15102 | protein_coding | tolerated(0.14) | benign(0.08) | TCGA-AG-A02N-01 | Colorectum | rectum adenocarcinoma | Male | >=65 | I/II | Chemotherapy | folinic | CR |
| PAFAH1B3 | deletion | In_Frame_Del | novel | c.251_280delNNNNNNNNNNNNNNNNNNNNNNNNNNNNNN | p.Leu84_Arg93del | p.L84_R93del | Q15102 | protein_coding | TCGA-AA-3930-01 | Colorectum | colon adenocarcinoma | Male | >=65 | III/IV | Chemotherapy | capecitabine | PD | ||
| PAFAH1B3 | SNV | Missense_Mutation | rs549905897 | c.175N>T | p.Arg59Cys | p.R59C | Q15102 | protein_coding | deleterious(0.01) | possibly_damaging(0.891) | TCGA-AJ-A3OJ-01 | Endometrium | uterine corpus endometrioid carcinoma | Female | <65 | I/II | Chemotherapy | carboplatin | CR |
| PAFAH1B3 | SNV | Missense_Mutation | novel | c.655N>T | p.Asp219Tyr | p.D219Y | Q15102 | protein_coding | deleterious(0.03) | probably_damaging(0.993) | TCGA-AP-A1DV-01 | Endometrium | uterine corpus endometrioid carcinoma | Female | <65 | I/II | Unknown | Unknown | SD |
| PAFAH1B3 | SNV | Missense_Mutation | novel | c.356C>A | p.Ala119Asp | p.A119D | Q15102 | protein_coding | tolerated(0.11) | probably_damaging(0.976) | TCGA-EO-A22U-01 | Endometrium | uterine corpus endometrioid carcinoma | Female | >=65 | I/II | Unknown | Unknown | SD |
| Page: 1 2 |
Top |
Related drugs of malignant transformation related genes |
| Identification of chemicals and drugs interact with genes involved in malignant transfromation |
| (DGIdb 4.0) |
| Entrez ID | Symbol | Category | Interaction Types | Drug Claim Name | Drug Name | PMIDs |
| Page: 1 |

Copyright 2023-Present -The University of Texas Health Science Center at Houston |