
|
|||||
|
 | |
| |
| |
| |
| |
| |
|
Gene: PAFAH1B1 |
Gene summary for PAFAH1B1 |
| Gene information | Species | Human | Gene symbol | PAFAH1B1 | Gene ID | 5048 |
| Gene name | platelet activating factor acetylhydrolase 1b regulatory subunit 1 | |
| Gene Alias | LIS1 | |
| Cytomap | 17p13.3 | |
| Gene Type | protein-coding | GO ID | GO:0000003 | UniProtAcc | P43034 |
Top |
Malignant transformation analysis |
| Identification of the aberrant gene expression in precancerous and cancerous lesions by comparing the gene expression of stem-like cells in diseased tissues with normal stem cells |
| Entrez ID | Symbol | Replicates | Species | Organ | Tissue | Adj P-value | Log2FC | Malignancy |
| 5048 | PAFAH1B1 | CA_HPV_1 | Human | Cervix | CC | 7.64e-03 | -1.33e-01 | 0.0264 |
| 5048 | PAFAH1B1 | CA_HPV_3 | Human | Cervix | CC | 3.54e-03 | 9.12e-02 | 0.0414 |
| 5048 | PAFAH1B1 | N_HPV_2 | Human | Cervix | N_HPV | 3.57e-02 | 7.58e-02 | -0.0131 |
| 5048 | PAFAH1B1 | CCI_1 | Human | Cervix | CC | 6.23e-06 | 9.35e-01 | 0.528 |
| 5048 | PAFAH1B1 | CCI_2 | Human | Cervix | CC | 6.74e-08 | 1.15e+00 | 0.5249 |
| 5048 | PAFAH1B1 | HTA11_3410_2000001011 | Human | Colorectum | AD | 1.08e-05 | -2.90e-01 | 0.0155 |
| 5048 | PAFAH1B1 | HTA11_347_2000001011 | Human | Colorectum | AD | 6.37e-09 | 5.75e-01 | -0.1954 |
| 5048 | PAFAH1B1 | HTA11_99999973899_84307 | Human | Colorectum | MSS | 1.33e-02 | -4.88e-01 | 0.2585 |
| 5048 | PAFAH1B1 | HTA11_99999974143_84620 | Human | Colorectum | MSS | 1.18e-02 | -2.63e-01 | 0.3005 |
| 5048 | PAFAH1B1 | F007 | Human | Colorectum | FAP | 1.41e-03 | -2.21e-01 | 0.1176 |
| 5048 | PAFAH1B1 | A002-C-010 | Human | Colorectum | FAP | 5.59e-03 | -2.39e-01 | 0.242 |
| 5048 | PAFAH1B1 | A001-C-207 | Human | Colorectum | FAP | 1.29e-02 | -1.27e-01 | 0.1278 |
| 5048 | PAFAH1B1 | A015-C-203 | Human | Colorectum | FAP | 2.48e-35 | -4.58e-01 | -0.1294 |
| 5048 | PAFAH1B1 | A015-C-204 | Human | Colorectum | FAP | 2.32e-09 | -3.89e-01 | -0.0228 |
| 5048 | PAFAH1B1 | A014-C-040 | Human | Colorectum | FAP | 2.33e-04 | -3.02e-01 | -0.1184 |
| 5048 | PAFAH1B1 | A002-C-201 | Human | Colorectum | FAP | 3.37e-16 | -3.89e-01 | 0.0324 |
| 5048 | PAFAH1B1 | A002-C-203 | Human | Colorectum | FAP | 2.33e-08 | -3.22e-01 | 0.2786 |
| 5048 | PAFAH1B1 | A001-C-119 | Human | Colorectum | FAP | 1.64e-09 | -2.88e-01 | -0.1557 |
| 5048 | PAFAH1B1 | A001-C-108 | Human | Colorectum | FAP | 9.52e-20 | -2.40e-01 | -0.0272 |
| 5048 | PAFAH1B1 | A002-C-205 | Human | Colorectum | FAP | 1.05e-27 | -4.63e-01 | -0.1236 |
| Page: 1 2 3 4 5 6 7 8 9 10 11 |
| Tissue | Expression Dynamics | Abbreviation |
| Cervix | 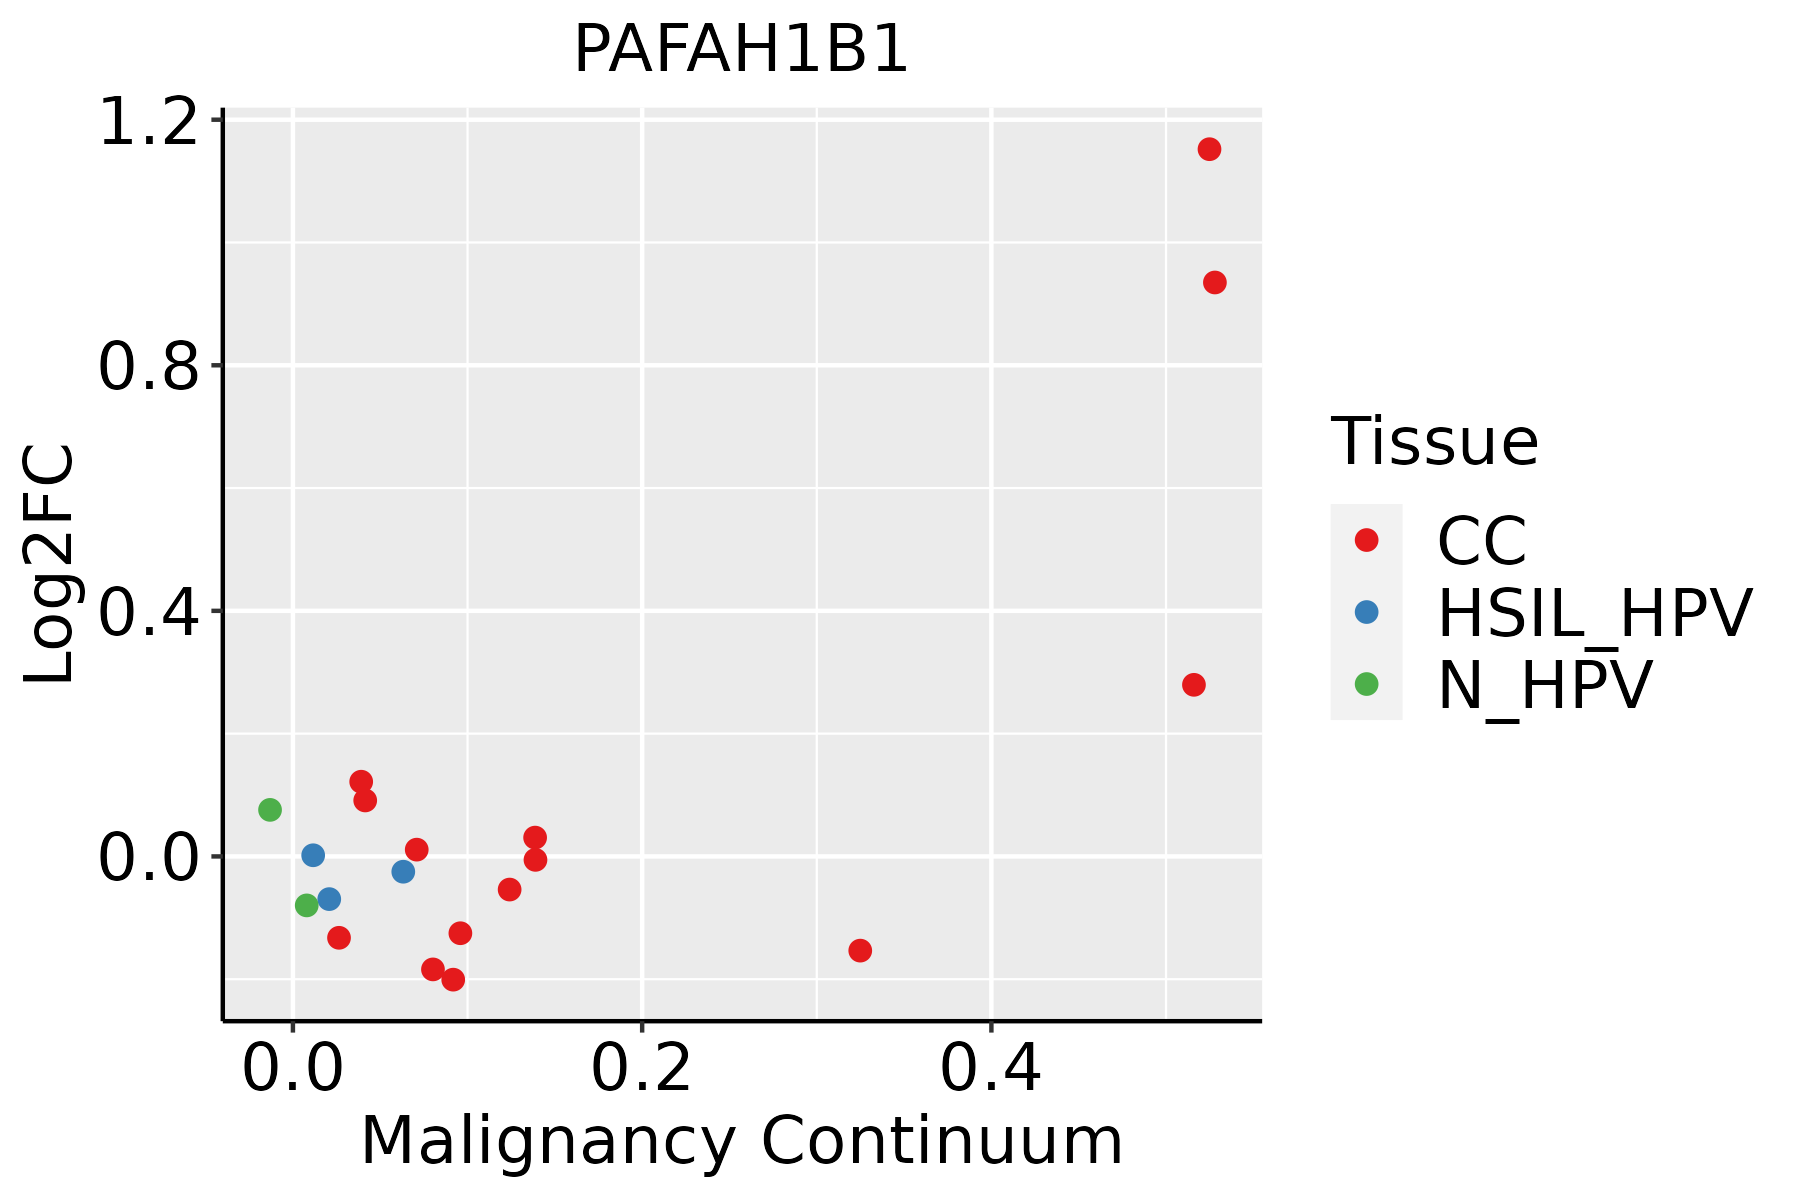 | CC: Cervix cancer |
| HSIL_HPV: HPV-infected high-grade squamous intraepithelial lesions | ||
| N_HPV: HPV-infected normal cervix | ||
| Colorectum (GSE201348) |  | FAP: Familial adenomatous polyposis |
| CRC: Colorectal cancer | ||
| Colorectum (HTA11) |  | AD: Adenomas |
| SER: Sessile serrated lesions | ||
| MSI-H: Microsatellite-high colorectal cancer | ||
| MSS: Microsatellite stable colorectal cancer | ||
| Esophagus | 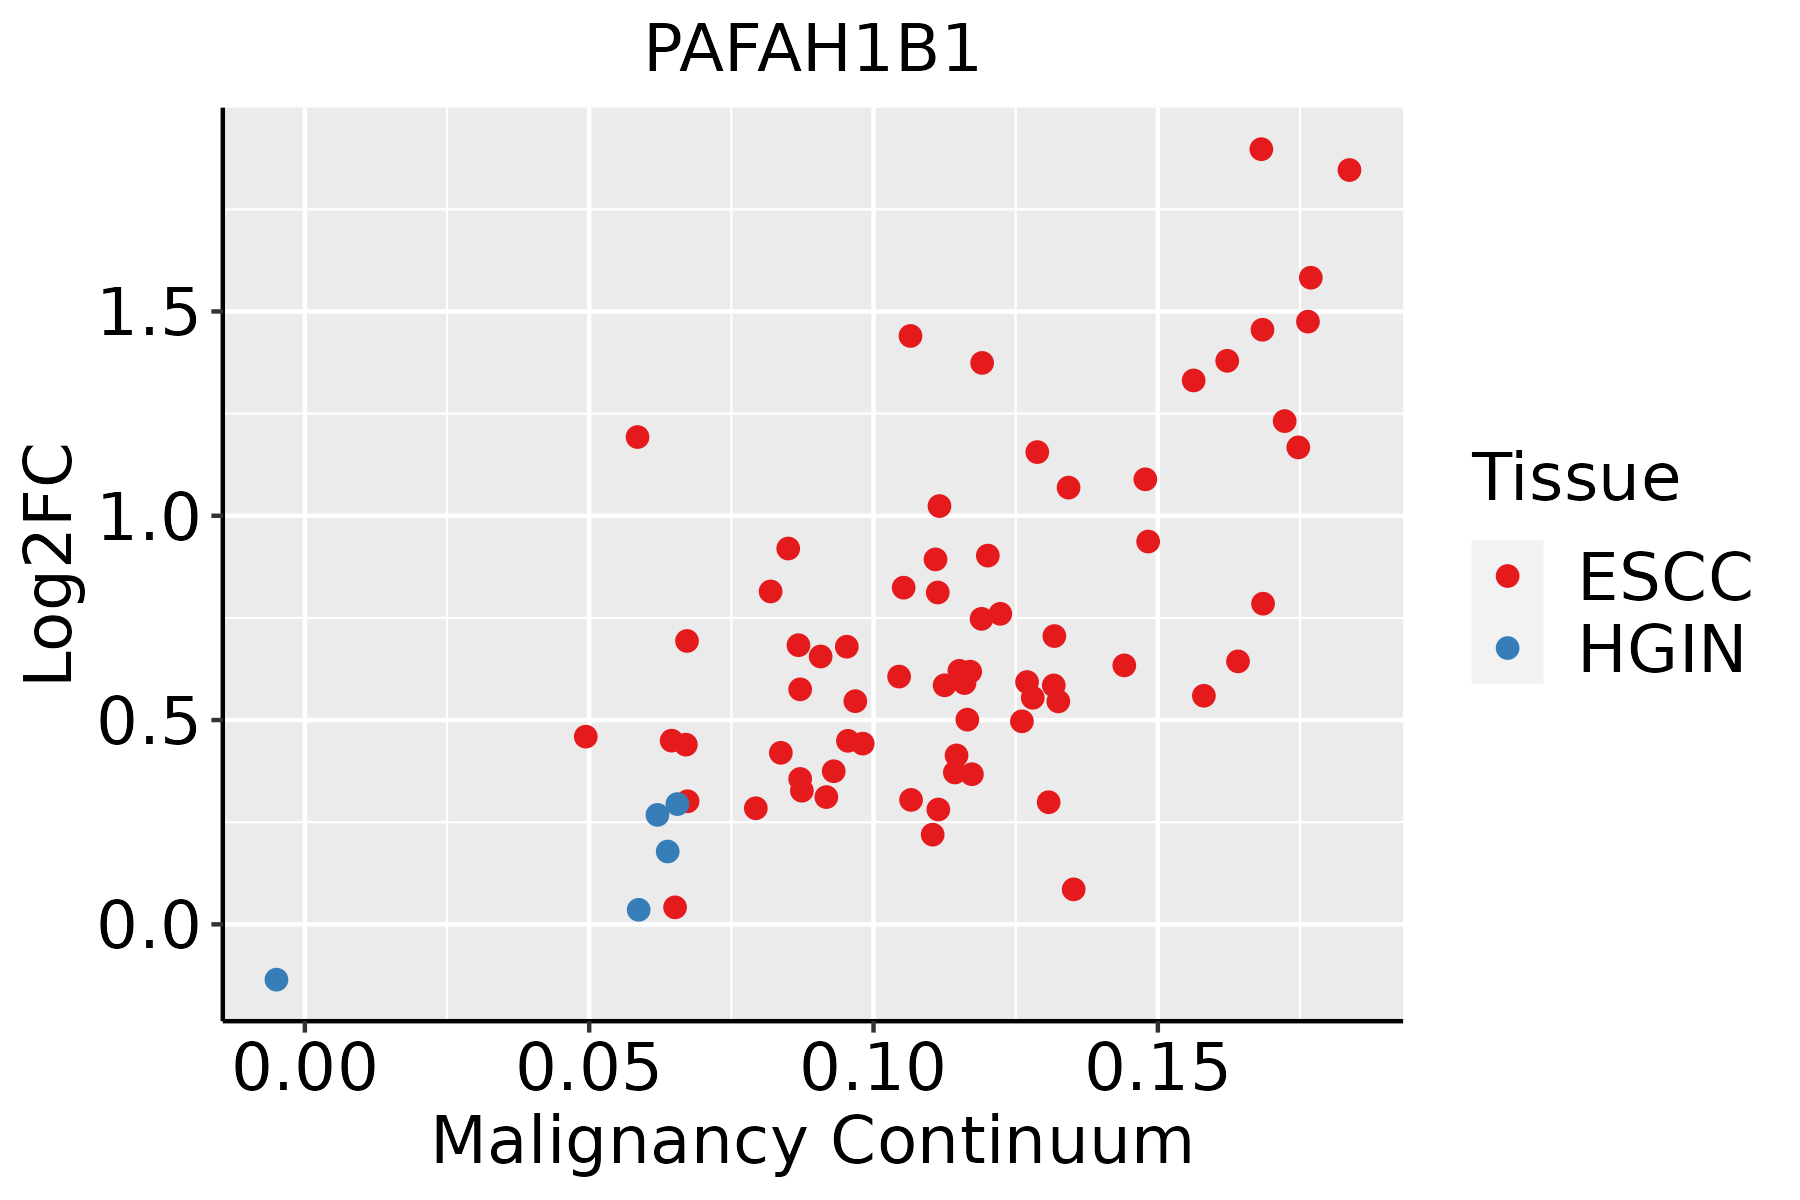 | ESCC: Esophageal squamous cell carcinoma |
| HGIN: High-grade intraepithelial neoplasias | ||
| LGIN: Low-grade intraepithelial neoplasias | ||
| GC | 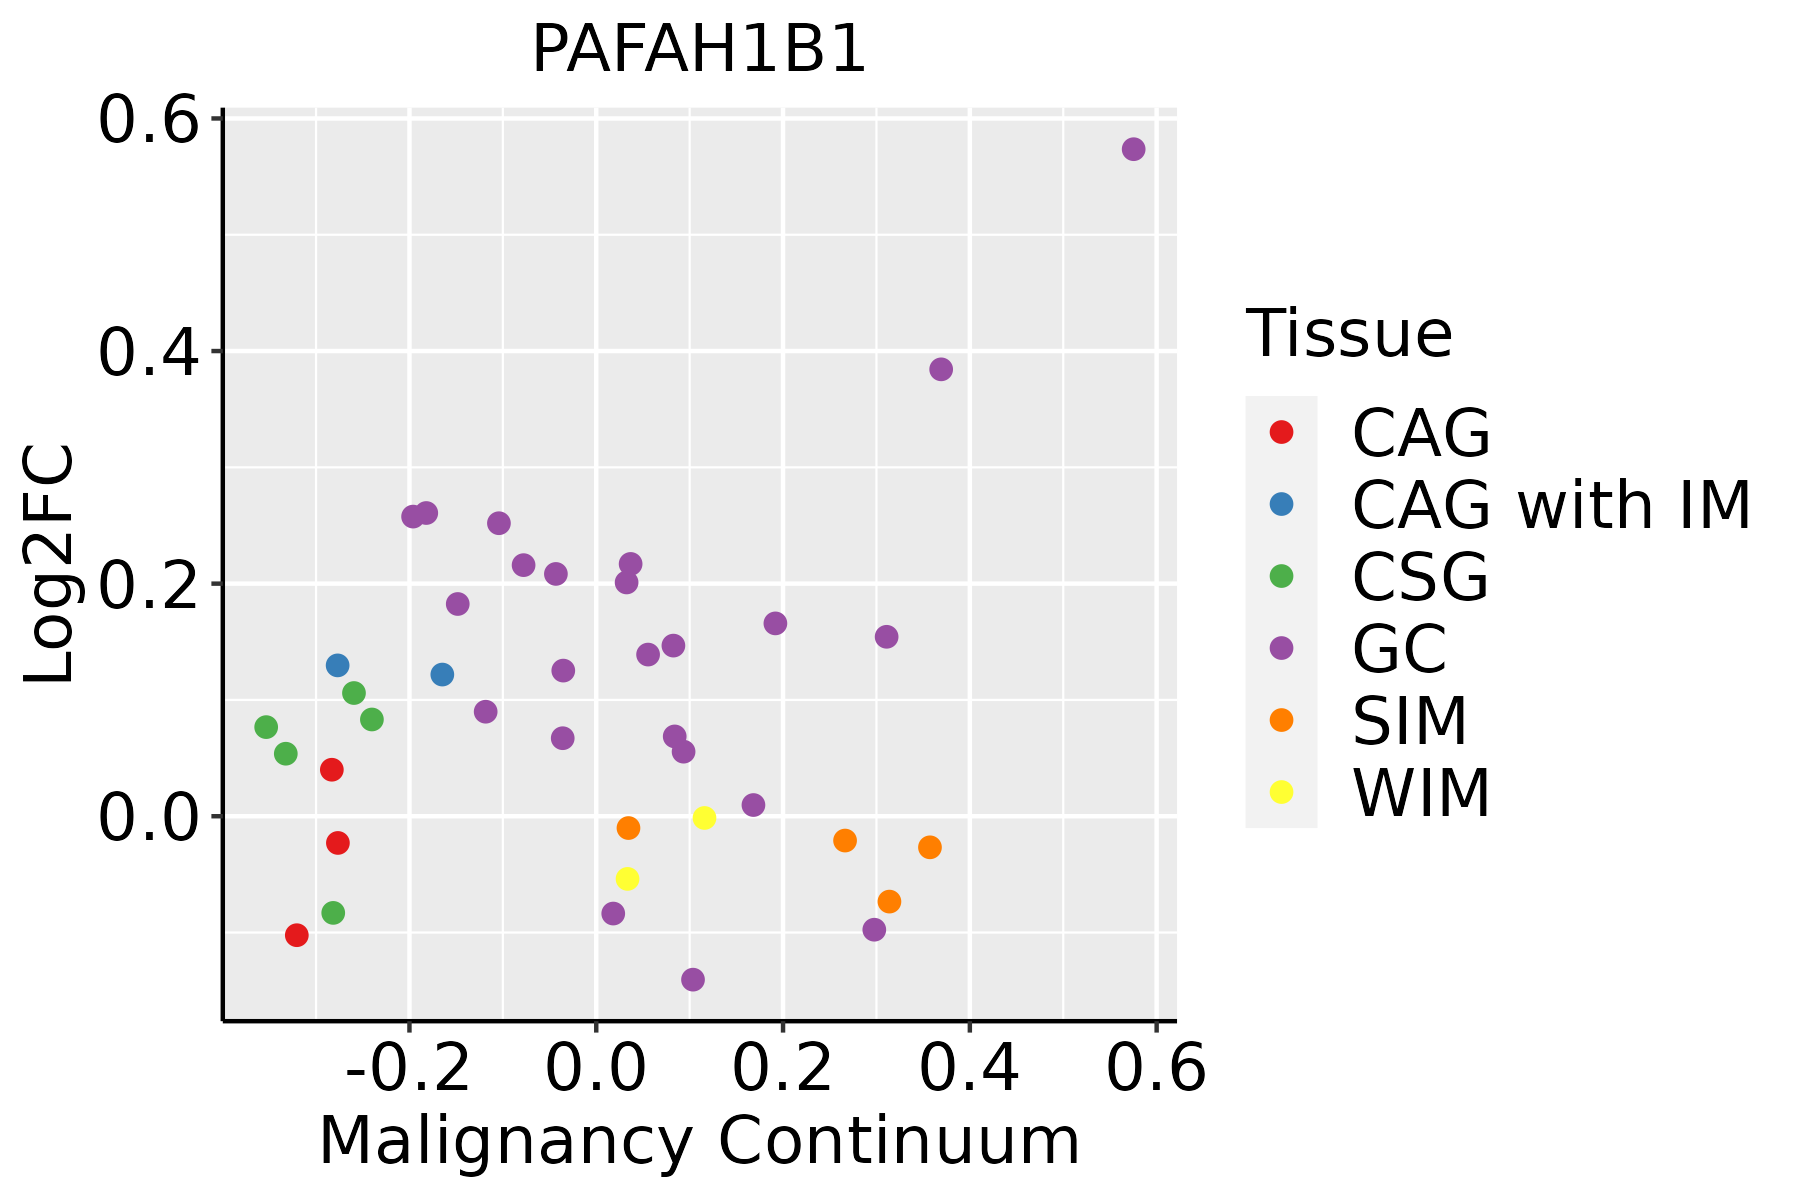 | CAG: Chronic atrophic gastritis |
| CAG with IM: Chronic atrophic gastritis with intestinal metaplasia | ||
| CSG: Chronic superficial gastritis | ||
| GC: Gastric cancer | ||
| SIM: Severe intestinal metaplasia | ||
| WIM: Wild intestinal metaplasia | ||
| Liver |  | HCC: Hepatocellular carcinoma |
| NAFLD: Non-alcoholic fatty liver disease | ||
| Lung | 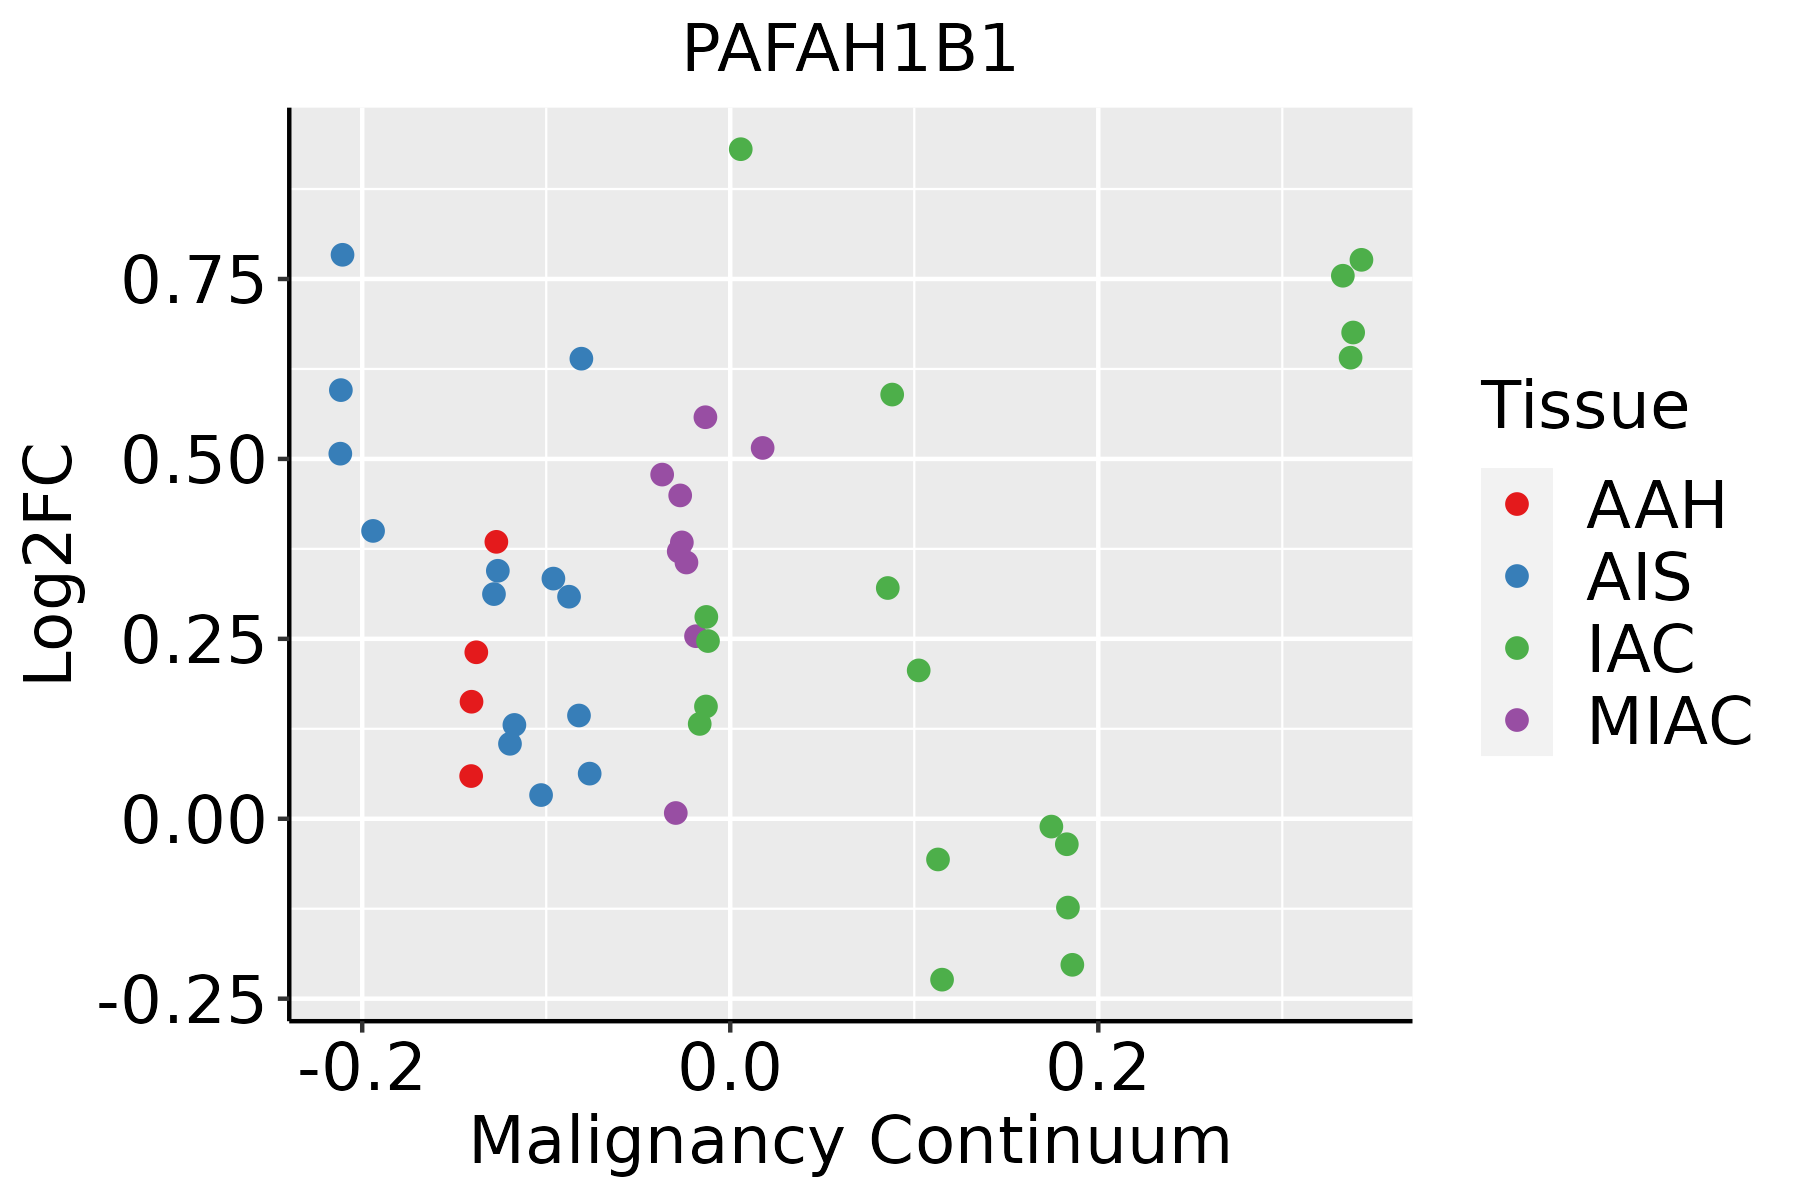 | AAH: Atypical adenomatous hyperplasia |
| AIS: Adenocarcinoma in situ | ||
| IAC: Invasive lung adenocarcinoma | ||
| MIA: Minimally invasive adenocarcinoma | ||
| Oral Cavity | 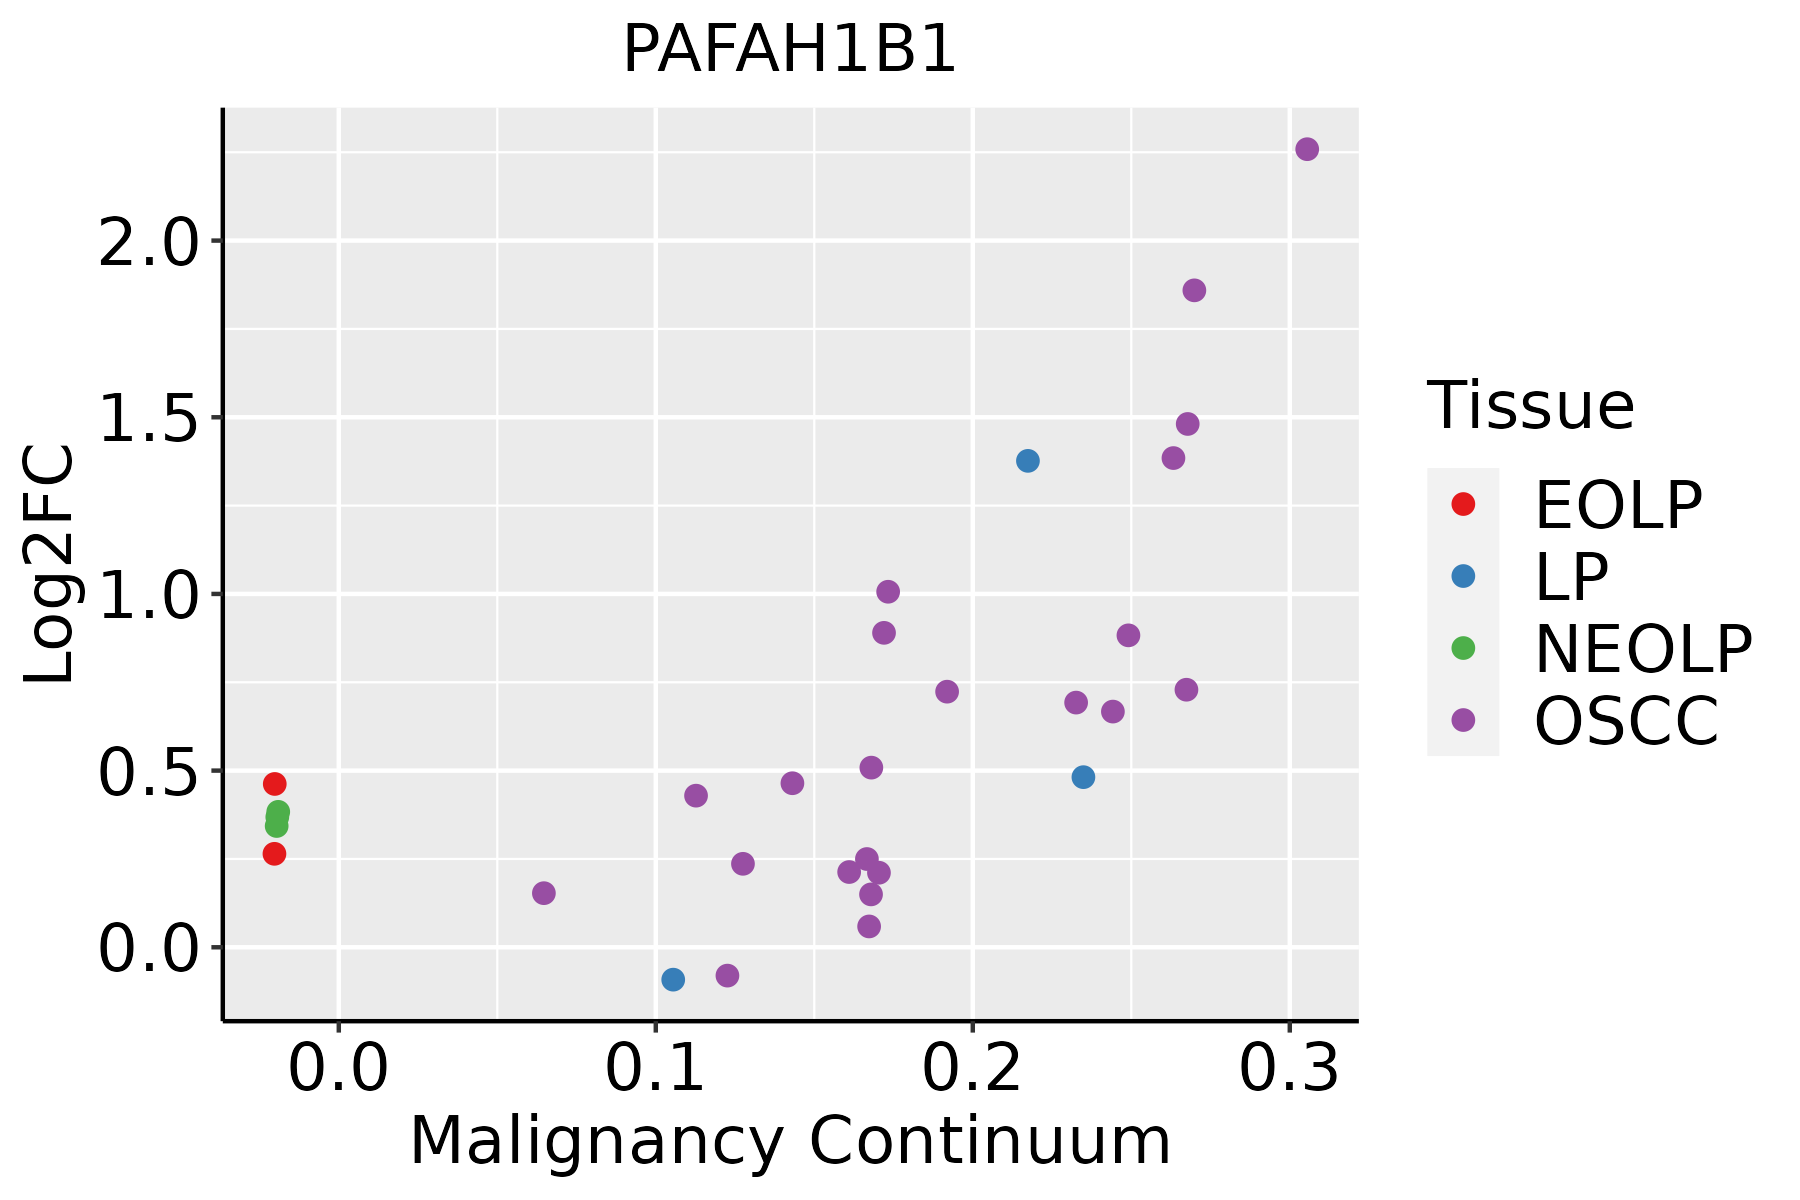 | EOLP: Erosive Oral lichen planus |
| LP: leukoplakia | ||
| NEOLP: Non-erosive oral lichen planus | ||
| OSCC: Oral squamous cell carcinoma | ||
| Prostate |  | BPH: Benign Prostatic Hyperplasia |
| Skin | 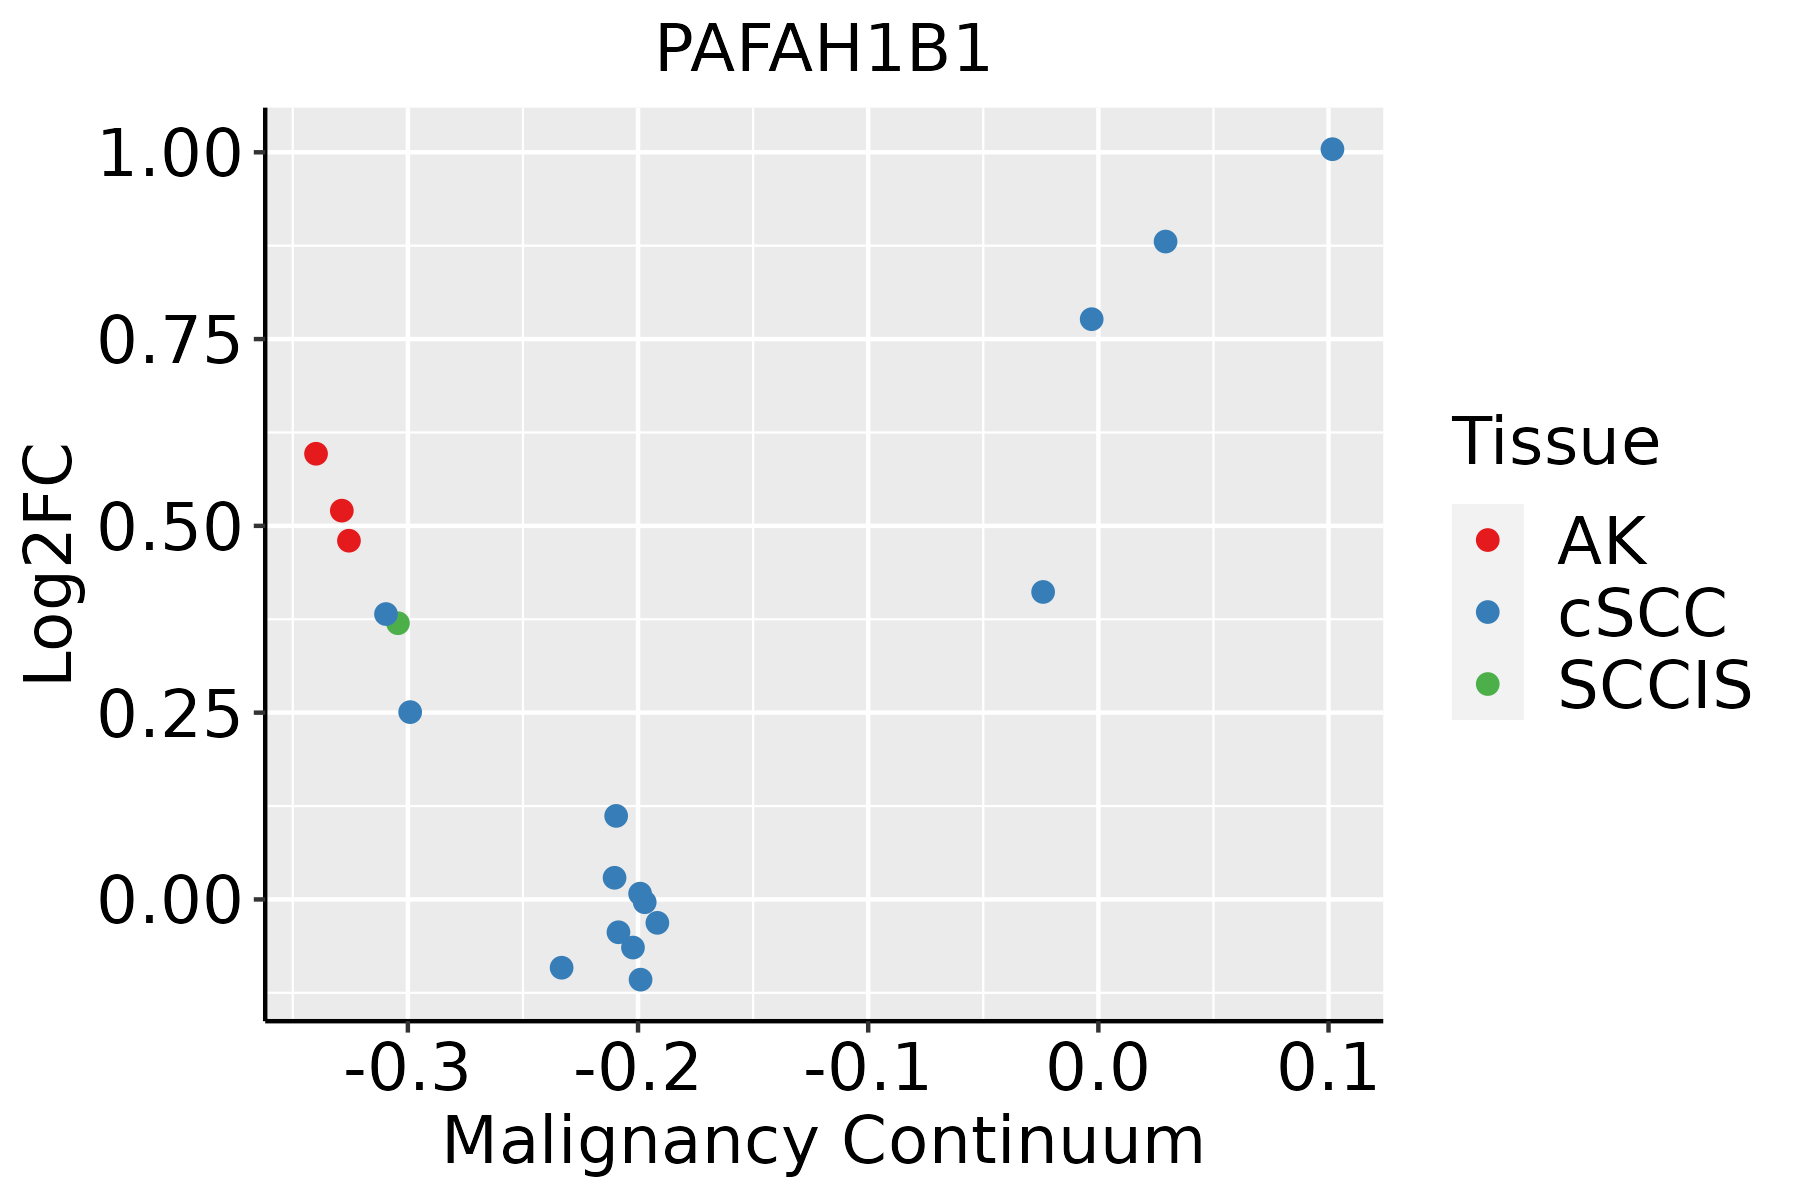 | AK: Actinic keratosis |
| cSCC: Cutaneous squamous cell carcinoma | ||
| SCCIS:squamous cell carcinoma in situ | ||
| Thyroid |  | ATC: Anaplastic thyroid cancer |
| HT: Hashimoto's thyroiditis | ||
| PTC: Papillary thyroid cancer |
| ∗log2FC in expression of this searched gene in stem-like cells from each diseased tissue sample relative to stem-like cells in normal samples in each tissue plotted against the malignancy continuum. Samples are colored based on if they are from different disease stage. |
Top |
Malignant transformation related pathway analysis |
| Find out the enriched GO biological processes and KEGG pathways involved in transition from healthy to precancer to cancer |
| Tissue | Disease Stage | Enriched GO biological Processes |
| Colorectum | AD |  |
| Colorectum | SER |  |
| Colorectum | MSS |  |
| Colorectum | MSI-H |  |
| Colorectum | FAP |  |
| ∗Top 15 enriched GO BP terms are showed in the bar plot of each disease state in each tissue. Each row represents a significant GO biological process which is colored according to the -log10(p.adjust). |
| Page: 1 2 3 4 5 6 7 8 9 |
| GO ID | Tissue | Disease Stage | Description | Gene Ratio | Bg Ratio | pvalue | p.adjust | Count |
| GO:002260410 | Cervix | CC | regulation of cell morphogenesis | 84/2311 | 309/18723 | 1.00e-12 | 4.29e-10 | 84 |
| GO:00016679 | Cervix | CC | ameboidal-type cell migration | 110/2311 | 475/18723 | 2.66e-11 | 6.36e-09 | 110 |
| GO:00085446 | Cervix | CC | epidermis development | 83/2311 | 324/18723 | 3.91e-11 | 8.54e-09 | 83 |
| GO:00071639 | Cervix | CC | establishment or maintenance of cell polarity | 63/2311 | 218/18723 | 4.25e-11 | 8.76e-09 | 63 |
| GO:00512359 | Cervix | CC | maintenance of location | 78/2311 | 327/18723 | 5.18e-09 | 4.92e-07 | 78 |
| GO:00430877 | Cervix | CC | regulation of GTPase activity | 79/2311 | 348/18723 | 4.21e-08 | 2.60e-06 | 79 |
| GO:00300108 | Cervix | CC | establishment of cell polarity | 42/2311 | 143/18723 | 4.30e-08 | 2.62e-06 | 42 |
| GO:00099137 | Cervix | CC | epidermal cell differentiation | 53/2311 | 202/18723 | 5.48e-08 | 3.25e-06 | 53 |
| GO:005165110 | Cervix | CC | maintenance of location in cell | 55/2311 | 214/18723 | 6.63e-08 | 3.85e-06 | 55 |
| GO:003009910 | Cervix | CC | myeloid cell differentiation | 83/2311 | 381/18723 | 1.31e-07 | 6.42e-06 | 83 |
| GO:00107699 | Cervix | CC | regulation of cell morphogenesis involved in differentiation | 31/2311 | 96/18723 | 2.43e-07 | 1.05e-05 | 31 |
| GO:00163587 | Cervix | CC | dendrite development | 58/2311 | 243/18723 | 4.52e-07 | 1.76e-05 | 58 |
| GO:00310988 | Cervix | CC | stress-activated protein kinase signaling cascade | 58/2311 | 247/18723 | 8.02e-07 | 2.89e-05 | 58 |
| GO:00514038 | Cervix | CC | stress-activated MAPK cascade | 55/2311 | 239/18723 | 2.96e-06 | 8.31e-05 | 55 |
| GO:00109757 | Cervix | CC | regulation of neuron projection development | 88/2311 | 445/18723 | 4.26e-06 | 1.09e-04 | 88 |
| GO:00107206 | Cervix | CC | positive regulation of cell development | 64/2311 | 298/18723 | 5.69e-06 | 1.41e-04 | 64 |
| GO:00457876 | Cervix | CC | positive regulation of cell cycle | 66/2311 | 313/18723 | 7.78e-06 | 1.81e-04 | 66 |
| GO:00703027 | Cervix | CC | regulation of stress-activated protein kinase signaling cascade | 46/2311 | 195/18723 | 9.35e-06 | 2.11e-04 | 46 |
| GO:00313467 | Cervix | CC | positive regulation of cell projection organization | 72/2311 | 353/18723 | 1.04e-05 | 2.32e-04 | 72 |
| GO:00160498 | Cervix | CC | cell growth | 92/2311 | 482/18723 | 1.16e-05 | 2.49e-04 | 92 |
| Page: 1 2 3 4 5 6 7 8 9 10 11 12 13 14 15 16 17 18 19 20 21 22 23 24 25 26 27 28 29 30 31 32 33 34 35 36 37 38 39 40 41 42 43 44 45 46 47 48 49 50 51 52 53 54 55 56 57 58 59 60 61 62 63 64 65 66 67 68 69 70 71 72 73 74 75 76 77 78 79 80 81 82 83 84 85 86 87 88 89 90 91 92 93 94 95 96 97 |
| Pathway ID | Tissue | Disease Stage | Description | Gene Ratio | Bg Ratio | pvalue | p.adjust | qvalue | Count |
| Page: 1 |
Top |
Cell-cell communication analysis |
| Identification of potential cell-cell interactions between two cell types and their ligand-receptor pairs for different disease states |
| Ligand | Receptor | LRpair | Pathway | Tissue | Disease Stage |
| Page: 1 |
Top |
Single-cell gene regulatory network inference analysis |
| Find out the significant the regulons (TFs) and the target genes of each regulon across cell types for different disease states |
| TF | Cell Type | Tissue | Disease Stage | Target Gene | RSS | Regulon Activity |
| ∗The dot plots of a searched regulon are shown for all cell subpopulations in each disease state of each tissue based on the regulon specific score inferred using pySCENIC and by calculating the average expression. |
| Page: 1 |
Top |
Somatic mutation of malignant transformation related genes |
| Annotation of somatic variants for genes involved in malignant transformation |
| Hugo Symbol | Variant Class | Variant Classification | dbSNP RS | HGVSc | HGVSp | HGVSp Short | SWISSPROT | BIOTYPE | SIFT | PolyPhen | Tumor Sample Barcode | Tissue | Histology | Sex | Age | Stage | Therapy Types | Drugs | Outcome |
| PAFAH1B1 | SNV | Missense_Mutation | c.1062N>C | p.Leu354Phe | p.L354F | P43034 | protein_coding | tolerated(0.06) | benign(0.112) | TCGA-A2-A04W-01 | Breast | breast invasive carcinoma | Female | <65 | I/II | Chemotherapy | cytoxan | SD | |
| PAFAH1B1 | SNV | Missense_Mutation | c.603N>T | p.Met201Ile | p.M201I | P43034 | protein_coding | tolerated(0.6) | benign(0.203) | TCGA-A8-A07P-01 | Breast | breast invasive carcinoma | Female | >=65 | I/II | Chemotherapy | 5-fluorouracil | SD | |
| PAFAH1B1 | SNV | Missense_Mutation | c.170N>G | p.Ser57Cys | p.S57C | P43034 | protein_coding | deleterious(0) | probably_damaging(0.976) | TCGA-E2-A10C-01 | Breast | breast invasive carcinoma | Female | <65 | I/II | Chemotherapy | cytoxan | SD | |
| PAFAH1B1 | deletion | Frame_Shift_Del | novel | c.1045delN | p.Lys351SerfsTer4 | p.K351Sfs*4 | P43034 | protein_coding | TCGA-D8-A27V-01 | Breast | breast invasive carcinoma | Female | <65 | I/II | Hormone Therapy | tamoxiphen | SD | ||
| PAFAH1B1 | SNV | Missense_Mutation | novel | c.19N>G | p.Gln7Glu | p.Q7E | P43034 | protein_coding | deleterious(0) | possibly_damaging(0.709) | TCGA-2W-A8YY-01 | Cervix | cervical & endocervical cancer | Female | <65 | I/II | Chemotherapy | cisplatin | CR |
| PAFAH1B1 | SNV | Missense_Mutation | novel | c.1162N>G | p.Phe388Val | p.F388V | P43034 | protein_coding | tolerated(0.16) | benign(0.07) | TCGA-EA-A3HU-01 | Cervix | cervical & endocervical cancer | Female | <65 | I/II | Unknown | Unknown | SD |
| PAFAH1B1 | SNV | Missense_Mutation | c.239N>T | p.Thr80Met | p.T80M | P43034 | protein_coding | tolerated(0.11) | benign(0.206) | TCGA-AA-3672-01 | Colorectum | colon adenocarcinoma | Female | >=65 | III/IV | Unknown | Unknown | SD | |
| PAFAH1B1 | SNV | Missense_Mutation | novel | c.212N>G | p.Lys71Arg | p.K71R | P43034 | protein_coding | tolerated(1) | benign(0.005) | TCGA-AA-3845-01 | Colorectum | colon adenocarcinoma | Female | >=65 | I/II | Unknown | Unknown | PD |
| PAFAH1B1 | SNV | Missense_Mutation | c.431N>A | p.Arg144Gln | p.R144Q | P43034 | protein_coding | tolerated(0.06) | benign(0.3) | TCGA-AA-3977-01 | Colorectum | colon adenocarcinoma | Male | >=65 | I/II | Unknown | Unknown | SD | |
| PAFAH1B1 | SNV | Missense_Mutation | c.1112N>A | p.Arg371Gln | p.R371Q | P43034 | protein_coding | deleterious(0.04) | possibly_damaging(0.5) | TCGA-CM-6162-01 | Colorectum | colon adenocarcinoma | Female | <65 | III/IV | Chemotherapy | oxaliplatin | SD |
| Page: 1 2 3 4 5 |
Top |
Related drugs of malignant transformation related genes |
| Identification of chemicals and drugs interact with genes involved in malignant transfromation |
| (DGIdb 4.0) |
| Entrez ID | Symbol | Category | Interaction Types | Drug Claim Name | Drug Name | PMIDs |
| Page: 1 |

Copyright 2023-Present -The University of Texas Health Science Center at Houston |