
|
|||||
|
 | |
| |
| |
| |
| |
| |
|
Gene: PADI3 |
Gene summary for PADI3 |
| Gene information | Species | Human | Gene symbol | PADI3 | Gene ID | 51702 |
| Gene name | peptidyl arginine deiminase 3 | |
| Gene Alias | PAD3 | |
| Cytomap | 1p36.13 | |
| Gene Type | protein-coding | GO ID | GO:0006464 | UniProtAcc | Q9ULW8 |
Top |
Malignant transformation analysis |
| Identification of the aberrant gene expression in precancerous and cancerous lesions by comparing the gene expression of stem-like cells in diseased tissues with normal stem cells |
| Entrez ID | Symbol | Replicates | Species | Organ | Tissue | Adj P-value | Log2FC | Malignancy |
| 51702 | PADI3 | LZE8T | Human | Esophagus | ESCC | 3.74e-03 | 2.28e-01 | 0.067 |
| 51702 | PADI3 | LZE20T | Human | Esophagus | ESCC | 4.10e-03 | 2.24e-01 | 0.0662 |
| 51702 | PADI3 | LZE24T | Human | Esophagus | ESCC | 2.20e-07 | 2.60e-01 | 0.0596 |
| 51702 | PADI3 | P2T-E | Human | Esophagus | ESCC | 1.13e-11 | 3.52e-01 | 0.1177 |
| 51702 | PADI3 | P4T-E | Human | Esophagus | ESCC | 2.76e-16 | 3.93e-01 | 0.1323 |
| 51702 | PADI3 | P8T-E | Human | Esophagus | ESCC | 2.59e-15 | 4.57e-01 | 0.0889 |
| 51702 | PADI3 | P11T-E | Human | Esophagus | ESCC | 2.51e-07 | 5.21e-01 | 0.1426 |
| 51702 | PADI3 | P12T-E | Human | Esophagus | ESCC | 1.55e-08 | 2.84e-01 | 0.1122 |
| 51702 | PADI3 | P15T-E | Human | Esophagus | ESCC | 3.07e-08 | 3.20e-01 | 0.1149 |
| 51702 | PADI3 | P20T-E | Human | Esophagus | ESCC | 1.55e-04 | 1.85e-01 | 0.1124 |
| 51702 | PADI3 | P22T-E | Human | Esophagus | ESCC | 8.31e-26 | 4.79e-01 | 0.1236 |
| 51702 | PADI3 | P27T-E | Human | Esophagus | ESCC | 4.52e-35 | 7.23e-01 | 0.1055 |
| 51702 | PADI3 | P31T-E | Human | Esophagus | ESCC | 2.03e-03 | 1.61e-01 | 0.1251 |
| 51702 | PADI3 | P37T-E | Human | Esophagus | ESCC | 1.05e-15 | 4.19e-01 | 0.1371 |
| 51702 | PADI3 | P42T-E | Human | Esophagus | ESCC | 2.69e-04 | 2.29e-01 | 0.1175 |
| 51702 | PADI3 | P44T-E | Human | Esophagus | ESCC | 1.05e-05 | 2.27e-01 | 0.1096 |
| 51702 | PADI3 | P49T-E | Human | Esophagus | ESCC | 4.99e-14 | 1.26e+00 | 0.1768 |
| 51702 | PADI3 | P54T-E | Human | Esophagus | ESCC | 2.79e-22 | 4.78e-01 | 0.0975 |
| 51702 | PADI3 | P56T-E | Human | Esophagus | ESCC | 1.06e-02 | 2.84e-01 | 0.1613 |
| 51702 | PADI3 | P57T-E | Human | Esophagus | ESCC | 1.29e-11 | 5.19e-01 | 0.0926 |
| Page: 1 2 |
| Tissue | Expression Dynamics | Abbreviation |
| Esophagus | 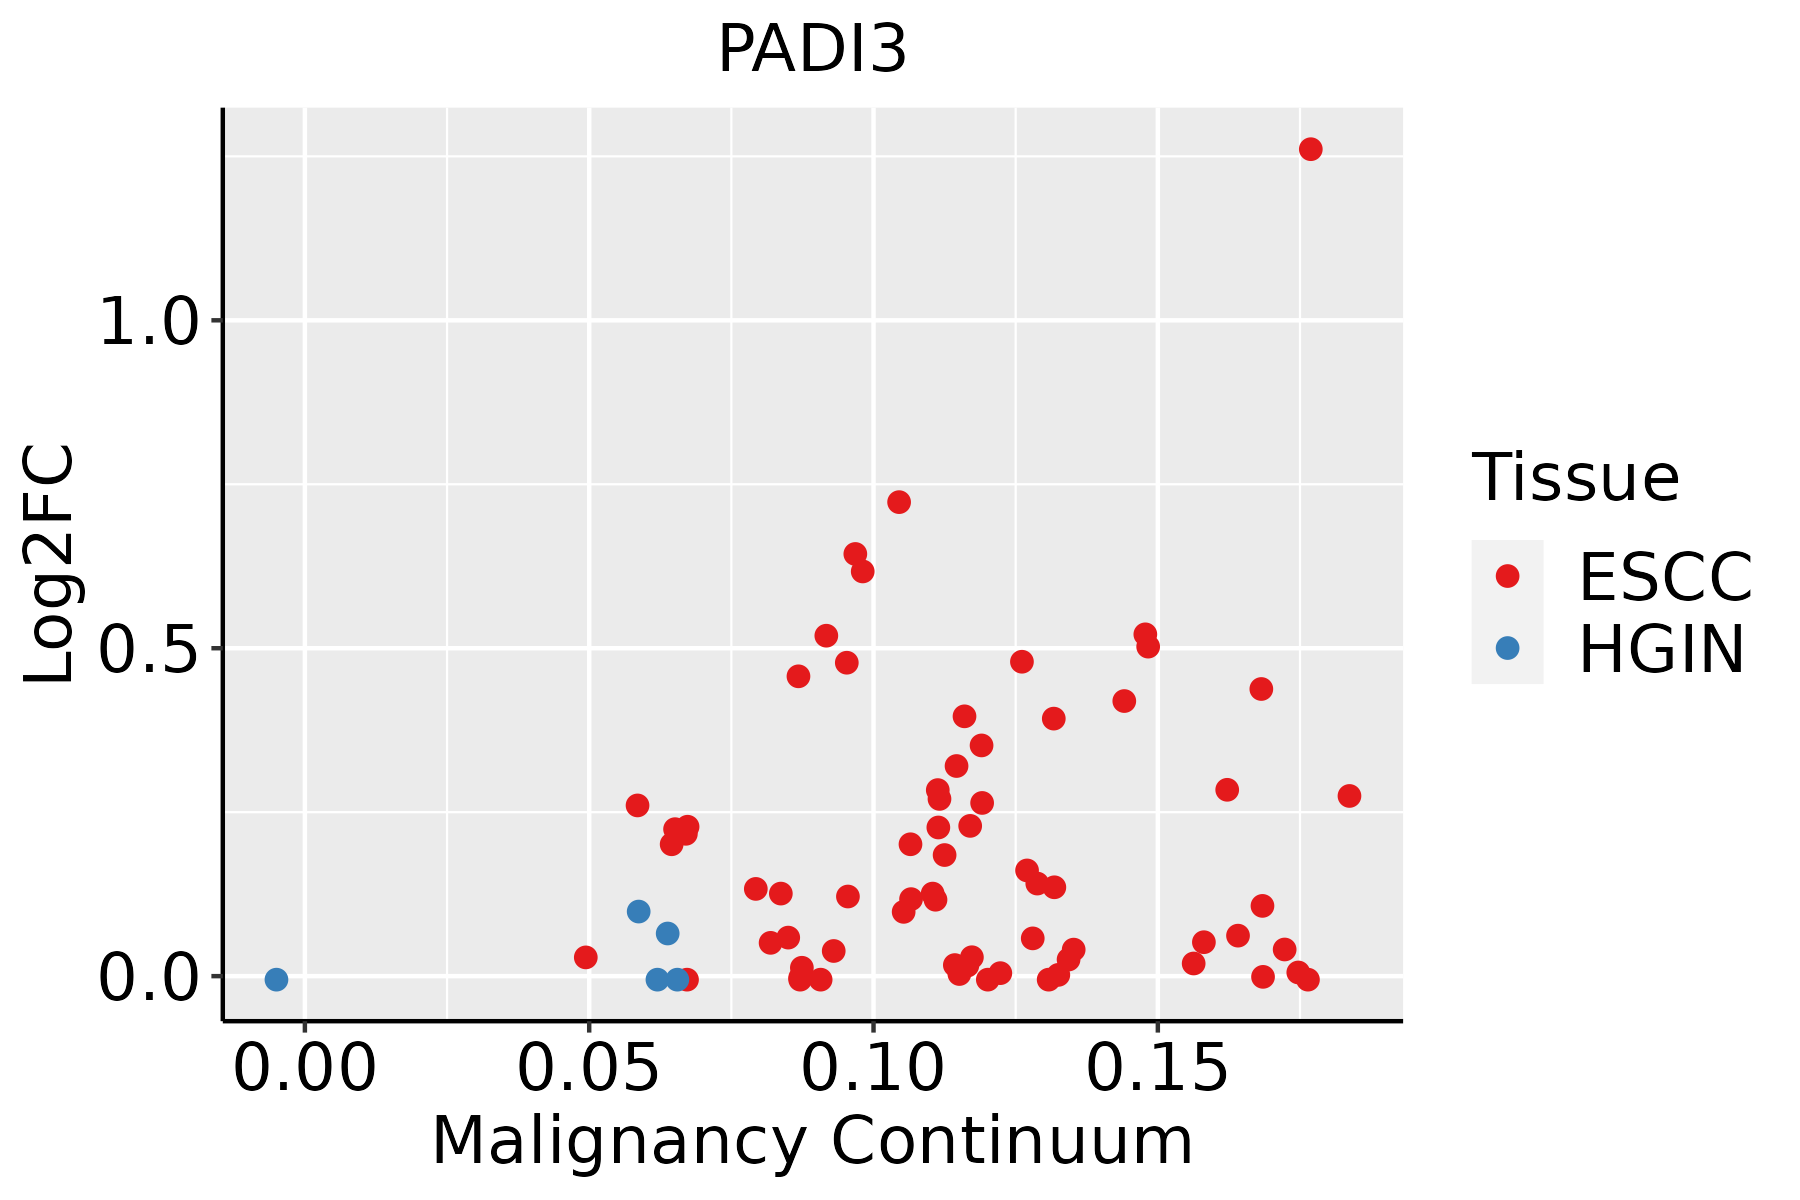 | ESCC: Esophageal squamous cell carcinoma |
| HGIN: High-grade intraepithelial neoplasias | ||
| LGIN: Low-grade intraepithelial neoplasias | ||
| Oral Cavity |  | EOLP: Erosive Oral lichen planus |
| LP: leukoplakia | ||
| NEOLP: Non-erosive oral lichen planus | ||
| OSCC: Oral squamous cell carcinoma |
| ∗log2FC in expression of this searched gene in stem-like cells from each diseased tissue sample relative to stem-like cells in normal samples in each tissue plotted against the malignancy continuum. Samples are colored based on if they are from different disease stage. |
Top |
Malignant transformation related pathway analysis |
| Find out the enriched GO biological processes and KEGG pathways involved in transition from healthy to precancer to cancer |
| Tissue | Disease Stage | Enriched GO biological Processes |
| Colorectum | AD |  |
| Colorectum | SER |  |
| Colorectum | MSS |  |
| Colorectum | MSI-H |  |
| Colorectum | FAP |  |
| ∗Top 15 enriched GO BP terms are showed in the bar plot of each disease state in each tissue. Each row represents a significant GO biological process which is colored according to the -log10(p.adjust). |
| Page: 1 2 3 4 5 6 7 8 9 |
| GO ID | Tissue | Disease Stage | Description | Gene Ratio | Bg Ratio | pvalue | p.adjust | Count |
| GO:001657015 | Esophagus | ESCC | histone modification | 323/8552 | 463/18723 | 2.61e-26 | 7.88e-24 | 323 |
| GO:00165707 | Oral cavity | OSCC | histone modification | 270/7305 | 463/18723 | 1.59e-17 | 1.50e-15 | 270 |
| GO:001657014 | Oral cavity | LP | histone modification | 152/4623 | 463/18723 | 4.04e-05 | 5.90e-04 | 152 |
| Page: 1 |
| Pathway ID | Tissue | Disease Stage | Description | Gene Ratio | Bg Ratio | pvalue | p.adjust | qvalue | Count |
| Page: 1 |
Top |
Cell-cell communication analysis |
| Identification of potential cell-cell interactions between two cell types and their ligand-receptor pairs for different disease states |
| Ligand | Receptor | LRpair | Pathway | Tissue | Disease Stage |
| Page: 1 |
Top |
Single-cell gene regulatory network inference analysis |
| Find out the significant the regulons (TFs) and the target genes of each regulon across cell types for different disease states |
| TF | Cell Type | Tissue | Disease Stage | Target Gene | RSS | Regulon Activity |
| ∗The dot plots of a searched regulon are shown for all cell subpopulations in each disease state of each tissue based on the regulon specific score inferred using pySCENIC and by calculating the average expression. |
| Page: 1 |
Top |
Somatic mutation of malignant transformation related genes |
| Annotation of somatic variants for genes involved in malignant transformation |
| Hugo Symbol | Variant Class | Variant Classification | dbSNP RS | HGVSc | HGVSp | HGVSp Short | SWISSPROT | BIOTYPE | SIFT | PolyPhen | Tumor Sample Barcode | Tissue | Histology | Sex | Age | Stage | Therapy Types | Drugs | Outcome |
| PADI3 | SNV | Missense_Mutation | c.1574N>T | p.Thr525Ile | p.T525I | Q9ULW8 | protein_coding | tolerated(0.17) | benign(0.273) | TCGA-A8-A08F-01 | Breast | breast invasive carcinoma | Female | <65 | III/IV | Chemotherapy | 5-fluorouracil | CR | |
| PADI3 | SNV | Missense_Mutation | novel | c.1930N>C | p.Val644Leu | p.V644L | Q9ULW8 | protein_coding | deleterious(0.02) | possibly_damaging(0.871) | TCGA-A8-A08H-01 | Breast | breast invasive carcinoma | Female | >=65 | I/II | Unknown | Unknown | SD |
| PADI3 | SNV | Missense_Mutation | novel | c.1687N>A | p.Glu563Lys | p.E563K | Q9ULW8 | protein_coding | deleterious(0) | possibly_damaging(0.686) | TCGA-AC-A6IW-01 | Breast | breast invasive carcinoma | Female | >=65 | I/II | Unknown | Unknown | SD |
| PADI3 | SNV | Missense_Mutation | novel | c.935G>C | p.Arg312Pro | p.R312P | Q9ULW8 | protein_coding | deleterious(0.05) | possibly_damaging(0.552) | TCGA-B6-A0IK-01 | Breast | breast invasive carcinoma | Female | <65 | III/IV | Unknown | Unknown | PD |
| PADI3 | SNV | Missense_Mutation | c.1708N>T | p.Pro570Ser | p.P570S | Q9ULW8 | protein_coding | deleterious(0) | probably_damaging(1) | TCGA-BH-A0HF-01 | Breast | breast invasive carcinoma | Female | >=65 | I/II | Hormone Therapy | arimidex | SD | |
| PADI3 | SNV | Missense_Mutation | novel | c.1906N>G | p.Pro636Ala | p.P636A | Q9ULW8 | protein_coding | tolerated(0.27) | benign(0.081) | TCGA-BH-A2L8-01 | Breast | breast invasive carcinoma | Female | <65 | I/II | Chemotherapy | cytoxan | CR |
| PADI3 | SNV | Missense_Mutation | c.1053G>C | p.Glu351Asp | p.E351D | Q9ULW8 | protein_coding | deleterious(0.01) | possibly_damaging(0.538) | TCGA-C8-A1HM-01 | Breast | breast invasive carcinoma | Female | >=65 | I/II | Chemotherapy | doxorubicin | CR | |
| PADI3 | insertion | Frame_Shift_Ins | novel | c.1928_1929insACCTGTCCACACCACCATT | p.Val644ProfsTer56 | p.V644Pfs*56 | Q9ULW8 | protein_coding | TCGA-A8-A08H-01 | Breast | breast invasive carcinoma | Female | >=65 | I/II | Unknown | Unknown | SD | ||
| PADI3 | insertion | In_Frame_Ins | novel | c.1394_1395insCCTTGAAGAGAGCCAGAAGCAAGGAAT | p.Trp465delinsCysLeuGluGluSerGlnLysGlnGlyMet | p.W465delinsCLEESQKQGM | Q9ULW8 | protein_coding | TCGA-AO-A0J9-01 | Breast | breast invasive carcinoma | Female | <65 | III/IV | Chemotherapy | cyclophosphamide | PD | ||
| PADI3 | insertion | In_Frame_Ins | novel | c.581_582insCCCCAAATTCTCATTGAATCATCCAAG | p.Phe194_Asp195insProLysPheSerLeuAsnHisProSer | p.F194_D195insPKFSLNHPS | Q9ULW8 | protein_coding | TCGA-B6-A0IK-01 | Breast | breast invasive carcinoma | Female | <65 | III/IV | Unknown | Unknown | PD |
| Page: 1 2 3 4 5 6 7 8 9 |
Top |
Related drugs of malignant transformation related genes |
| Identification of chemicals and drugs interact with genes involved in malignant transfromation |
| (DGIdb 4.0) |
| Entrez ID | Symbol | Category | Interaction Types | Drug Claim Name | Drug Name | PMIDs |
| 51702 | PADI3 | ENZYME, DRUGGABLE GENOME | O-F-AMIDINE | CHEMBL1910970 | 21882827 | |
| 51702 | PADI3 | ENZYME, DRUGGABLE GENOME | inhibitor | 252166884 | ||
| 51702 | PADI3 | ENZYME, DRUGGABLE GENOME | inhibitor | 252166885 | ||
| 51702 | PADI3 | ENZYME, DRUGGABLE GENOME | O-CL-AMIDINE | CHEMBL1910971 | 21882827 |
| Page: 1 |

Copyright 2023-Present -The University of Texas Health Science Center at Houston |