
|
|||||
|
 | |
| |
| |
| |
| |
| |
|
Gene: PADI2 |
Gene summary for PADI2 |
| Gene information | Species | Human | Gene symbol | PADI2 | Gene ID | 11240 |
| Gene name | peptidyl arginine deiminase 2 | |
| Gene Alias | PAD-H19 | |
| Cytomap | 1p36.13 | |
| Gene Type | protein-coding | GO ID | GO:0001672 | UniProtAcc | A0A024RA98 |
Top |
Malignant transformation analysis |
| Identification of the aberrant gene expression in precancerous and cancerous lesions by comparing the gene expression of stem-like cells in diseased tissues with normal stem cells |
| Entrez ID | Symbol | Replicates | Species | Organ | Tissue | Adj P-value | Log2FC | Malignancy |
| 11240 | PADI2 | HTA11_3410_2000001011 | Human | Colorectum | AD | 8.75e-03 | -2.66e-01 | 0.0155 |
| 11240 | PADI2 | HTA11_2487_2000001011 | Human | Colorectum | SER | 1.08e-11 | 8.86e-01 | -0.1808 |
| 11240 | PADI2 | HTA11_1938_2000001011 | Human | Colorectum | AD | 1.35e-08 | 6.97e-01 | -0.0811 |
| 11240 | PADI2 | HTA11_78_2000001011 | Human | Colorectum | AD | 3.92e-03 | 4.68e-01 | -0.1088 |
| 11240 | PADI2 | HTA11_347_2000001011 | Human | Colorectum | AD | 9.49e-45 | 1.43e+00 | -0.1954 |
| 11240 | PADI2 | HTA11_411_2000001011 | Human | Colorectum | SER | 6.98e-08 | 1.38e+00 | -0.2602 |
| 11240 | PADI2 | HTA11_2112_2000001011 | Human | Colorectum | SER | 3.89e-05 | 9.02e-01 | -0.2196 |
| 11240 | PADI2 | HTA11_3361_2000001011 | Human | Colorectum | AD | 1.81e-08 | 6.65e-01 | -0.1207 |
| 11240 | PADI2 | HTA11_83_2000001011 | Human | Colorectum | SER | 1.01e-08 | 9.09e-01 | -0.1526 |
| 11240 | PADI2 | HTA11_696_2000001011 | Human | Colorectum | AD | 1.21e-20 | 8.88e-01 | -0.1464 |
| 11240 | PADI2 | HTA11_866_2000001011 | Human | Colorectum | AD | 1.92e-13 | 6.74e-01 | -0.1001 |
| 11240 | PADI2 | HTA11_2992_2000001011 | Human | Colorectum | SER | 2.12e-12 | 1.35e+00 | -0.1706 |
| 11240 | PADI2 | HTA11_5212_2000001011 | Human | Colorectum | AD | 1.42e-08 | 9.90e-01 | -0.2061 |
| 11240 | PADI2 | HTA11_5216_2000001011 | Human | Colorectum | SER | 1.17e-02 | 8.05e-01 | -0.1462 |
| 11240 | PADI2 | HTA11_546_2000001011 | Human | Colorectum | AD | 2.18e-03 | 6.40e-01 | -0.0842 |
| 11240 | PADI2 | HTA11_99999970781_79442 | Human | Colorectum | MSS | 4.45e-05 | -2.95e-01 | 0.294 |
| 11240 | PADI2 | HTA11_99999965104_69814 | Human | Colorectum | MSS | 8.05e-03 | -3.29e-01 | 0.281 |
| 11240 | PADI2 | HTA11_99999971662_82457 | Human | Colorectum | MSS | 8.01e-03 | -2.65e-01 | 0.3859 |
| 11240 | PADI2 | HTA11_99999974143_84620 | Human | Colorectum | MSS | 1.45e-09 | -3.33e-01 | 0.3005 |
| 11240 | PADI2 | F007 | Human | Colorectum | FAP | 6.84e-07 | -3.42e-01 | 0.1176 |
| Page: 1 2 3 |
| Tissue | Expression Dynamics | Abbreviation |
| Colorectum (GSE201348) |  | FAP: Familial adenomatous polyposis |
| CRC: Colorectal cancer | ||
| Colorectum (HTA11) | 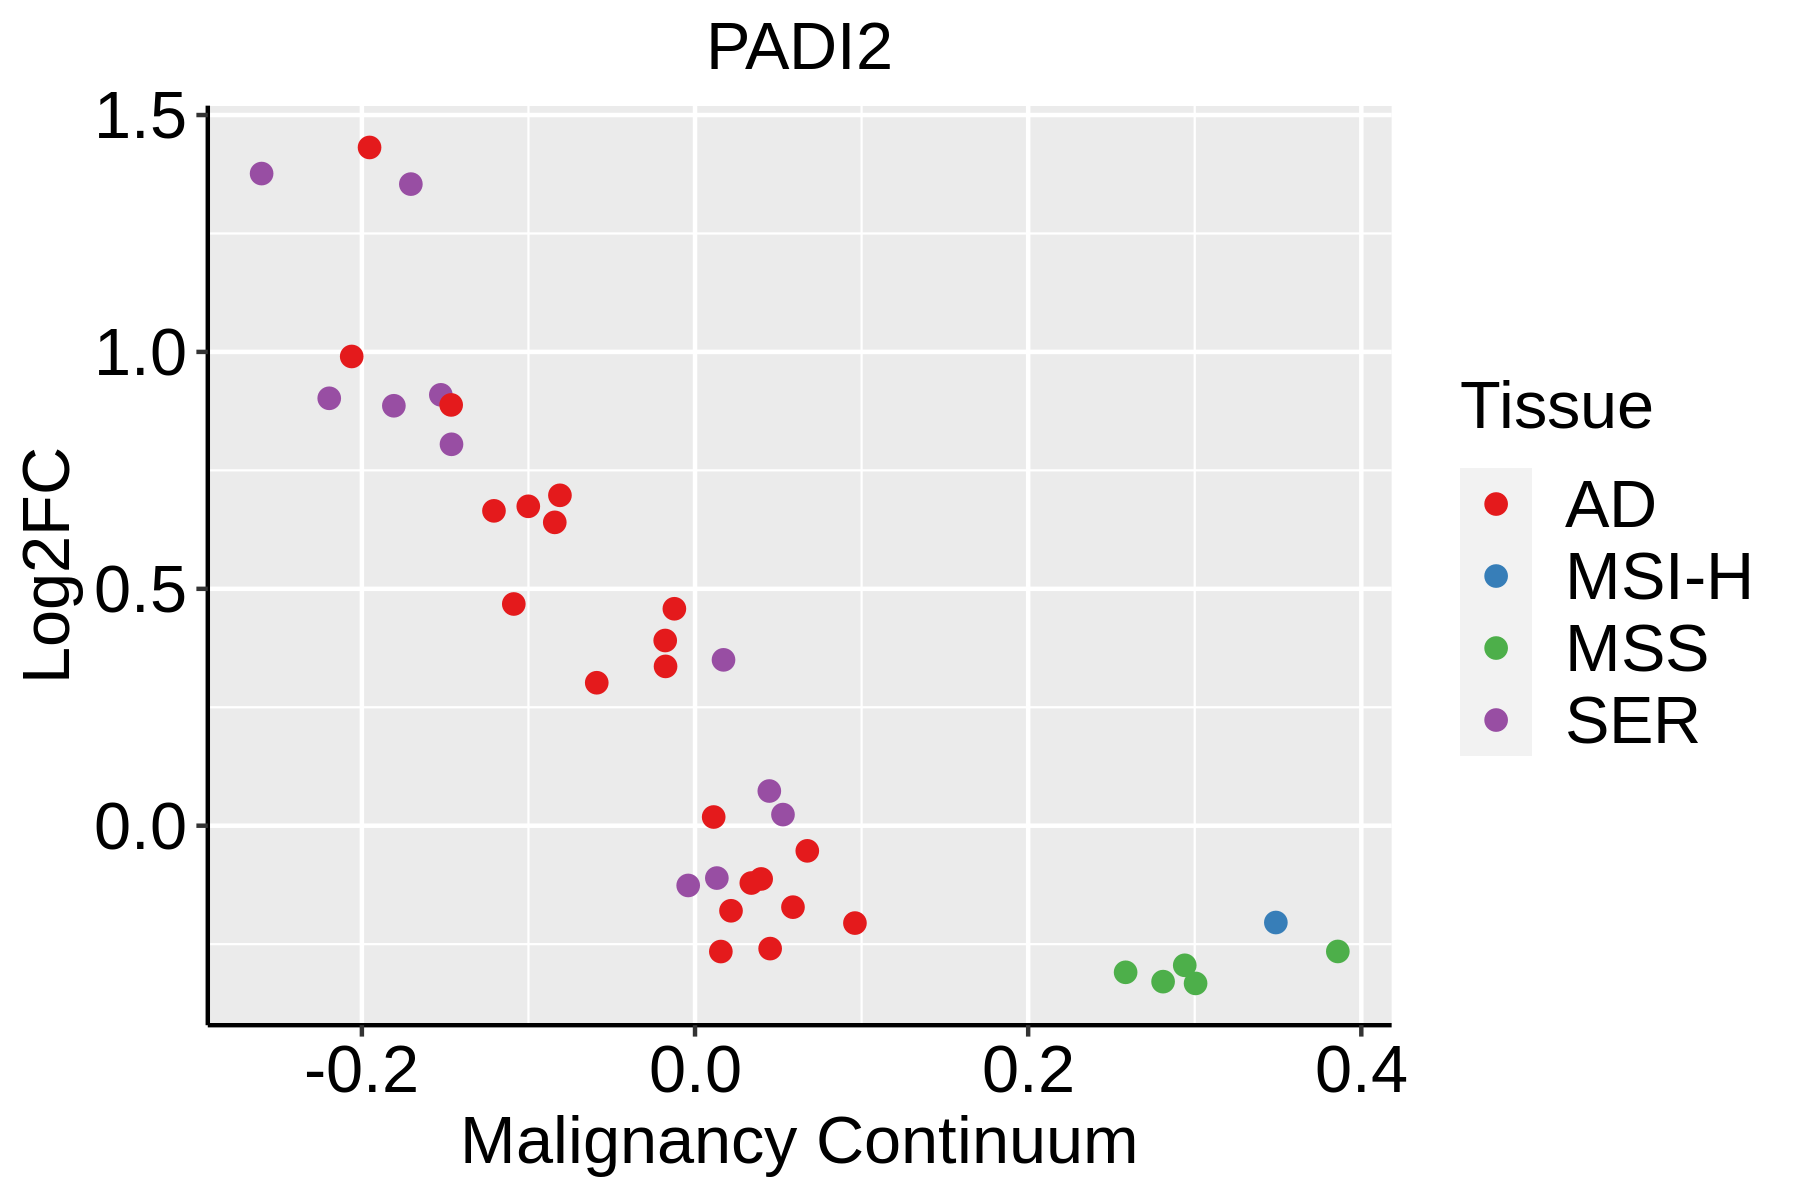 | AD: Adenomas |
| SER: Sessile serrated lesions | ||
| MSI-H: Microsatellite-high colorectal cancer | ||
| MSS: Microsatellite stable colorectal cancer | ||
| Esophagus | 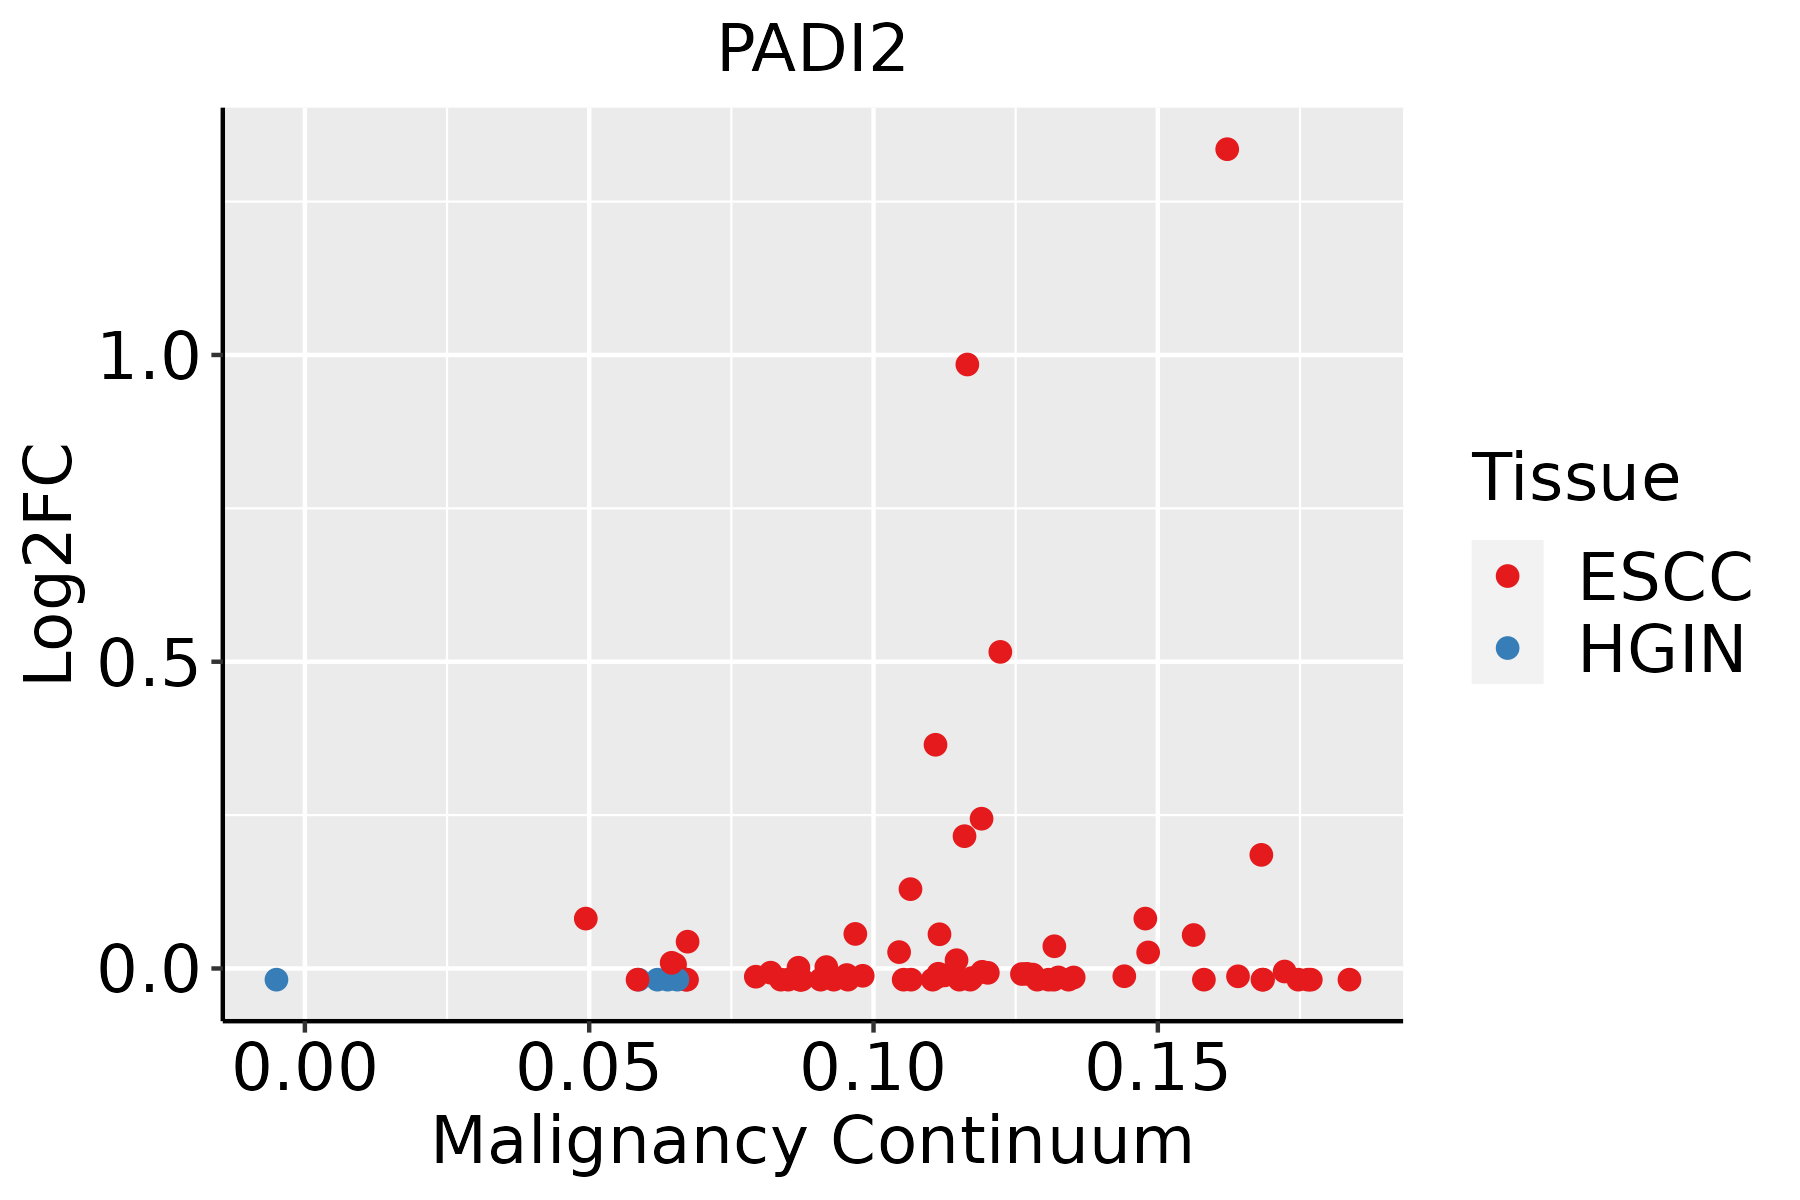 | ESCC: Esophageal squamous cell carcinoma |
| HGIN: High-grade intraepithelial neoplasias | ||
| LGIN: Low-grade intraepithelial neoplasias |
| ∗log2FC in expression of this searched gene in stem-like cells from each diseased tissue sample relative to stem-like cells in normal samples in each tissue plotted against the malignancy continuum. Samples are colored based on if they are from different disease stage. |
Top |
Malignant transformation related pathway analysis |
| Find out the enriched GO biological processes and KEGG pathways involved in transition from healthy to precancer to cancer |
| Tissue | Disease Stage | Enriched GO biological Processes |
| Colorectum | AD |  |
| Colorectum | SER |  |
| Colorectum | MSS |  |
| Colorectum | MSI-H |  |
| Colorectum | FAP |  |
| ∗Top 15 enriched GO BP terms are showed in the bar plot of each disease state in each tissue. Each row represents a significant GO biological process which is colored according to the -log10(p.adjust). |
| Page: 1 2 3 4 5 6 7 8 9 |
| GO ID | Tissue | Disease Stage | Description | Gene Ratio | Bg Ratio | pvalue | p.adjust | Count |
| GO:0022411 | Colorectum | AD | cellular component disassembly | 147/3918 | 443/18723 | 8.53e-10 | 6.76e-08 | 147 |
| GO:0071383 | Colorectum | AD | cellular response to steroid hormone stimulus | 73/3918 | 204/18723 | 6.31e-07 | 2.24e-05 | 73 |
| GO:0030522 | Colorectum | AD | intracellular receptor signaling pathway | 87/3918 | 265/18723 | 3.69e-06 | 1.03e-04 | 87 |
| GO:0043401 | Colorectum | AD | steroid hormone mediated signaling pathway | 51/3918 | 136/18723 | 6.52e-06 | 1.63e-04 | 51 |
| GO:0048545 | Colorectum | AD | response to steroid hormone | 104/3918 | 339/18723 | 1.33e-05 | 2.90e-04 | 104 |
| GO:0009755 | Colorectum | AD | hormone-mediated signaling pathway | 64/3918 | 190/18723 | 2.78e-05 | 5.24e-04 | 64 |
| GO:0030518 | Colorectum | AD | intracellular steroid hormone receptor signaling pathway | 43/3918 | 116/18723 | 4.61e-05 | 7.97e-04 | 43 |
| GO:0006325 | Colorectum | AD | chromatin organization | 119/3918 | 409/18723 | 4.85e-05 | 8.33e-04 | 119 |
| GO:0021762 | Colorectum | AD | substantia nigra development | 21/3918 | 44/18723 | 6.60e-05 | 1.07e-03 | 21 |
| GO:0048857 | Colorectum | AD | neural nucleus development | 27/3918 | 64/18723 | 9.57e-05 | 1.45e-03 | 27 |
| GO:0031498 | Colorectum | AD | chromatin disassembly | 11/3918 | 20/18723 | 8.39e-04 | 8.21e-03 | 11 |
| GO:0030901 | Colorectum | AD | midbrain development | 32/3918 | 90/18723 | 9.45e-04 | 8.95e-03 | 32 |
| GO:0006354 | Colorectum | AD | DNA-templated transcription, elongation | 31/3918 | 91/18723 | 2.46e-03 | 1.90e-02 | 31 |
| GO:0006368 | Colorectum | AD | transcription elongation from RNA polymerase II promoter | 24/3918 | 69/18723 | 5.35e-03 | 3.52e-02 | 24 |
| GO:00224111 | Colorectum | SER | cellular component disassembly | 114/2897 | 443/18723 | 1.17e-08 | 9.59e-07 | 114 |
| GO:00217621 | Colorectum | SER | substantia nigra development | 21/2897 | 44/18723 | 4.77e-07 | 2.40e-05 | 21 |
| GO:00488571 | Colorectum | SER | neural nucleus development | 26/2897 | 64/18723 | 1.09e-06 | 5.11e-05 | 26 |
| GO:00713831 | Colorectum | SER | cellular response to steroid hormone stimulus | 55/2897 | 204/18723 | 1.66e-05 | 5.05e-04 | 55 |
| GO:00485451 | Colorectum | SER | response to steroid hormone | 80/2897 | 339/18723 | 5.15e-05 | 1.25e-03 | 80 |
| GO:00309011 | Colorectum | SER | midbrain development | 29/2897 | 90/18723 | 5.50e-05 | 1.30e-03 | 29 |
| Page: 1 2 3 4 5 |
| Pathway ID | Tissue | Disease Stage | Description | Gene Ratio | Bg Ratio | pvalue | p.adjust | qvalue | Count |
| Page: 1 |
Top |
Cell-cell communication analysis |
| Identification of potential cell-cell interactions between two cell types and their ligand-receptor pairs for different disease states |
| Ligand | Receptor | LRpair | Pathway | Tissue | Disease Stage |
| Page: 1 |
Top |
Single-cell gene regulatory network inference analysis |
| Find out the significant the regulons (TFs) and the target genes of each regulon across cell types for different disease states |
| TF | Cell Type | Tissue | Disease Stage | Target Gene | RSS | Regulon Activity |
| ∗The dot plots of a searched regulon are shown for all cell subpopulations in each disease state of each tissue based on the regulon specific score inferred using pySCENIC and by calculating the average expression. |
| Page: 1 |
Top |
Somatic mutation of malignant transformation related genes |
| Annotation of somatic variants for genes involved in malignant transformation |
| Hugo Symbol | Variant Class | Variant Classification | dbSNP RS | HGVSc | HGVSp | HGVSp Short | SWISSPROT | BIOTYPE | SIFT | PolyPhen | Tumor Sample Barcode | Tissue | Histology | Sex | Age | Stage | Therapy Types | Drugs | Outcome |
| PADI2 | SNV | Missense_Mutation | c.532N>G | p.Leu178Val | p.L178V | Q9Y2J8 | protein_coding | deleterious(0.03) | probably_damaging(0.999) | TCGA-A1-A0SG-01 | Breast | breast invasive carcinoma | Female | <65 | I/II | Chemotherapy | SD | ||
| PADI2 | SNV | Missense_Mutation | c.1949N>G | p.Asn650Ser | p.N650S | Q9Y2J8 | protein_coding | deleterious(0.01) | probably_damaging(0.999) | TCGA-A8-A09Z-01 | Breast | breast invasive carcinoma | Female | >=65 | I/II | Unknown | Unknown | SD | |
| PADI2 | SNV | Missense_Mutation | rs761228653 | c.94N>A | p.Ala32Thr | p.A32T | Q9Y2J8 | protein_coding | tolerated(0.07) | possibly_damaging(0.506) | TCGA-A8-A0A1-01 | Breast | breast invasive carcinoma | Female | >=65 | I/II | Hormone Therapy | tamoxiphen | SD |
| PADI2 | SNV | Missense_Mutation | novel | c.976N>C | p.Asn326His | p.N326H | Q9Y2J8 | protein_coding | tolerated(0.32) | benign(0.061) | TCGA-BH-A0HL-01 | Breast | breast invasive carcinoma | Female | <65 | I/II | Chemotherapy | cyclophosphamide | SD |
| PADI2 | SNV | Missense_Mutation | c.1153N>T | p.Leu385Phe | p.L385F | Q9Y2J8 | protein_coding | deleterious(0.01) | probably_damaging(1) | TCGA-D8-A1XK-01 | Breast | breast invasive carcinoma | Female | <65 | I/II | Chemotherapy | doxorubicine+cyclophosphamide | SD | |
| PADI2 | deletion | Frame_Shift_Del | c.628_631delGACA | p.Asp210LysfsTer72 | p.D210Kfs*72 | Q9Y2J8 | protein_coding | TCGA-AR-A1AH-01 | Breast | breast invasive carcinoma | Female | <65 | I/II | Unspecific | PD | ||||
| PADI2 | insertion | Frame_Shift_Ins | novel | c.1079_1080insAAGGT | p.Pro361ArgfsTer19 | p.P361Rfs*19 | Q9Y2J8 | protein_coding | TCGA-BH-A0GY-01 | Breast | breast invasive carcinoma | Female | >=65 | I/II | Chemotherapy | cyotxan | SD | ||
| PADI2 | insertion | Frame_Shift_Ins | novel | c.1078_1079insGGACTTTTCC | p.Ala360GlyfsTer7 | p.A360Gfs*7 | Q9Y2J8 | protein_coding | TCGA-BH-A0GY-01 | Breast | breast invasive carcinoma | Female | >=65 | I/II | Chemotherapy | cyotxan | SD | ||
| PADI2 | deletion | Frame_Shift_Del | novel | c.1235delA | p.Glu412GlyfsTer6 | p.E412Gfs*6 | Q9Y2J8 | protein_coding | TCGA-D8-A27V-01 | Breast | breast invasive carcinoma | Female | <65 | I/II | Hormone Therapy | tamoxiphen | SD | ||
| PADI2 | SNV | Missense_Mutation | c.1678G>A | p.Gly560Arg | p.G560R | Q9Y2J8 | protein_coding | deleterious(0) | probably_damaging(0.948) | TCGA-C5-A1BE-01 | Cervix | cervical & endocervical cancer | Female | <65 | I/II | Chemotherapy | cisplatin | PD |
| Page: 1 2 3 4 5 6 7 8 |
Top |
Related drugs of malignant transformation related genes |
| Identification of chemicals and drugs interact with genes involved in malignant transfromation |
| (DGIdb 4.0) |
| Entrez ID | Symbol | Category | Interaction Types | Drug Claim Name | Drug Name | PMIDs |
| 11240 | PADI2 | ENZYME | O-F-AMIDINE | CHEMBL1910970 | 21882827 | |
| 11240 | PADI2 | ENZYME | STREPTONIGRIN | STREPTONIGRIN | 24440480 | |
| 11240 | PADI2 | ENZYME | O-CL-AMIDINE | CHEMBL1910971 | 21882827 |
| Page: 1 |

Copyright 2023-Present -The University of Texas Health Science Center at Houston |