
|
|||||
|
 | |
| |
| |
| |
| |
| |
|
Gene: PACSIN2 |
Gene summary for PACSIN2 |
| Gene information | Species | Human | Gene symbol | PACSIN2 | Gene ID | 11252 |
| Gene name | protein kinase C and casein kinase substrate in neurons 2 | |
| Gene Alias | SDPII | |
| Cytomap | 22q13.2 | |
| Gene Type | protein-coding | GO ID | GO:0000902 | UniProtAcc | Q9UNF0 |
Top |
Malignant transformation analysis |
| Identification of the aberrant gene expression in precancerous and cancerous lesions by comparing the gene expression of stem-like cells in diseased tissues with normal stem cells |
| Entrez ID | Symbol | Replicates | Species | Organ | Tissue | Adj P-value | Log2FC | Malignancy |
| 11252 | PACSIN2 | CCI_1 | Human | Cervix | CC | 9.75e-05 | 5.72e-01 | 0.528 |
| 11252 | PACSIN2 | CCI_3 | Human | Cervix | CC | 2.01e-14 | 9.56e-01 | 0.516 |
| 11252 | PACSIN2 | HTA11_3410_2000001011 | Human | Colorectum | AD | 7.34e-14 | -4.71e-01 | 0.0155 |
| 11252 | PACSIN2 | HTA11_347_2000001011 | Human | Colorectum | AD | 2.17e-10 | 5.93e-01 | -0.1954 |
| 11252 | PACSIN2 | HTA11_411_2000001011 | Human | Colorectum | SER | 4.18e-05 | 9.49e-01 | -0.2602 |
| 11252 | PACSIN2 | HTA11_696_2000001011 | Human | Colorectum | AD | 5.25e-03 | 5.60e-01 | -0.1464 |
| 11252 | PACSIN2 | HTA11_866_3004761011 | Human | Colorectum | AD | 4.10e-04 | -3.47e-01 | 0.096 |
| 11252 | PACSIN2 | HTA11_8622_2000001021 | Human | Colorectum | SER | 2.37e-02 | -2.89e-01 | 0.0528 |
| 11252 | PACSIN2 | HTA11_7696_3000711011 | Human | Colorectum | AD | 6.48e-08 | -3.45e-01 | 0.0674 |
| 11252 | PACSIN2 | HTA11_6818_2000001021 | Human | Colorectum | AD | 4.08e-04 | -4.68e-01 | 0.0588 |
| 11252 | PACSIN2 | HTA11_99999970781_79442 | Human | Colorectum | MSS | 5.78e-07 | -3.28e-01 | 0.294 |
| 11252 | PACSIN2 | HTA11_99999973899_84307 | Human | Colorectum | MSS | 3.75e-02 | -4.18e-01 | 0.2585 |
| 11252 | PACSIN2 | HTA11_99999974143_84620 | Human | Colorectum | MSS | 2.83e-08 | -3.14e-01 | 0.3005 |
| 11252 | PACSIN2 | F007 | Human | Colorectum | FAP | 1.91e-04 | -2.51e-01 | 0.1176 |
| 11252 | PACSIN2 | A002-C-010 | Human | Colorectum | FAP | 1.18e-07 | -3.45e-01 | 0.242 |
| 11252 | PACSIN2 | A001-C-207 | Human | Colorectum | FAP | 3.77e-09 | -3.16e-01 | 0.1278 |
| 11252 | PACSIN2 | A015-C-203 | Human | Colorectum | FAP | 2.17e-41 | -5.75e-01 | -0.1294 |
| 11252 | PACSIN2 | A015-C-204 | Human | Colorectum | FAP | 1.91e-09 | -4.14e-01 | -0.0228 |
| 11252 | PACSIN2 | A014-C-040 | Human | Colorectum | FAP | 5.08e-07 | -5.52e-01 | -0.1184 |
| 11252 | PACSIN2 | A002-C-201 | Human | Colorectum | FAP | 3.10e-22 | -5.59e-01 | 0.0324 |
| Page: 1 2 3 4 5 6 7 8 9 |
| Tissue | Expression Dynamics | Abbreviation |
| Cervix | 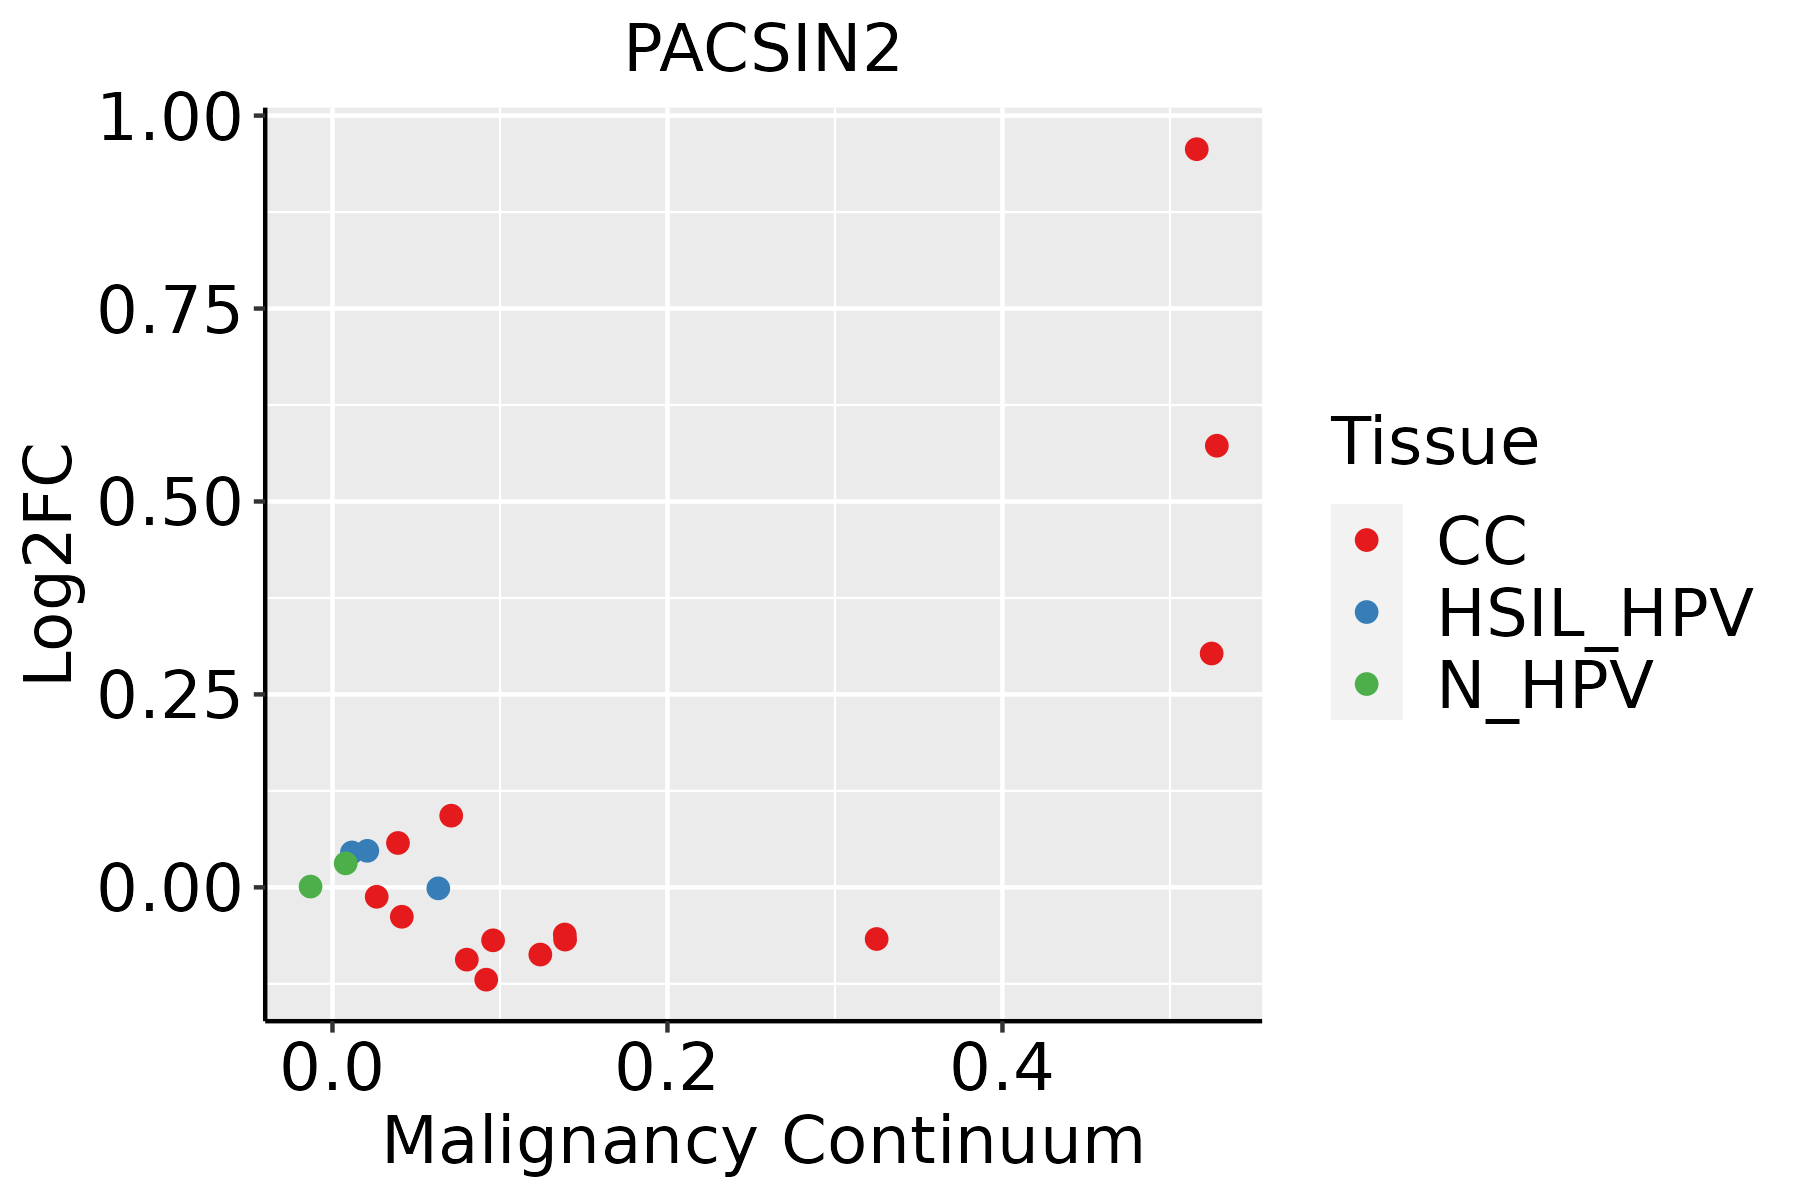 | CC: Cervix cancer |
| HSIL_HPV: HPV-infected high-grade squamous intraepithelial lesions | ||
| N_HPV: HPV-infected normal cervix | ||
| Colorectum (GSE201348) |  | FAP: Familial adenomatous polyposis |
| CRC: Colorectal cancer | ||
| Colorectum (HTA11) |  | AD: Adenomas |
| SER: Sessile serrated lesions | ||
| MSI-H: Microsatellite-high colorectal cancer | ||
| MSS: Microsatellite stable colorectal cancer | ||
| Esophagus | 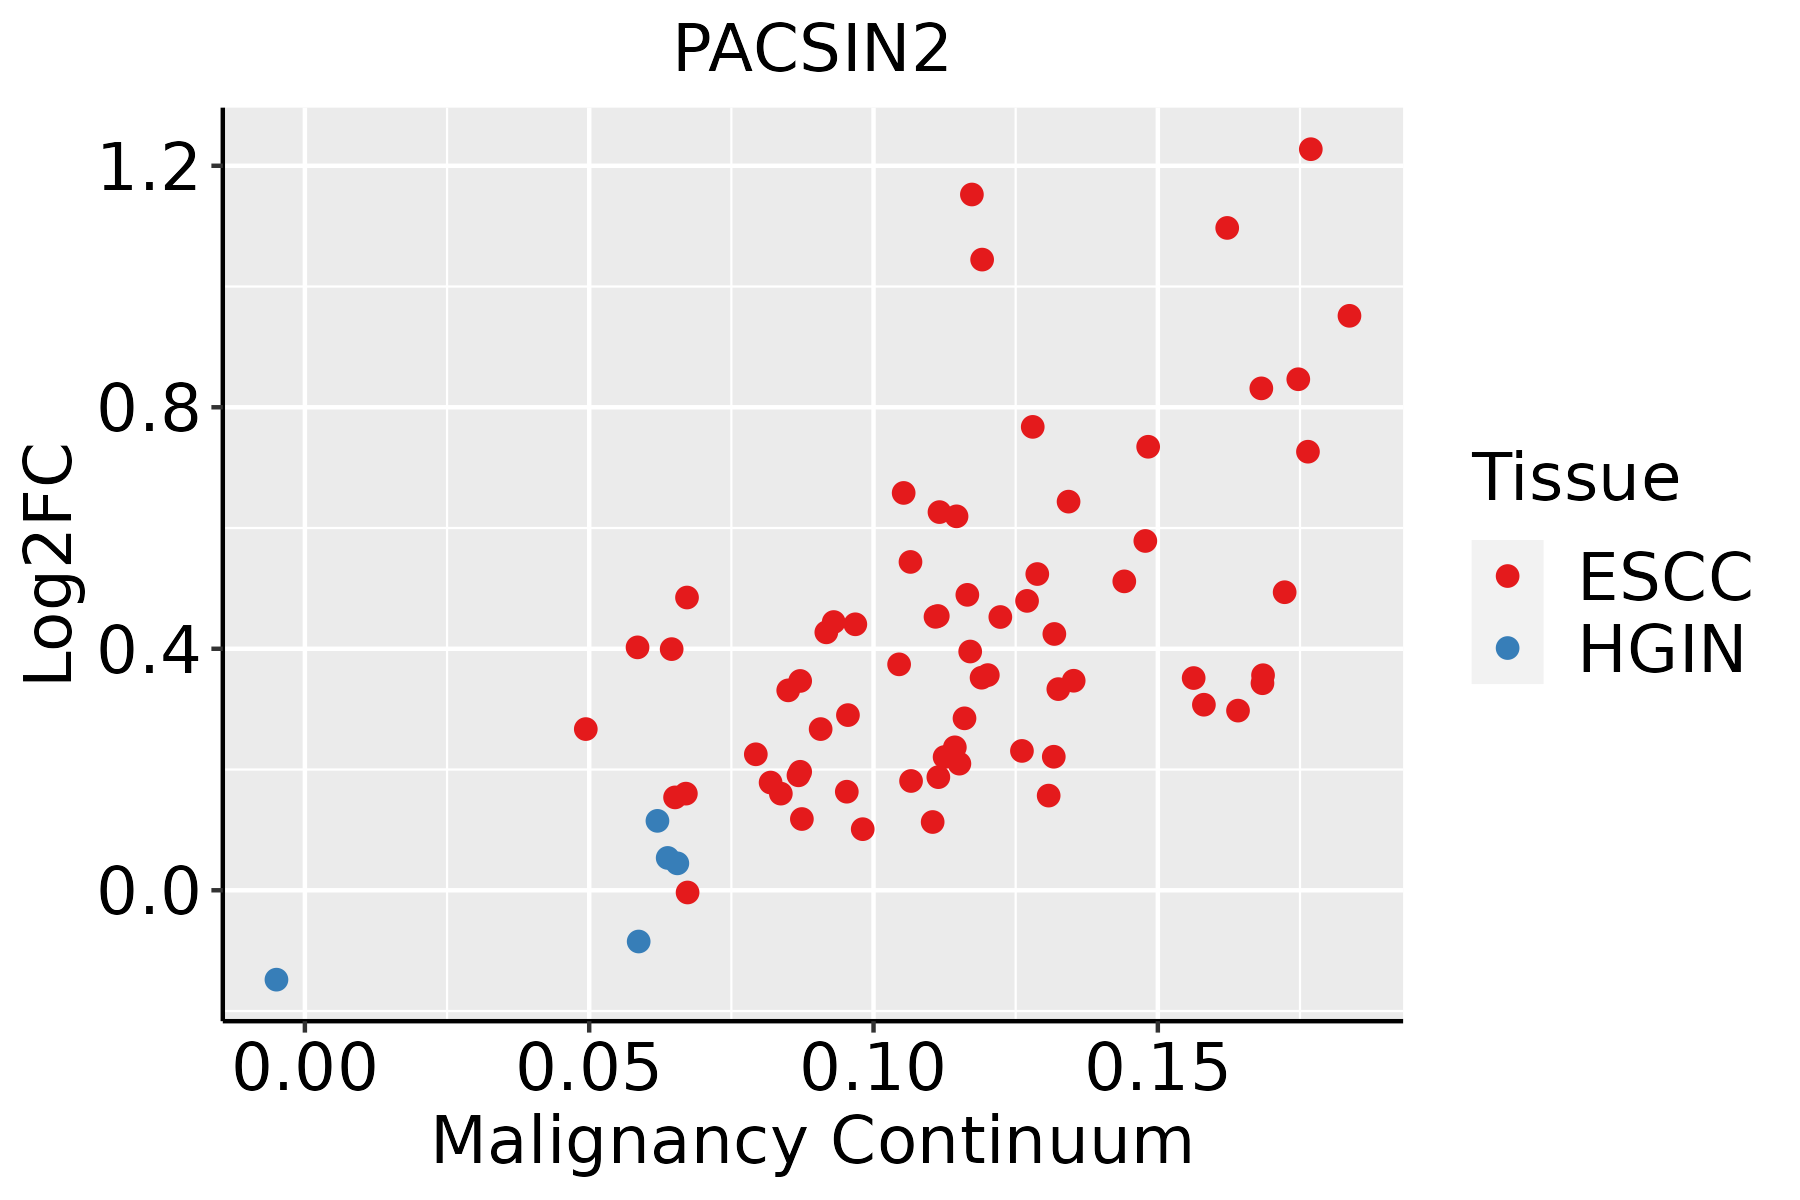 | ESCC: Esophageal squamous cell carcinoma |
| HGIN: High-grade intraepithelial neoplasias | ||
| LGIN: Low-grade intraepithelial neoplasias | ||
| Liver | 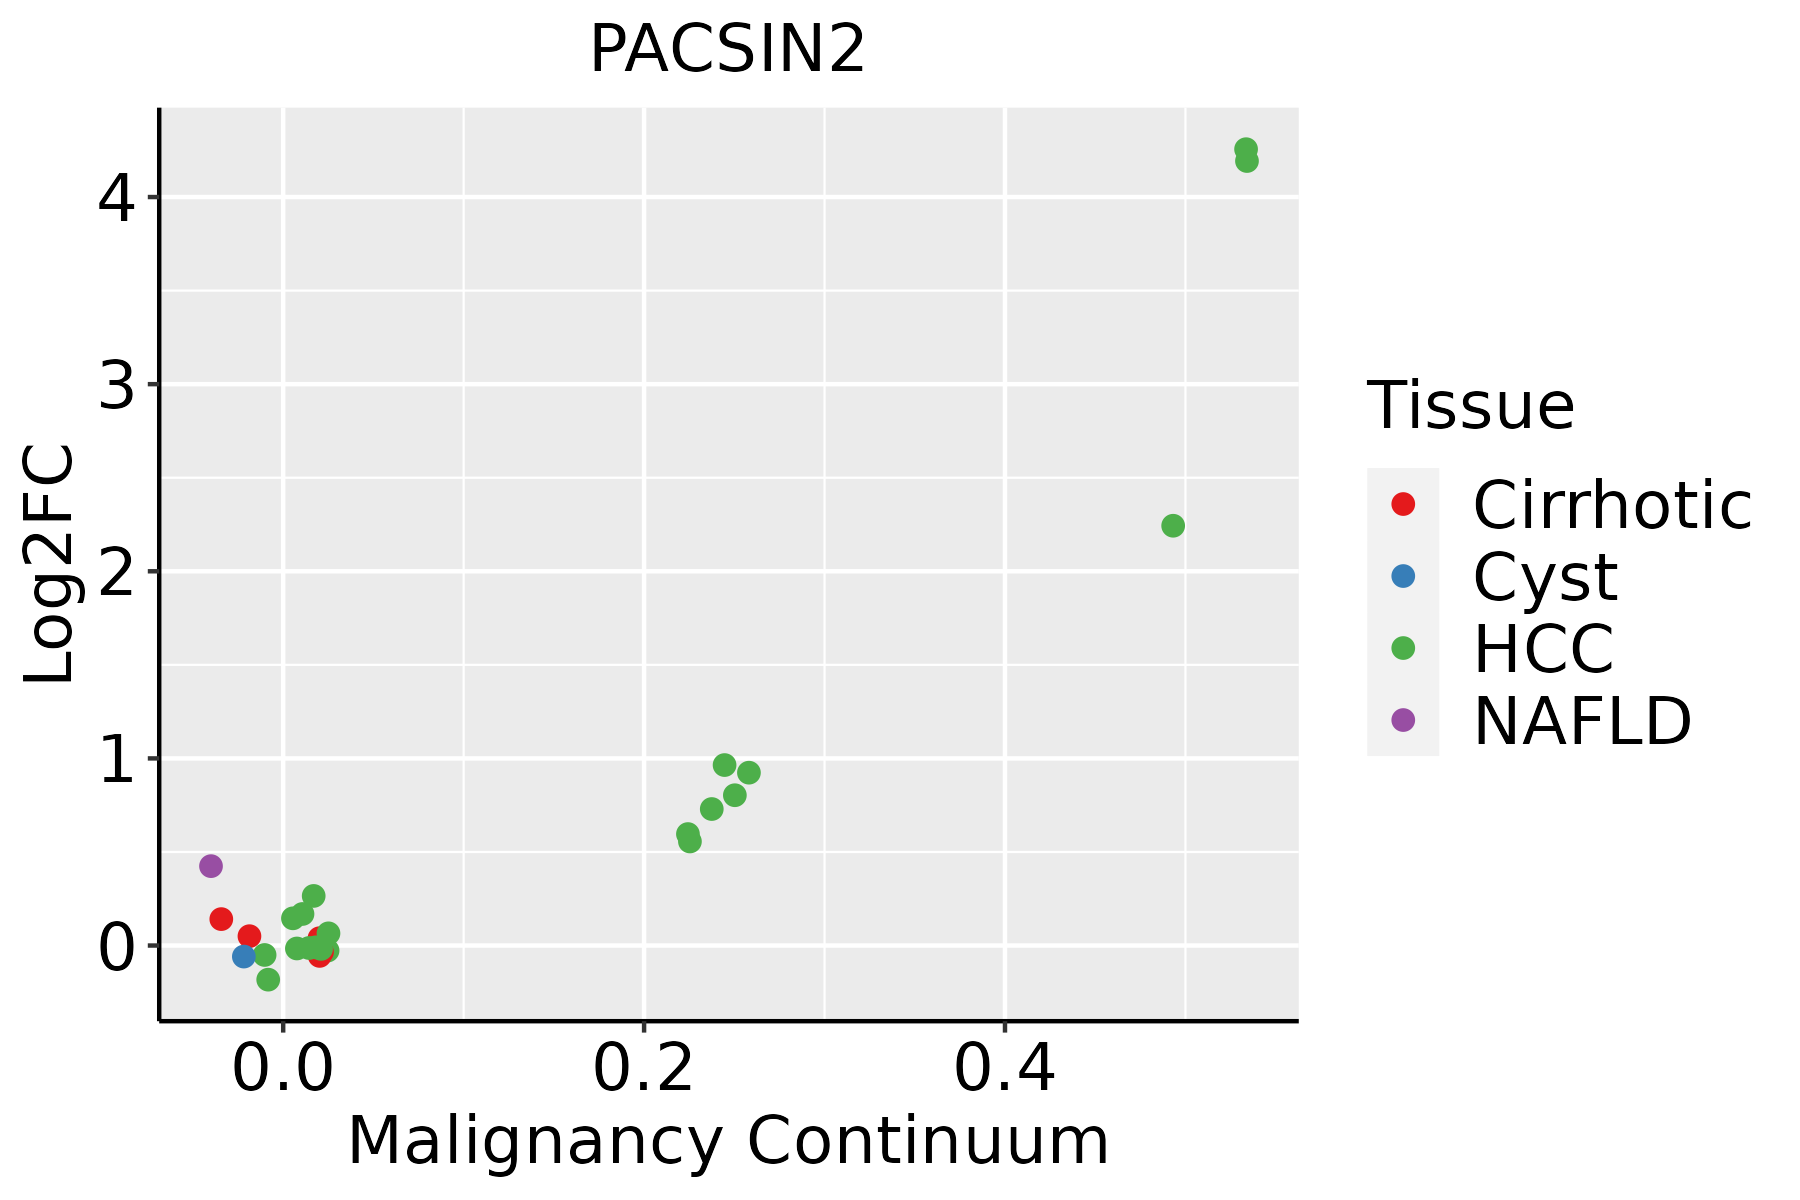 | HCC: Hepatocellular carcinoma |
| NAFLD: Non-alcoholic fatty liver disease | ||
| Lung |  | AAH: Atypical adenomatous hyperplasia |
| AIS: Adenocarcinoma in situ | ||
| IAC: Invasive lung adenocarcinoma | ||
| MIA: Minimally invasive adenocarcinoma | ||
| Oral Cavity | 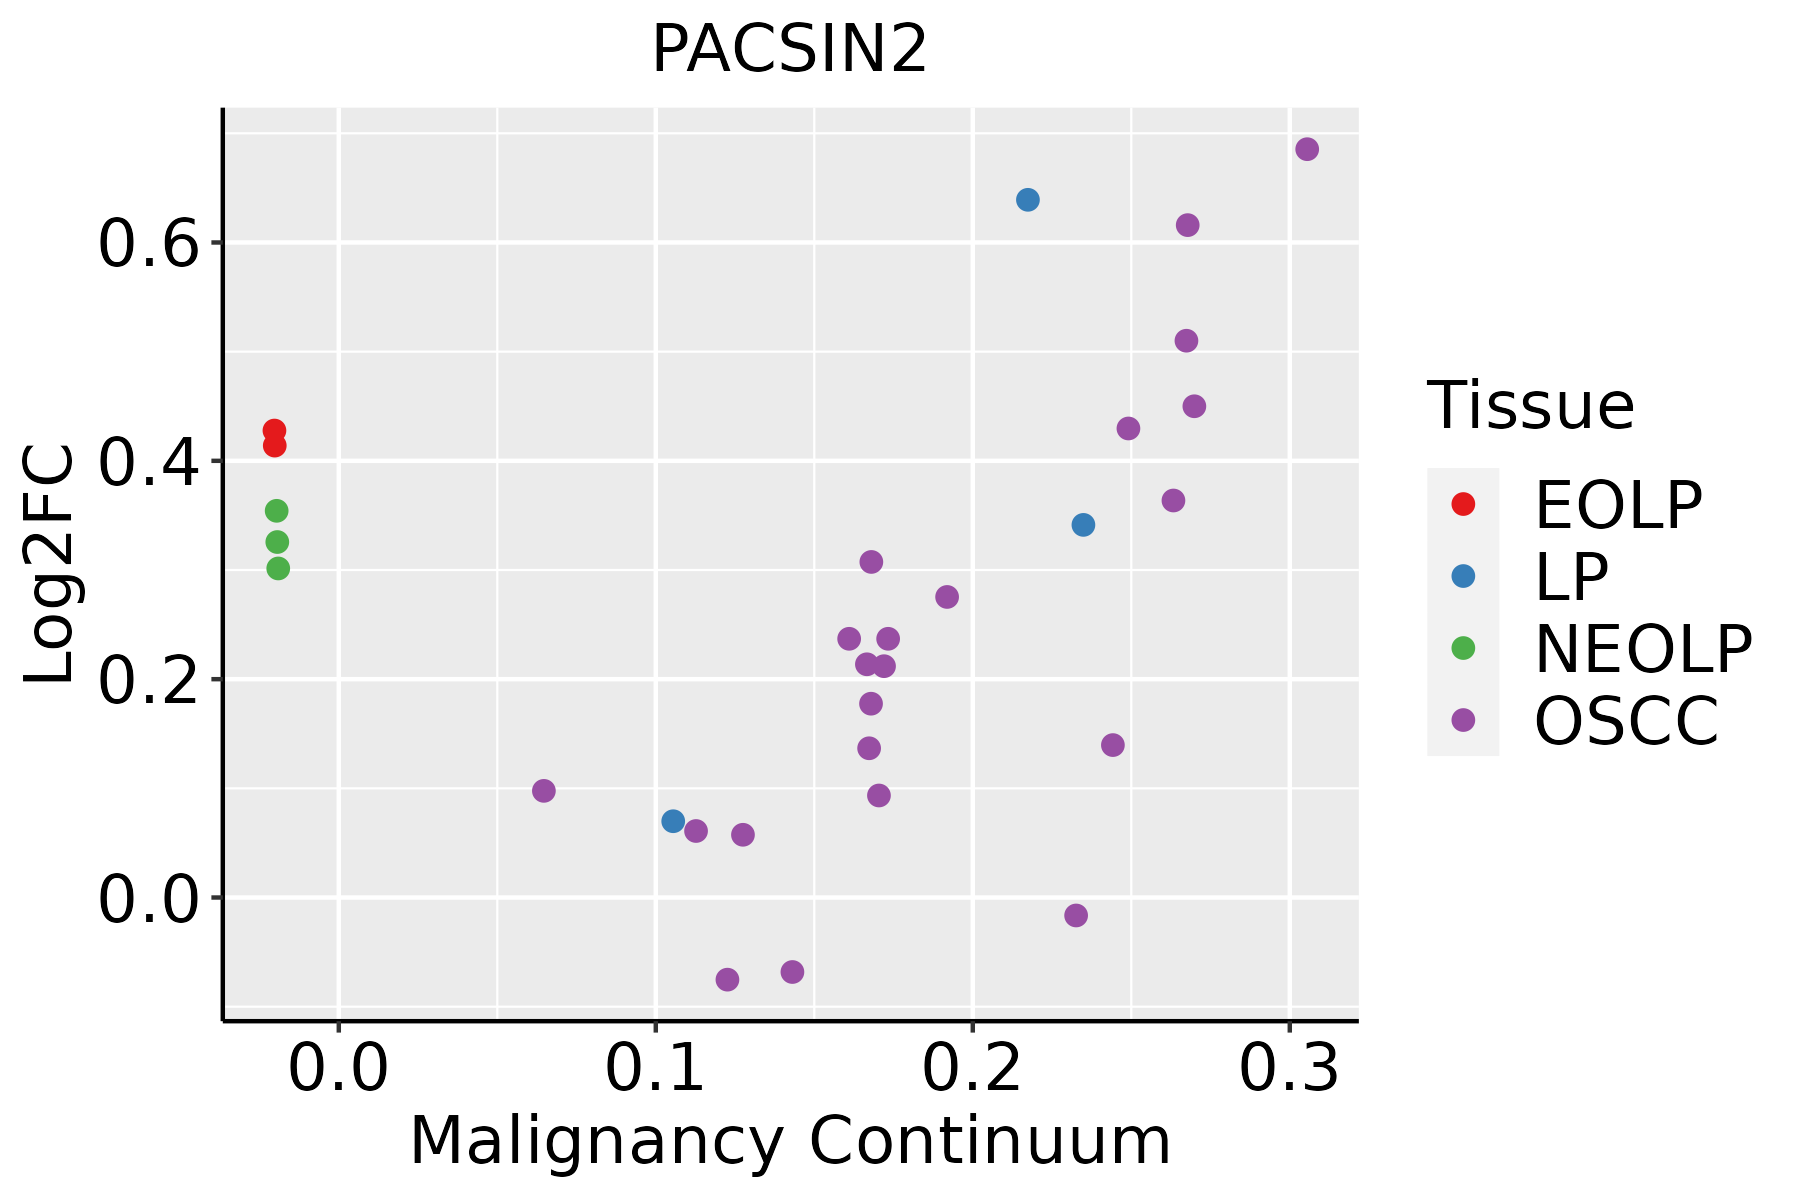 | EOLP: Erosive Oral lichen planus |
| LP: leukoplakia | ||
| NEOLP: Non-erosive oral lichen planus | ||
| OSCC: Oral squamous cell carcinoma | ||
| Prostate | 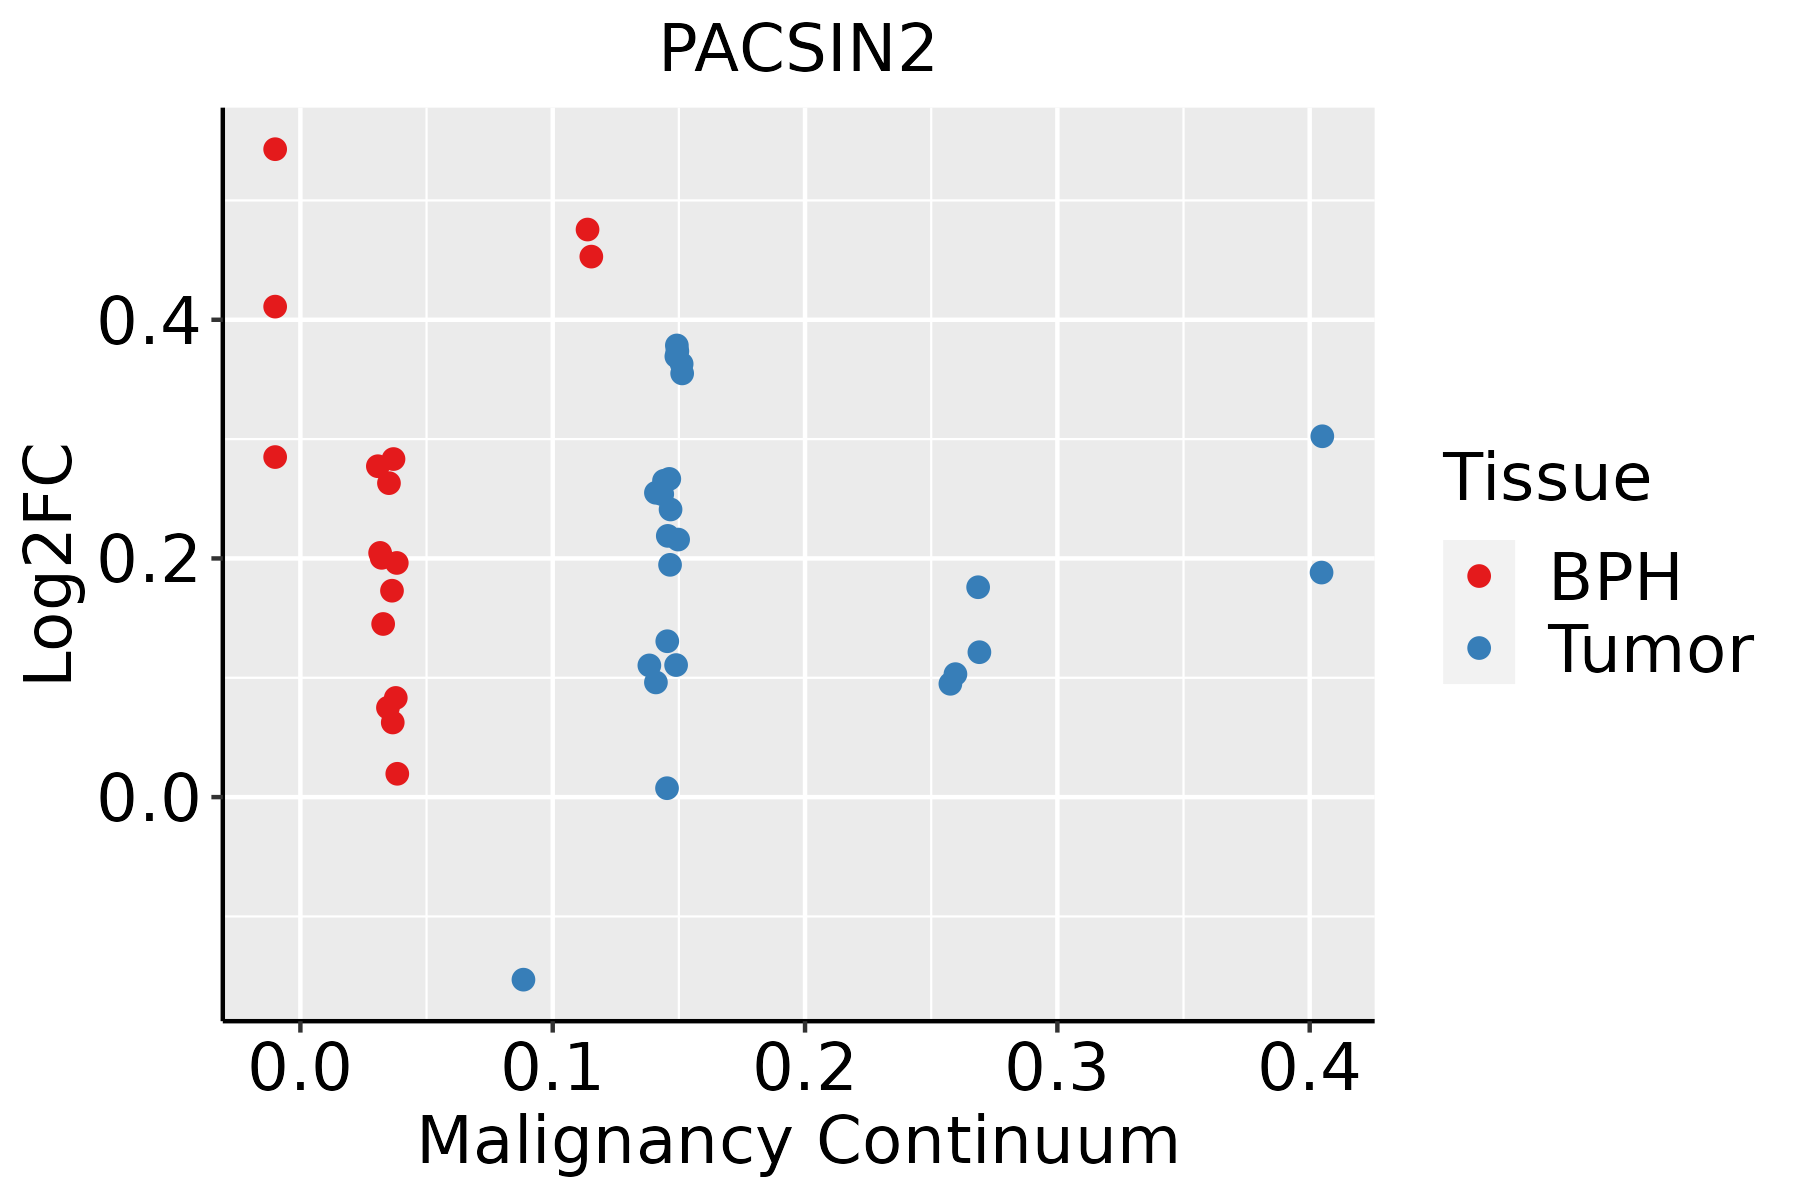 | BPH: Benign Prostatic Hyperplasia |
| Thyroid | 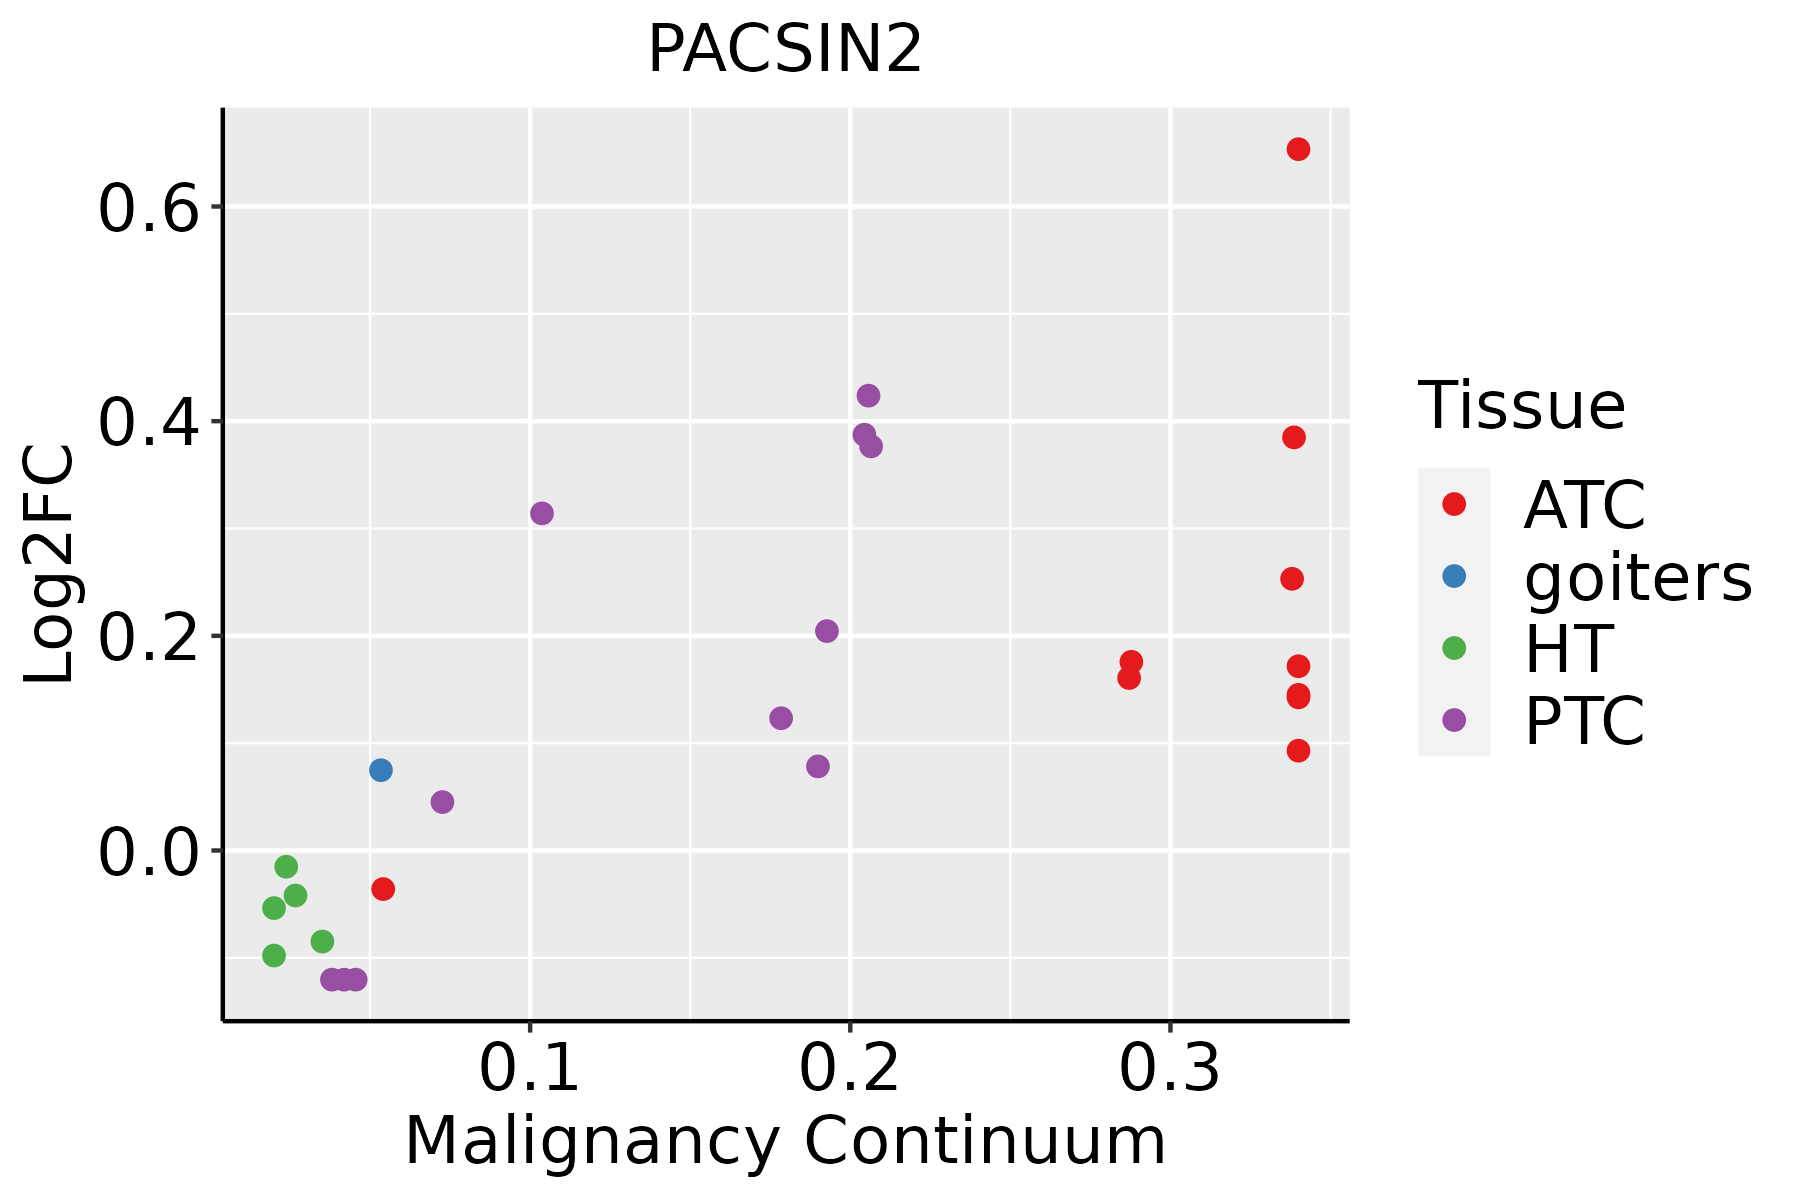 | ATC: Anaplastic thyroid cancer |
| HT: Hashimoto's thyroiditis | ||
| PTC: Papillary thyroid cancer |
| ∗log2FC in expression of this searched gene in stem-like cells from each diseased tissue sample relative to stem-like cells in normal samples in each tissue plotted against the malignancy continuum. Samples are colored based on if they are from different disease stage. |
Top |
Malignant transformation related pathway analysis |
| Find out the enriched GO biological processes and KEGG pathways involved in transition from healthy to precancer to cancer |
| Tissue | Disease Stage | Enriched GO biological Processes |
| Colorectum | AD |  |
| Colorectum | SER |  |
| Colorectum | MSS |  |
| Colorectum | MSI-H |  |
| Colorectum | FAP |  |
| ∗Top 15 enriched GO BP terms are showed in the bar plot of each disease state in each tissue. Each row represents a significant GO biological process which is colored according to the -log10(p.adjust). |
| Page: 1 2 3 4 5 6 7 8 9 |
| GO ID | Tissue | Disease Stage | Description | Gene Ratio | Bg Ratio | pvalue | p.adjust | Count |
| GO:00301008 | Cervix | CC | regulation of endocytosis | 47/2311 | 211/18723 | 3.65e-05 | 5.82e-04 | 47 |
| GO:00315795 | Cervix | CC | membrane raft organization | 9/2311 | 25/18723 | 2.09e-03 | 1.52e-02 | 9 |
| GO:00017652 | Cervix | CC | membrane raft assembly | 5/2311 | 11/18723 | 6.92e-03 | 3.74e-02 | 5 |
| GO:00070092 | Cervix | CC | plasma membrane organization | 28/2311 | 142/18723 | 7.85e-03 | 4.14e-02 | 28 |
| GO:0030100 | Colorectum | AD | regulation of endocytosis | 67/3918 | 211/18723 | 1.42e-04 | 2.01e-03 | 67 |
| GO:0071709 | Colorectum | AD | membrane assembly | 22/3918 | 50/18723 | 2.00e-04 | 2.66e-03 | 22 |
| GO:0044091 | Colorectum | AD | membrane biogenesis | 22/3918 | 55/18723 | 9.88e-04 | 9.28e-03 | 22 |
| GO:0036010 | Colorectum | AD | protein localization to endosome | 12/3918 | 24/18723 | 1.48e-03 | 1.25e-02 | 12 |
| GO:00717091 | Colorectum | SER | membrane assembly | 20/2897 | 50/18723 | 2.45e-05 | 6.84e-04 | 20 |
| GO:00440911 | Colorectum | SER | membrane biogenesis | 20/2897 | 55/18723 | 1.21e-04 | 2.49e-03 | 20 |
| GO:0051051 | Colorectum | SER | negative regulation of transport | 98/2897 | 470/18723 | 1.01e-03 | 1.19e-02 | 98 |
| GO:0007009 | Colorectum | SER | plasma membrane organization | 36/2897 | 142/18723 | 1.50e-03 | 1.62e-02 | 36 |
| GO:0031579 | Colorectum | SER | membrane raft organization | 10/2897 | 25/18723 | 2.70e-03 | 2.44e-02 | 10 |
| GO:00301001 | Colorectum | SER | regulation of endocytosis | 48/2897 | 211/18723 | 3.29e-03 | 2.82e-02 | 48 |
| GO:00360101 | Colorectum | SER | protein localization to endosome | 9/2897 | 24/18723 | 7.19e-03 | 4.99e-02 | 9 |
| GO:00301002 | Colorectum | MSS | regulation of endocytosis | 63/3467 | 211/18723 | 4.05e-05 | 7.66e-04 | 63 |
| GO:00360102 | Colorectum | MSS | protein localization to endosome | 12/3467 | 24/18723 | 4.68e-04 | 5.50e-03 | 12 |
| GO:00717092 | Colorectum | MSS | membrane assembly | 19/3467 | 50/18723 | 9.61e-04 | 9.67e-03 | 19 |
| GO:00440912 | Colorectum | MSS | membrane biogenesis | 19/3467 | 55/18723 | 3.47e-03 | 2.59e-02 | 19 |
| GO:00510511 | Colorectum | MSS | negative regulation of transport | 110/3467 | 470/18723 | 4.20e-03 | 3.04e-02 | 110 |
| Page: 1 2 3 4 5 |
| Pathway ID | Tissue | Disease Stage | Description | Gene Ratio | Bg Ratio | pvalue | p.adjust | qvalue | Count |
| Page: 1 |
Top |
Cell-cell communication analysis |
| Identification of potential cell-cell interactions between two cell types and their ligand-receptor pairs for different disease states |
| Ligand | Receptor | LRpair | Pathway | Tissue | Disease Stage |
| Page: 1 |
Top |
Single-cell gene regulatory network inference analysis |
| Find out the significant the regulons (TFs) and the target genes of each regulon across cell types for different disease states |
| TF | Cell Type | Tissue | Disease Stage | Target Gene | RSS | Regulon Activity |
| ∗The dot plots of a searched regulon are shown for all cell subpopulations in each disease state of each tissue based on the regulon specific score inferred using pySCENIC and by calculating the average expression. |
| Page: 1 |
Top |
Somatic mutation of malignant transformation related genes |
| Annotation of somatic variants for genes involved in malignant transformation |
| Hugo Symbol | Variant Class | Variant Classification | dbSNP RS | HGVSc | HGVSp | HGVSp Short | SWISSPROT | BIOTYPE | SIFT | PolyPhen | Tumor Sample Barcode | Tissue | Histology | Sex | Age | Stage | Therapy Types | Drugs | Outcome |
| PACSIN2 | SNV | Missense_Mutation | c.1349G>C | p.Gly450Ala | p.G450A | Q9UNF0 | protein_coding | deleterious(0) | probably_damaging(1) | TCGA-A2-A04P-01 | Breast | breast invasive carcinoma | Female | <65 | III/IV | Chemotherapy | taxol | PD | |
| PACSIN2 | SNV | Missense_Mutation | novel | c.46G>A | p.Asp16Asn | p.D16N | Q9UNF0 | protein_coding | tolerated(0.07) | benign(0.072) | TCGA-D8-A1JP-01 | Breast | breast invasive carcinoma | Female | >=65 | I/II | Hormone Therapy | tamoxiphen | SD |
| PACSIN2 | SNV | Missense_Mutation | c.249G>C | p.Trp83Cys | p.W83C | Q9UNF0 | protein_coding | deleterious(0) | probably_damaging(1) | TCGA-D8-A1XW-01 | Breast | breast invasive carcinoma | Female | <65 | I/II | Chemotherapy | adriamycin+cyclophosphamide | SD | |
| PACSIN2 | SNV | Missense_Mutation | c.993G>C | p.Gln331His | p.Q331H | Q9UNF0 | protein_coding | tolerated(0.13) | benign(0.001) | TCGA-E2-A1LH-01 | Breast | breast invasive carcinoma | Female | <65 | I/II | Chemotherapy | adriamycin | SD | |
| PACSIN2 | SNV | Missense_Mutation | novel | c.315G>C | p.Met105Ile | p.M105I | Q9UNF0 | protein_coding | tolerated(0.39) | benign(0.02) | TCGA-GM-A3NW-01 | Breast | breast invasive carcinoma | Female | <65 | I/II | Chemotherapy | fluorouracil | SD |
| PACSIN2 | insertion | Nonsense_Mutation | novel | c.172_173insGAGTTAACTCAGAACTCGGGTAAGTTCCTATCACGTGGA | p.Gln58delinsArgValAsnSerGluLeuGlyTerValProIleThrTrpLys | p.Q58delinsRVNSELG*VPITWK | Q9UNF0 | protein_coding | TCGA-A8-A09W-01 | Breast | breast invasive carcinoma | Female | >=65 | III/IV | Unknown | Unknown | SD | ||
| PACSIN2 | insertion | Nonsense_Mutation | novel | c.88_89insTGACAGATATGGCCGCTGGAAGGTAGGTG | p.Arg30LeufsTer9 | p.R30Lfs*9 | Q9UNF0 | protein_coding | TCGA-B6-A0I8-01 | Breast | breast invasive carcinoma | Female | <65 | I/II | Unknown | Unknown | PD | ||
| PACSIN2 | SNV | Missense_Mutation | c.205N>A | p.Leu69Ile | p.L69I | Q9UNF0 | protein_coding | tolerated(0.07) | possibly_damaging(0.899) | TCGA-DR-A0ZM-01 | Cervix | cervical & endocervical cancer | Female | <65 | III/IV | Unspecific | Cisplatin | SD | |
| PACSIN2 | SNV | Missense_Mutation | c.894N>C | p.Trp298Cys | p.W298C | Q9UNF0 | protein_coding | deleterious(0) | probably_damaging(0.921) | TCGA-AA-3492-01 | Colorectum | colon adenocarcinoma | Female | >=65 | I/II | Unknown | Unknown | SD | |
| PACSIN2 | SNV | Missense_Mutation | rs531993562 | c.1258N>A | p.Asp420Asn | p.D420N | Q9UNF0 | protein_coding | tolerated(0.07) | benign(0.01) | TCGA-AA-A00N-01 | Colorectum | colon adenocarcinoma | Male | >=65 | I/II | Unknown | Unknown | PD |
| Page: 1 2 3 4 5 |
Top |
Related drugs of malignant transformation related genes |
| Identification of chemicals and drugs interact with genes involved in malignant transfromation |
| (DGIdb 4.0) |
| Entrez ID | Symbol | Category | Interaction Types | Drug Claim Name | Drug Name | PMIDs |
| 11252 | PACSIN2 | KINASE, TRANSPORTER | methotrexate | METHOTREXATE | 22846425 | |
| 11252 | PACSIN2 | KINASE, TRANSPORTER | mercaptopurine | MERCAPTOPURINE | 22846425,27452984 |
| Page: 1 |

Copyright 2023-Present -The University of Texas Health Science Center at Houston |