
|
|||||
|
 | |
| |
| |
| |
| |
| |
|
Gene: PACS2 |
Gene summary for PACS2 |
| Gene information | Species | Human | Gene symbol | PACS2 | Gene ID | 23241 |
| Gene name | phosphofurin acidic cluster sorting protein 2 | |
| Gene Alias | DEE66 | |
| Cytomap | 14q32.33 | |
| Gene Type | protein-coding | GO ID | GO:0000045 | UniProtAcc | Q86VP3 |
Top |
Malignant transformation analysis |
| Identification of the aberrant gene expression in precancerous and cancerous lesions by comparing the gene expression of stem-like cells in diseased tissues with normal stem cells |
| Entrez ID | Symbol | Replicates | Species | Organ | Tissue | Adj P-value | Log2FC | Malignancy |
| 23241 | PACS2 | LZE20T | Human | Esophagus | ESCC | 3.40e-03 | 1.86e-01 | 0.0662 |
| 23241 | PACS2 | LZE24T | Human | Esophagus | ESCC | 2.75e-06 | 1.82e-01 | 0.0596 |
| 23241 | PACS2 | P1T-E | Human | Esophagus | ESCC | 3.38e-12 | 4.04e-01 | 0.0875 |
| 23241 | PACS2 | P4T-E | Human | Esophagus | ESCC | 2.31e-05 | 1.13e-01 | 0.1323 |
| 23241 | PACS2 | P5T-E | Human | Esophagus | ESCC | 5.00e-12 | 2.76e-01 | 0.1327 |
| 23241 | PACS2 | P8T-E | Human | Esophagus | ESCC | 3.23e-14 | 2.30e-01 | 0.0889 |
| 23241 | PACS2 | P10T-E | Human | Esophagus | ESCC | 3.89e-16 | 2.71e-01 | 0.116 |
| 23241 | PACS2 | P12T-E | Human | Esophagus | ESCC | 2.76e-08 | 2.12e-01 | 0.1122 |
| 23241 | PACS2 | P15T-E | Human | Esophagus | ESCC | 1.91e-17 | 4.09e-01 | 0.1149 |
| 23241 | PACS2 | P16T-E | Human | Esophagus | ESCC | 1.15e-04 | 2.61e-02 | 0.1153 |
| 23241 | PACS2 | P21T-E | Human | Esophagus | ESCC | 9.64e-06 | 1.03e-01 | 0.1617 |
| 23241 | PACS2 | P22T-E | Human | Esophagus | ESCC | 1.13e-05 | 9.69e-02 | 0.1236 |
| 23241 | PACS2 | P23T-E | Human | Esophagus | ESCC | 2.34e-04 | 8.27e-02 | 0.108 |
| 23241 | PACS2 | P24T-E | Human | Esophagus | ESCC | 5.97e-05 | 9.60e-02 | 0.1287 |
| 23241 | PACS2 | P26T-E | Human | Esophagus | ESCC | 9.82e-10 | 1.32e-01 | 0.1276 |
| 23241 | PACS2 | P27T-E | Human | Esophagus | ESCC | 4.11e-19 | 2.19e-01 | 0.1055 |
| 23241 | PACS2 | P28T-E | Human | Esophagus | ESCC | 1.98e-13 | 2.56e-01 | 0.1149 |
| 23241 | PACS2 | P30T-E | Human | Esophagus | ESCC | 5.93e-04 | 2.38e-01 | 0.137 |
| 23241 | PACS2 | P31T-E | Human | Esophagus | ESCC | 9.49e-08 | 1.55e-01 | 0.1251 |
| 23241 | PACS2 | P32T-E | Human | Esophagus | ESCC | 1.25e-06 | 1.18e-01 | 0.1666 |
| Page: 1 2 3 |
| Tissue | Expression Dynamics | Abbreviation |
| Esophagus | 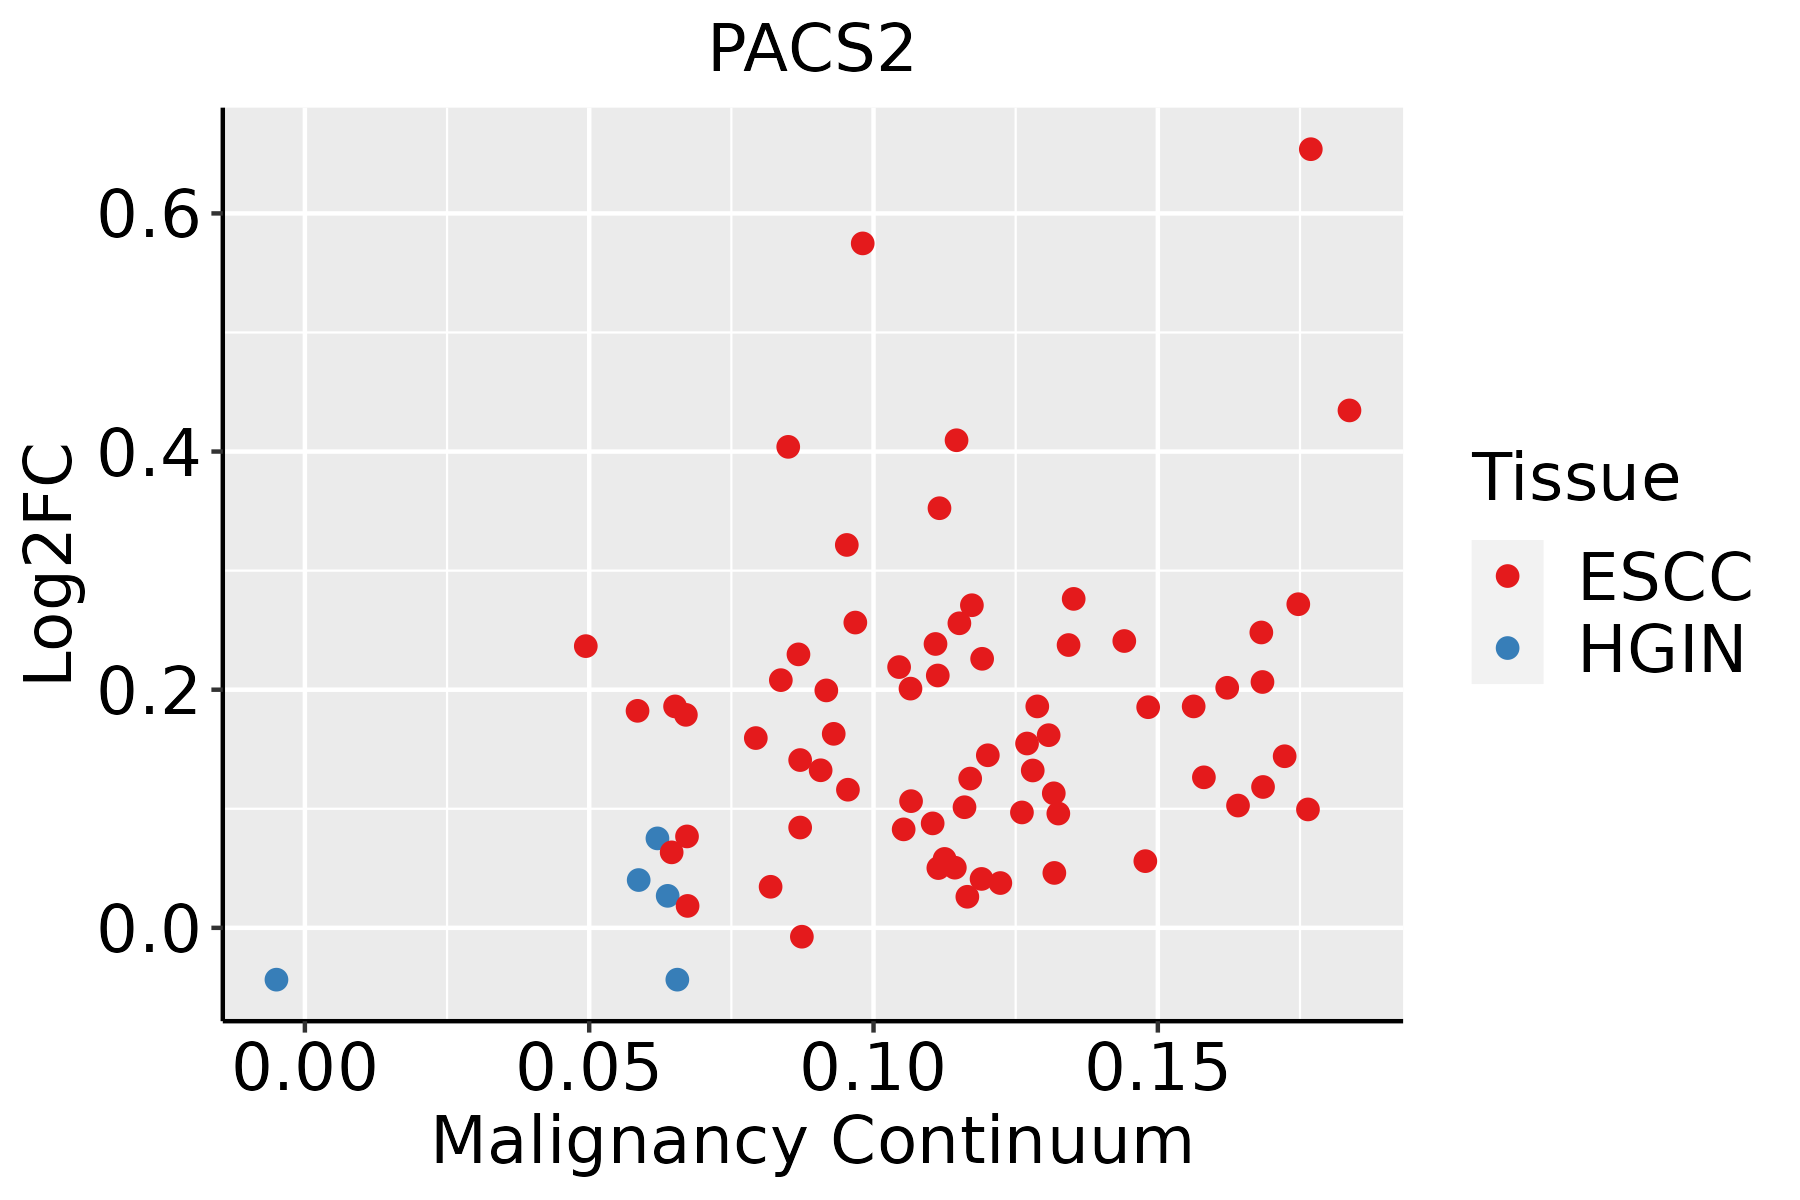 | ESCC: Esophageal squamous cell carcinoma |
| HGIN: High-grade intraepithelial neoplasias | ||
| LGIN: Low-grade intraepithelial neoplasias | ||
| Liver |  | HCC: Hepatocellular carcinoma |
| NAFLD: Non-alcoholic fatty liver disease |
| ∗log2FC in expression of this searched gene in stem-like cells from each diseased tissue sample relative to stem-like cells in normal samples in each tissue plotted against the malignancy continuum. Samples are colored based on if they are from different disease stage. |
Top |
Malignant transformation related pathway analysis |
| Find out the enriched GO biological processes and KEGG pathways involved in transition from healthy to precancer to cancer |
| Tissue | Disease Stage | Enriched GO biological Processes |
| Colorectum | AD |  |
| Colorectum | SER |  |
| Colorectum | MSS |  |
| Colorectum | MSI-H |  |
| Colorectum | FAP |  |
| ∗Top 15 enriched GO BP terms are showed in the bar plot of each disease state in each tissue. Each row represents a significant GO biological process which is colored according to the -log10(p.adjust). |
| Page: 1 2 3 4 5 6 7 8 9 |
| GO ID | Tissue | Disease Stage | Description | Gene Ratio | Bg Ratio | pvalue | p.adjust | Count |
| GO:001623617 | Esophagus | ESCC | macroautophagy | 216/8552 | 291/18723 | 1.94e-23 | 4.57e-21 | 216 |
| GO:0072659110 | Esophagus | ESCC | protein localization to plasma membrane | 193/8552 | 284/18723 | 1.95e-14 | 1.03e-12 | 193 |
| GO:199077819 | Esophagus | ESCC | protein localization to cell periphery | 217/8552 | 333/18723 | 4.08e-13 | 1.88e-11 | 217 |
| GO:000703314 | Esophagus | ESCC | vacuole organization | 127/8552 | 180/18723 | 1.04e-11 | 3.85e-10 | 127 |
| GO:190503712 | Esophagus | ESCC | autophagosome organization | 73/8552 | 103/18723 | 1.88e-07 | 2.93e-06 | 73 |
| GO:00224069 | Esophagus | ESCC | membrane docking | 62/8552 | 86/18723 | 5.93e-07 | 7.79e-06 | 62 |
| GO:000004513 | Esophagus | ESCC | autophagosome assembly | 69/8552 | 99/18723 | 1.10e-06 | 1.38e-05 | 69 |
| GO:01400567 | Esophagus | ESCC | organelle localization by membrane tethering | 53/8552 | 77/18723 | 3.33e-05 | 2.74e-04 | 53 |
| GO:0032469110 | Esophagus | ESCC | endoplasmic reticulum calcium ion homeostasis | 21/8552 | 25/18723 | 9.12e-05 | 6.54e-04 | 21 |
| GO:00726597 | Liver | NAFLD | protein localization to plasma membrane | 51/1882 | 284/18723 | 2.97e-05 | 7.83e-04 | 51 |
| GO:19907786 | Liver | NAFLD | protein localization to cell periphery | 56/1882 | 333/18723 | 8.29e-05 | 1.69e-03 | 56 |
| GO:00162365 | Liver | NAFLD | macroautophagy | 45/1882 | 291/18723 | 2.31e-03 | 2.19e-02 | 45 |
| GO:001623621 | Liver | HCC | macroautophagy | 204/7958 | 291/18723 | 8.66e-22 | 1.41e-19 | 204 |
| GO:007265921 | Liver | HCC | protein localization to plasma membrane | 177/7958 | 284/18723 | 1.02e-11 | 4.18e-10 | 177 |
| GO:199077821 | Liver | HCC | protein localization to cell periphery | 200/7958 | 333/18723 | 6.07e-11 | 2.23e-09 | 200 |
| GO:000703311 | Liver | HCC | vacuole organization | 119/7958 | 180/18723 | 1.22e-10 | 4.25e-09 | 119 |
| GO:19050371 | Liver | HCC | autophagosome organization | 70/7958 | 103/18723 | 1.52e-07 | 2.82e-06 | 70 |
| GO:00000451 | Liver | HCC | autophagosome assembly | 67/7958 | 99/18723 | 3.56e-07 | 6.07e-06 | 67 |
| GO:002240611 | Liver | HCC | membrane docking | 57/7958 | 86/18723 | 7.14e-06 | 8.47e-05 | 57 |
| GO:014005611 | Liver | HCC | organelle localization by membrane tethering | 49/7958 | 77/18723 | 1.46e-04 | 1.18e-03 | 49 |
| Page: 1 2 |
| Pathway ID | Tissue | Disease Stage | Description | Gene Ratio | Bg Ratio | pvalue | p.adjust | qvalue | Count |
| Page: 1 |
Top |
Cell-cell communication analysis |
| Identification of potential cell-cell interactions between two cell types and their ligand-receptor pairs for different disease states |
| Ligand | Receptor | LRpair | Pathway | Tissue | Disease Stage |
| Page: 1 |
Top |
Single-cell gene regulatory network inference analysis |
| Find out the significant the regulons (TFs) and the target genes of each regulon across cell types for different disease states |
| TF | Cell Type | Tissue | Disease Stage | Target Gene | RSS | Regulon Activity |
| ∗The dot plots of a searched regulon are shown for all cell subpopulations in each disease state of each tissue based on the regulon specific score inferred using pySCENIC and by calculating the average expression. |
| Page: 1 |
Top |
Somatic mutation of malignant transformation related genes |
| Annotation of somatic variants for genes involved in malignant transformation |
| Hugo Symbol | Variant Class | Variant Classification | dbSNP RS | HGVSc | HGVSp | HGVSp Short | SWISSPROT | BIOTYPE | SIFT | PolyPhen | Tumor Sample Barcode | Tissue | Histology | Sex | Age | Stage | Therapy Types | Drugs | Outcome |
| PACS2 | SNV | Missense_Mutation | c.2237N>A | p.Gly746Glu | p.G746E | Q86VP3 | protein_coding | tolerated(0.1) | benign(0.299) | TCGA-AC-A23H-01 | Breast | breast invasive carcinoma | Female | >=65 | I/II | Unknown | Unknown | PD | |
| PACS2 | SNV | Missense_Mutation | c.2035C>G | p.Pro679Ala | p.P679A | Q86VP3 | protein_coding | deleterious(0.01) | benign(0.236) | TCGA-AN-A0XO-01 | Breast | breast invasive carcinoma | Female | <65 | III/IV | Unknown | Unknown | SD | |
| PACS2 | SNV | Missense_Mutation | rs781996736 | c.812C>T | p.Ser271Leu | p.S271L | Q86VP3 | protein_coding | tolerated(0.82) | benign(0.006) | TCGA-BH-A0DX-01 | Breast | breast invasive carcinoma | Female | <65 | I/II | Chemotherapy | taxotere | CR |
| PACS2 | SNV | Missense_Mutation | c.618C>A | p.Phe206Leu | p.F206L | Q86VP3 | protein_coding | deleterious(0.02) | possibly_damaging(0.511) | TCGA-BH-A1EV-01 | Breast | breast invasive carcinoma | Female | <65 | III/IV | Unknown | Unknown | PD | |
| PACS2 | SNV | Missense_Mutation | novel | c.2515G>A | p.Asp839Asn | p.D839N | Q86VP3 | protein_coding | deleterious(0.04) | possibly_damaging(0.76) | TCGA-BH-A208-01 | Breast | breast invasive carcinoma | Female | <65 | I/II | Unknown | Unknown | SD |
| PACS2 | SNV | Missense_Mutation | c.607N>C | p.Tyr203His | p.Y203H | Q86VP3 | protein_coding | tolerated(0.55) | probably_damaging(0.935) | TCGA-D8-A1XQ-01 | Breast | breast invasive carcinoma | Female | >=65 | I/II | Unknown | Unknown | SD | |
| PACS2 | insertion | Nonsense_Mutation | novel | c.271_272insGGGCAACATGACTAATCCTTGTCTCTT | p.Asp91delinsGlyAlaThrTerLeuIleLeuValSerTyr | p.D91delinsGAT*LILVSY | Q86VP3 | protein_coding | TCGA-A8-A0A6-01 | Breast | breast invasive carcinoma | Female | <65 | III/IV | Chemotherapy | epirubicin | CR | ||
| PACS2 | SNV | Missense_Mutation | rs782050259 | c.392N>T | p.Thr131Met | p.T131M | Q86VP3 | protein_coding | deleterious(0.02) | probably_damaging(0.977) | TCGA-EA-A410-01 | Cervix | cervical & endocervical cancer | Female | <65 | I/II | Unknown | Unknown | SD |
| PACS2 | SNV | Missense_Mutation | rs587614619 | c.1063N>A | p.Glu355Lys | p.E355K | Q86VP3 | protein_coding | tolerated(0.17) | benign(0.373) | TCGA-EK-A2IP-01 | Cervix | cervical & endocervical cancer | Female | <65 | I/II | Unknown | Unknown | SD |
| PACS2 | SNV | Missense_Mutation | c.1310N>T | p.Ser437Phe | p.S437F | Q86VP3 | protein_coding | deleterious(0.04) | benign(0.234) | TCGA-FU-A3NI-01 | Cervix | cervical & endocervical cancer | Female | <65 | I/II | Unknown | Unknown | SD |
| Page: 1 2 3 4 5 6 7 8 9 10 |
Top |
Related drugs of malignant transformation related genes |
| Identification of chemicals and drugs interact with genes involved in malignant transfromation |
| (DGIdb 4.0) |
| Entrez ID | Symbol | Category | Interaction Types | Drug Claim Name | Drug Name | PMIDs |
| Page: 1 |

Copyright 2023-Present -The University of Texas Health Science Center at Houston |