
|
|||||
|
 | |
| |
| |
| |
| |
| |
|
Gene: PABPN1 |
Gene summary for PABPN1 |
| Gene information | Species | Human | Gene symbol | PABPN1 | Gene ID | 8106 |
| Gene name | poly(A) binding protein nuclear 1 | |
| Gene Alias | OPMD | |
| Cytomap | 14q11.2 | |
| Gene Type | protein-coding | GO ID | GO:0000165 | UniProtAcc | Q86U42 |
Top |
Malignant transformation analysis |
| Identification of the aberrant gene expression in precancerous and cancerous lesions by comparing the gene expression of stem-like cells in diseased tissues with normal stem cells |
| Entrez ID | Symbol | Replicates | Species | Organ | Tissue | Adj P-value | Log2FC | Malignancy |
| 8106 | PABPN1 | HTA11_3410_2000001011 | Human | Colorectum | AD | 1.81e-30 | 6.98e-01 | 0.0155 |
| 8106 | PABPN1 | HTA11_2487_2000001011 | Human | Colorectum | SER | 1.20e-29 | 1.04e+00 | -0.1808 |
| 8106 | PABPN1 | HTA11_2951_2000001011 | Human | Colorectum | AD | 1.84e-06 | 7.26e-01 | 0.0216 |
| 8106 | PABPN1 | HTA11_1938_2000001011 | Human | Colorectum | AD | 1.40e-39 | 1.43e+00 | -0.0811 |
| 8106 | PABPN1 | HTA11_78_2000001011 | Human | Colorectum | AD | 1.93e-21 | 8.98e-01 | -0.1088 |
| 8106 | PABPN1 | HTA11_347_2000001011 | Human | Colorectum | AD | 1.18e-71 | 1.41e+00 | -0.1954 |
| 8106 | PABPN1 | HTA11_411_2000001011 | Human | Colorectum | SER | 9.96e-12 | 1.24e+00 | -0.2602 |
| 8106 | PABPN1 | HTA11_2112_2000001011 | Human | Colorectum | SER | 3.60e-20 | 1.29e+00 | -0.2196 |
| 8106 | PABPN1 | HTA11_3361_2000001011 | Human | Colorectum | AD | 1.37e-20 | 1.01e+00 | -0.1207 |
| 8106 | PABPN1 | HTA11_83_2000001011 | Human | Colorectum | SER | 7.01e-24 | 9.50e-01 | -0.1526 |
| 8106 | PABPN1 | HTA11_696_2000001011 | Human | Colorectum | AD | 2.86e-56 | 1.23e+00 | -0.1464 |
| 8106 | PABPN1 | HTA11_866_2000001011 | Human | Colorectum | AD | 9.57e-37 | 8.77e-01 | -0.1001 |
| 8106 | PABPN1 | HTA11_1391_2000001011 | Human | Colorectum | AD | 1.99e-48 | 1.45e+00 | -0.059 |
| 8106 | PABPN1 | HTA11_2992_2000001011 | Human | Colorectum | SER | 3.35e-18 | 8.80e-01 | -0.1706 |
| 8106 | PABPN1 | HTA11_5212_2000001011 | Human | Colorectum | AD | 2.53e-08 | 7.31e-01 | -0.2061 |
| 8106 | PABPN1 | HTA11_5216_2000001011 | Human | Colorectum | SER | 6.52e-10 | 8.86e-01 | -0.1462 |
| 8106 | PABPN1 | HTA11_546_2000001011 | Human | Colorectum | AD | 7.61e-18 | 1.01e+00 | -0.0842 |
| 8106 | PABPN1 | HTA11_9341_2000001011 | Human | Colorectum | SER | 2.42e-08 | 8.97e-01 | -0.00410000000000005 |
| 8106 | PABPN1 | HTA11_7862_2000001011 | Human | Colorectum | AD | 4.49e-25 | 1.17e+00 | -0.0179 |
| 8106 | PABPN1 | HTA11_866_3004761011 | Human | Colorectum | AD | 9.33e-48 | 1.21e+00 | 0.096 |
| Page: 1 2 3 4 5 6 7 8 9 10 |
| Tissue | Expression Dynamics | Abbreviation |
| Colorectum (GSE201348) | 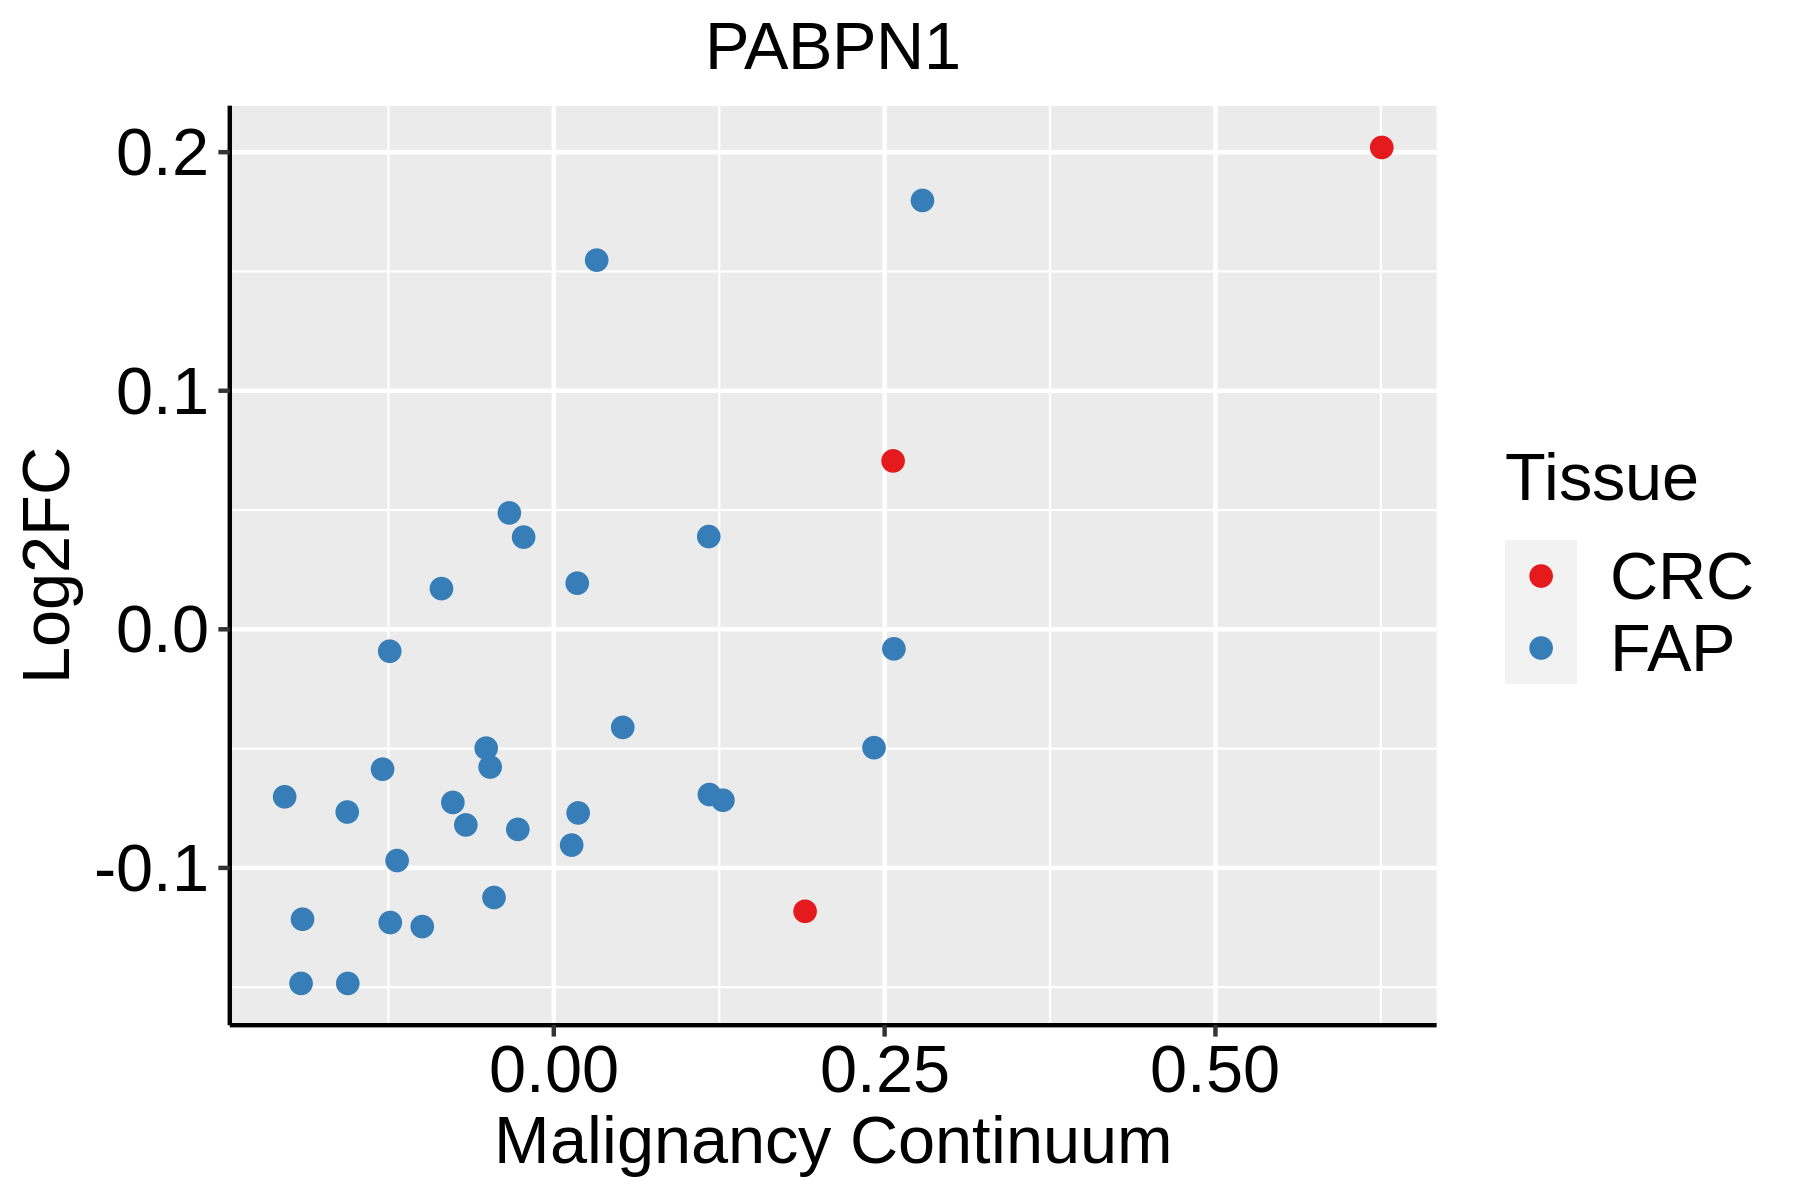 | FAP: Familial adenomatous polyposis |
| CRC: Colorectal cancer | ||
| Colorectum (HTA11) |  | AD: Adenomas |
| SER: Sessile serrated lesions | ||
| MSI-H: Microsatellite-high colorectal cancer | ||
| MSS: Microsatellite stable colorectal cancer | ||
| Endometrium |  | AEH: Atypical endometrial hyperplasia |
| EEC: Endometrioid Cancer | ||
| Esophagus | 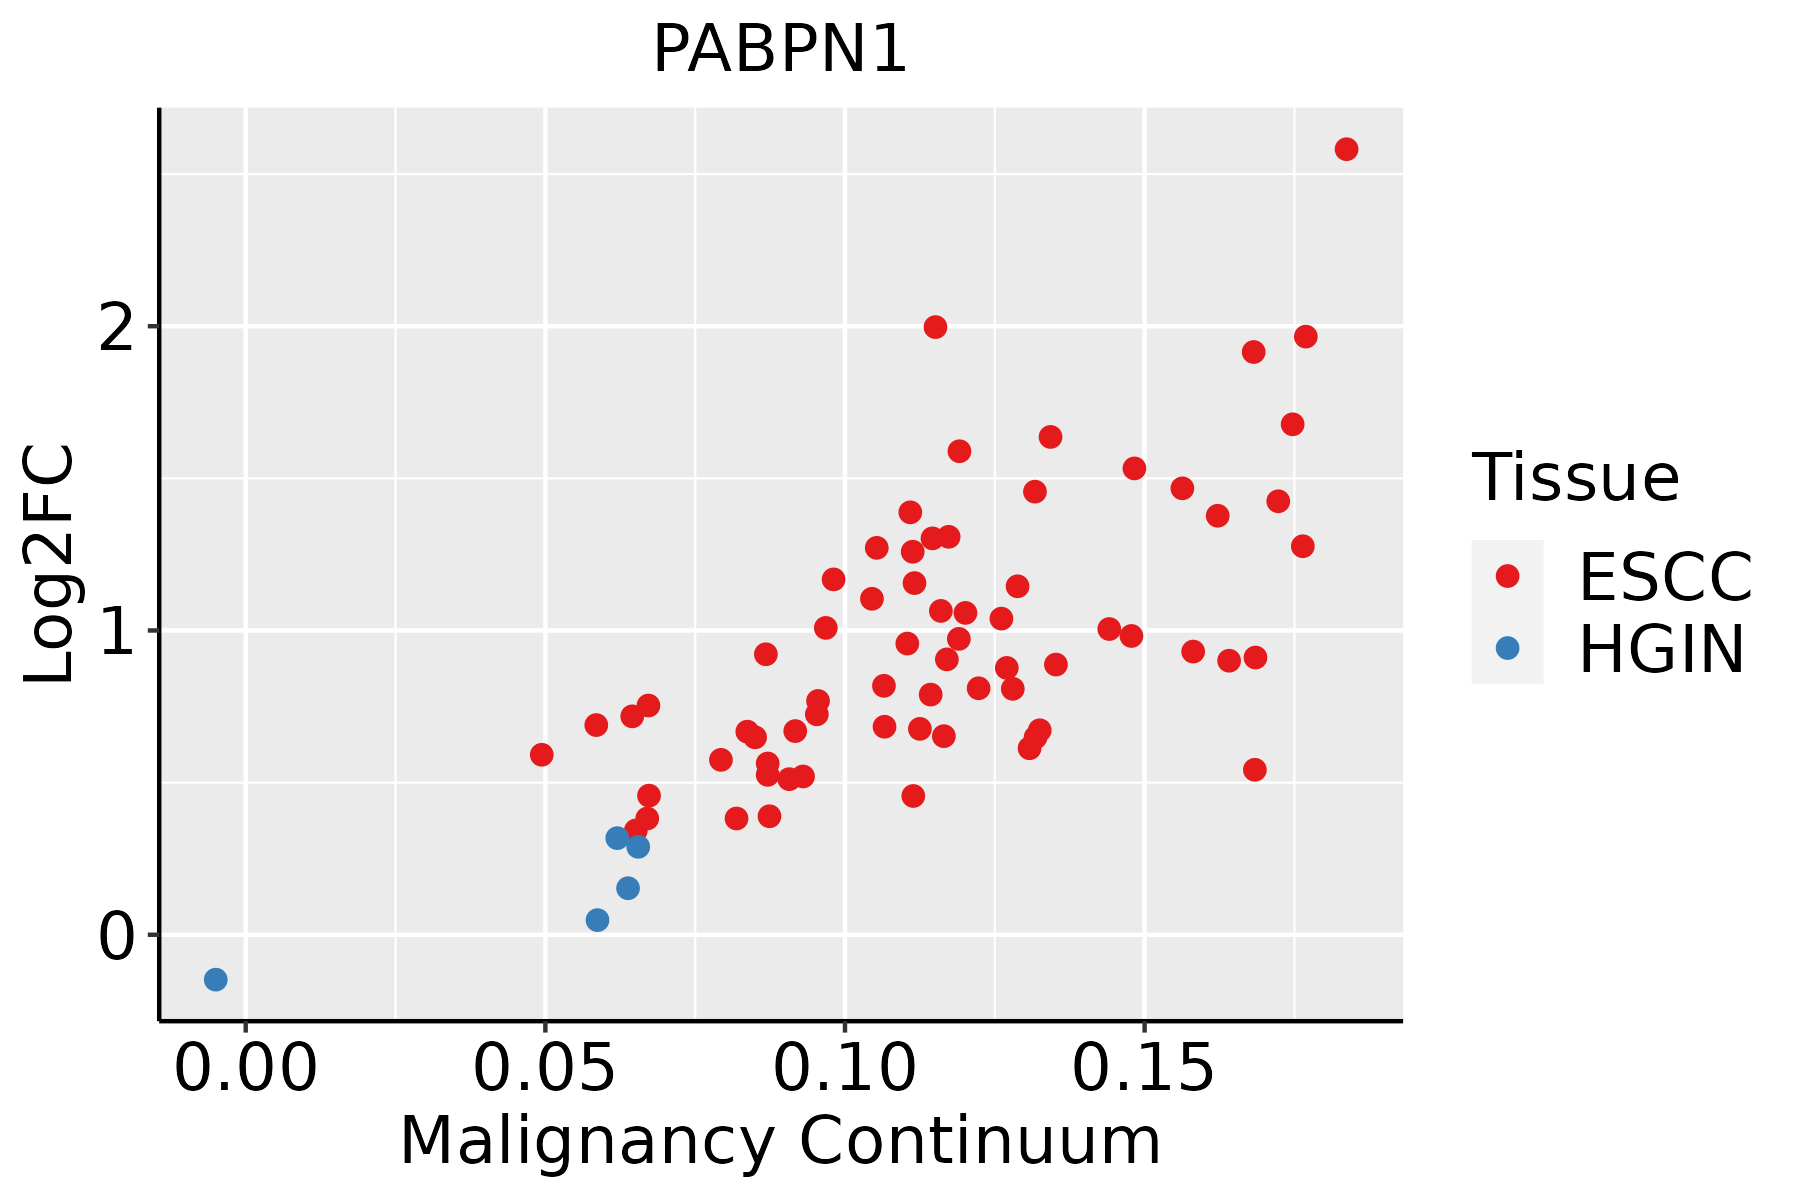 | ESCC: Esophageal squamous cell carcinoma |
| HGIN: High-grade intraepithelial neoplasias | ||
| LGIN: Low-grade intraepithelial neoplasias | ||
| Liver |  | HCC: Hepatocellular carcinoma |
| NAFLD: Non-alcoholic fatty liver disease | ||
| Oral Cavity | 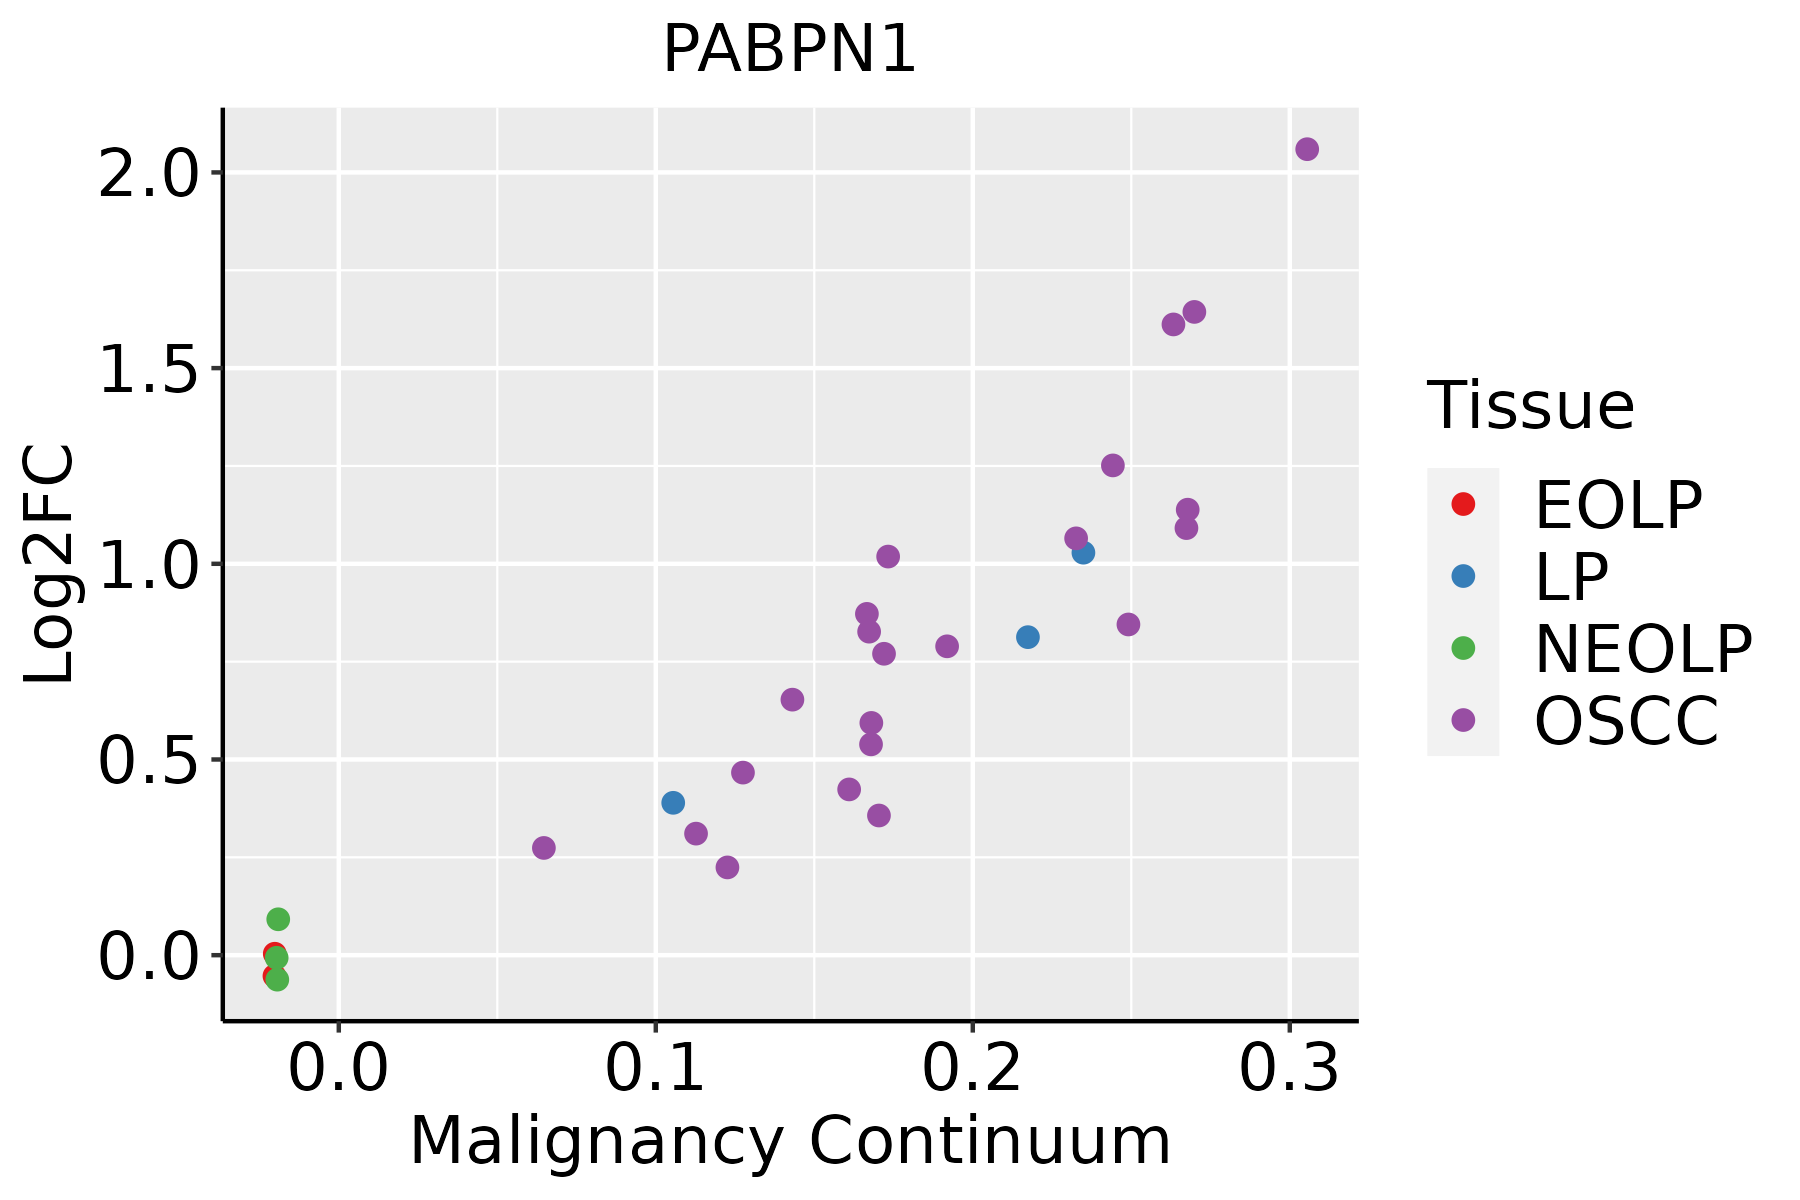 | EOLP: Erosive Oral lichen planus |
| LP: leukoplakia | ||
| NEOLP: Non-erosive oral lichen planus | ||
| OSCC: Oral squamous cell carcinoma | ||
| Prostate | 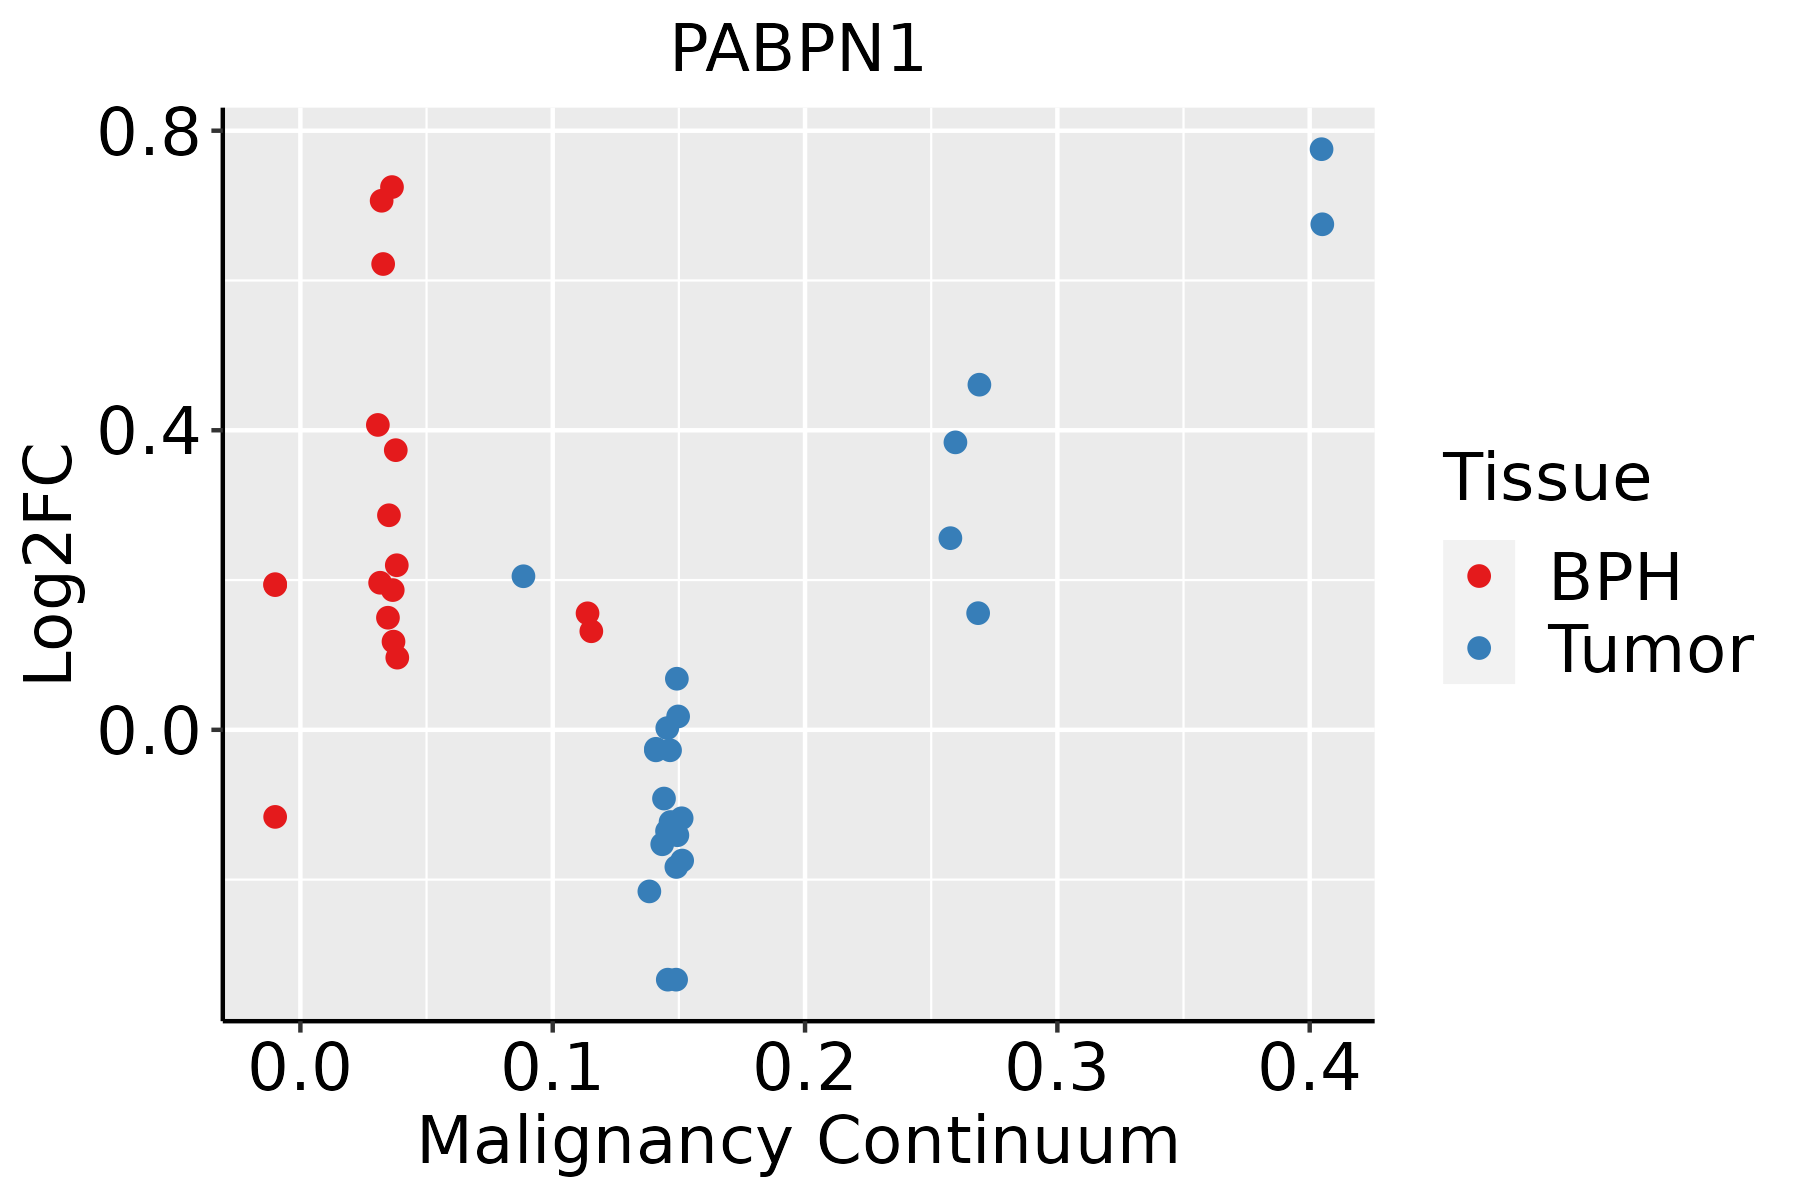 | BPH: Benign Prostatic Hyperplasia |
| Skin | 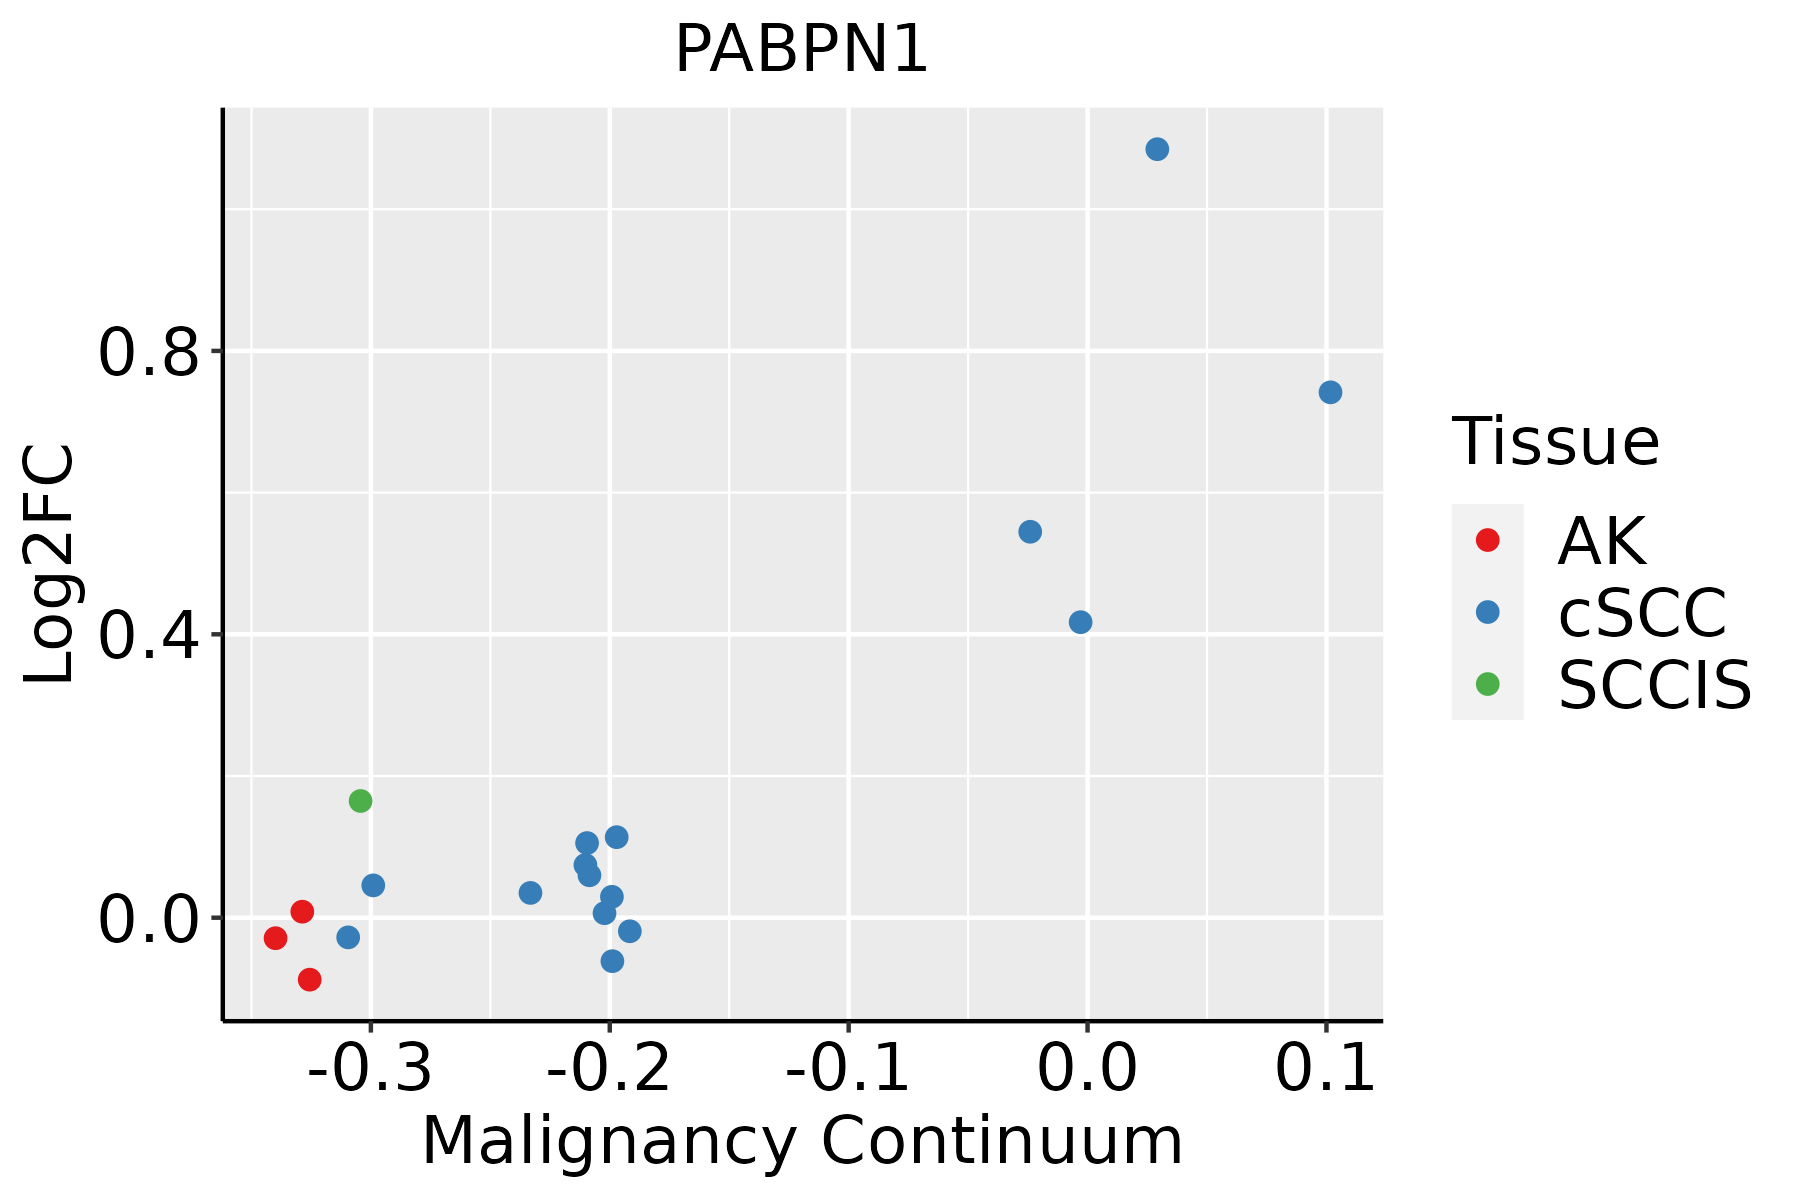 | AK: Actinic keratosis |
| cSCC: Cutaneous squamous cell carcinoma | ||
| SCCIS:squamous cell carcinoma in situ | ||
| Thyroid | 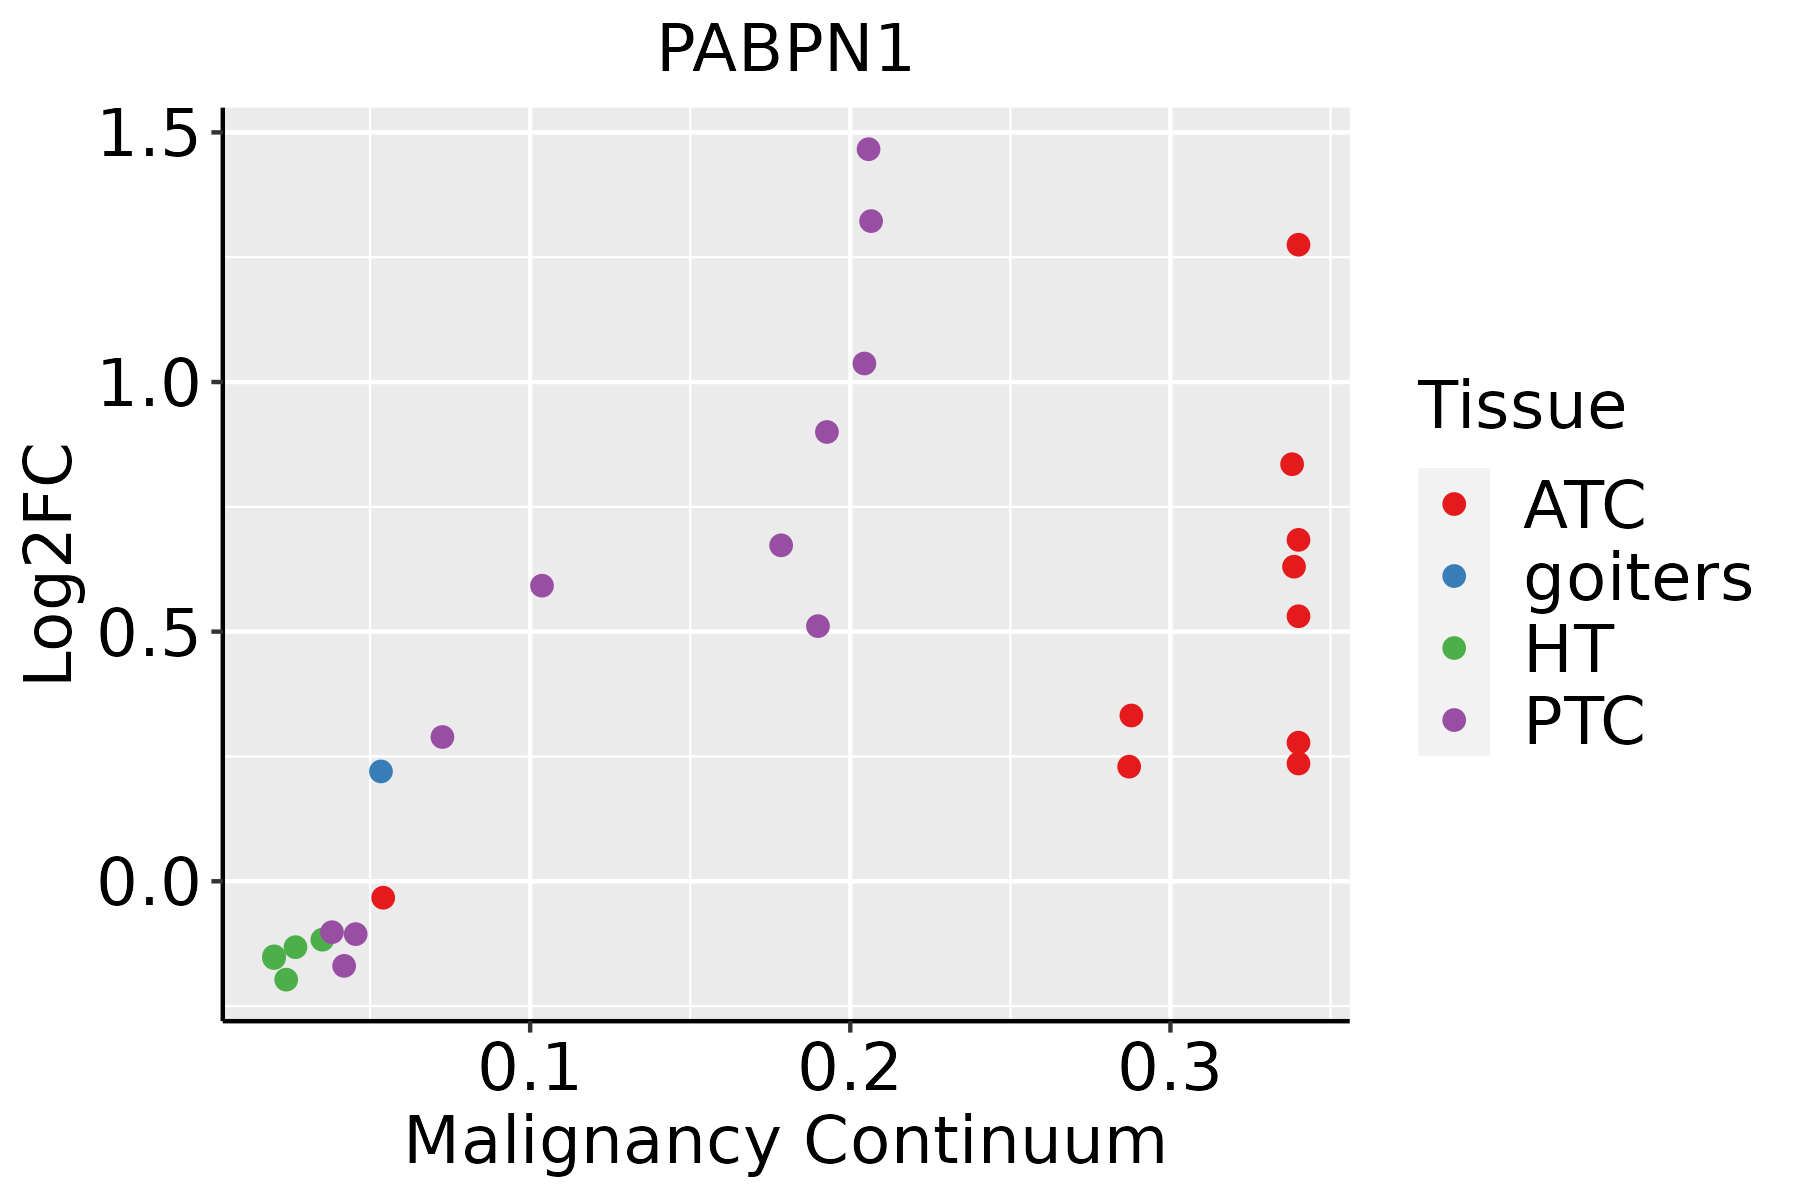 | ATC: Anaplastic thyroid cancer |
| HT: Hashimoto's thyroiditis | ||
| PTC: Papillary thyroid cancer |
| ∗log2FC in expression of this searched gene in stem-like cells from each diseased tissue sample relative to stem-like cells in normal samples in each tissue plotted against the malignancy continuum. Samples are colored based on if they are from different disease stage. |
Top |
Malignant transformation related pathway analysis |
| Find out the enriched GO biological processes and KEGG pathways involved in transition from healthy to precancer to cancer |
| Tissue | Disease Stage | Enriched GO biological Processes |
| Colorectum | AD |  |
| Colorectum | SER |  |
| Colorectum | MSS |  |
| Colorectum | MSI-H |  |
| Colorectum | FAP |  |
| ∗Top 15 enriched GO BP terms are showed in the bar plot of each disease state in each tissue. Each row represents a significant GO biological process which is colored according to the -log10(p.adjust). |
| Page: 1 2 3 4 5 6 7 8 9 |
| GO ID | Tissue | Disease Stage | Description | Gene Ratio | Bg Ratio | pvalue | p.adjust | Count |
| GO:0006913 | Colorectum | AD | nucleocytoplasmic transport | 102/3918 | 301/18723 | 1.00e-07 | 4.85e-06 | 102 |
| GO:0051169 | Colorectum | AD | nuclear transport | 102/3918 | 301/18723 | 1.00e-07 | 4.85e-06 | 102 |
| GO:0006403 | Colorectum | AD | RNA localization | 71/3918 | 201/18723 | 1.54e-06 | 4.76e-05 | 71 |
| GO:0051236 | Colorectum | AD | establishment of RNA localization | 58/3918 | 166/18723 | 1.95e-05 | 4.01e-04 | 58 |
| GO:0015931 | Colorectum | AD | nucleobase-containing compound transport | 73/3918 | 222/18723 | 2.02e-05 | 4.10e-04 | 73 |
| GO:0050657 | Colorectum | AD | nucleic acid transport | 57/3918 | 163/18723 | 2.22e-05 | 4.39e-04 | 57 |
| GO:0050658 | Colorectum | AD | RNA transport | 57/3918 | 163/18723 | 2.22e-05 | 4.39e-04 | 57 |
| GO:0051168 | Colorectum | AD | nuclear export | 53/3918 | 154/18723 | 6.89e-05 | 1.11e-03 | 53 |
| GO:0051028 | Colorectum | AD | mRNA transport | 42/3918 | 130/18723 | 1.57e-03 | 1.32e-02 | 42 |
| GO:00069131 | Colorectum | SER | nucleocytoplasmic transport | 77/2897 | 301/18723 | 3.39e-06 | 1.32e-04 | 77 |
| GO:00511691 | Colorectum | SER | nuclear transport | 77/2897 | 301/18723 | 3.39e-06 | 1.32e-04 | 77 |
| GO:00064031 | Colorectum | SER | RNA localization | 53/2897 | 201/18723 | 4.51e-05 | 1.13e-03 | 53 |
| GO:00511681 | Colorectum | SER | nuclear export | 42/2897 | 154/18723 | 1.19e-04 | 2.46e-03 | 42 |
| GO:00159311 | Colorectum | SER | nucleobase-containing compound transport | 54/2897 | 222/18723 | 3.65e-04 | 5.67e-03 | 54 |
| GO:00512361 | Colorectum | SER | establishment of RNA localization | 42/2897 | 166/18723 | 6.70e-04 | 8.96e-03 | 42 |
| GO:00506571 | Colorectum | SER | nucleic acid transport | 41/2897 | 163/18723 | 8.74e-04 | 1.06e-02 | 41 |
| GO:00506581 | Colorectum | SER | RNA transport | 41/2897 | 163/18723 | 8.74e-04 | 1.06e-02 | 41 |
| GO:0003012 | Colorectum | SER | muscle system process | 92/2897 | 452/18723 | 2.98e-03 | 2.63e-02 | 92 |
| GO:00069132 | Colorectum | MSS | nucleocytoplasmic transport | 99/3467 | 301/18723 | 1.35e-09 | 1.03e-07 | 99 |
| GO:00511692 | Colorectum | MSS | nuclear transport | 99/3467 | 301/18723 | 1.35e-09 | 1.03e-07 | 99 |
| Page: 1 2 3 4 5 6 7 8 9 10 11 12 13 |
| Pathway ID | Tissue | Disease Stage | Description | Gene Ratio | Bg Ratio | pvalue | p.adjust | qvalue | Count |
| hsa03015 | Colorectum | AD | mRNA surveillance pathway | 35/2092 | 97/8465 | 7.95e-03 | 3.13e-02 | 2.00e-02 | 35 |
| hsa030151 | Colorectum | AD | mRNA surveillance pathway | 35/2092 | 97/8465 | 7.95e-03 | 3.13e-02 | 2.00e-02 | 35 |
| hsa030159 | Esophagus | HGIN | mRNA surveillance pathway | 30/1383 | 97/8465 | 2.48e-04 | 2.69e-03 | 2.14e-03 | 30 |
| hsa0516420 | Esophagus | HGIN | Influenza A | 42/1383 | 171/8465 | 3.41e-03 | 2.54e-02 | 2.02e-02 | 42 |
| hsa0301514 | Esophagus | HGIN | mRNA surveillance pathway | 30/1383 | 97/8465 | 2.48e-04 | 2.69e-03 | 2.14e-03 | 30 |
| hsa05164110 | Esophagus | HGIN | Influenza A | 42/1383 | 171/8465 | 3.41e-03 | 2.54e-02 | 2.02e-02 | 42 |
| hsa0516425 | Esophagus | ESCC | Influenza A | 122/4205 | 171/8465 | 5.01e-09 | 4.79e-08 | 2.45e-08 | 122 |
| hsa0301524 | Esophagus | ESCC | mRNA surveillance pathway | 72/4205 | 97/8465 | 6.12e-07 | 4.10e-06 | 2.10e-06 | 72 |
| hsa0516435 | Esophagus | ESCC | Influenza A | 122/4205 | 171/8465 | 5.01e-09 | 4.79e-08 | 2.45e-08 | 122 |
| hsa0301534 | Esophagus | ESCC | mRNA surveillance pathway | 72/4205 | 97/8465 | 6.12e-07 | 4.10e-06 | 2.10e-06 | 72 |
| hsa030154 | Liver | Cirrhotic | mRNA surveillance pathway | 46/2530 | 97/8465 | 1.92e-04 | 1.30e-03 | 8.03e-04 | 46 |
| hsa0516410 | Liver | Cirrhotic | Influenza A | 66/2530 | 171/8465 | 8.56e-03 | 2.91e-02 | 1.79e-02 | 66 |
| hsa0301511 | Liver | Cirrhotic | mRNA surveillance pathway | 46/2530 | 97/8465 | 1.92e-04 | 1.30e-03 | 8.03e-04 | 46 |
| hsa0516411 | Liver | Cirrhotic | Influenza A | 66/2530 | 171/8465 | 8.56e-03 | 2.91e-02 | 1.79e-02 | 66 |
| hsa0301521 | Liver | HCC | mRNA surveillance pathway | 66/4020 | 97/8465 | 3.16e-05 | 1.88e-04 | 1.04e-04 | 66 |
| hsa0516421 | Liver | HCC | Influenza A | 101/4020 | 171/8465 | 1.41e-03 | 5.07e-03 | 2.82e-03 | 101 |
| hsa0301531 | Liver | HCC | mRNA surveillance pathway | 66/4020 | 97/8465 | 3.16e-05 | 1.88e-04 | 1.04e-04 | 66 |
| hsa0516431 | Liver | HCC | Influenza A | 101/4020 | 171/8465 | 1.41e-03 | 5.07e-03 | 2.82e-03 | 101 |
| hsa030158 | Oral cavity | OSCC | mRNA surveillance pathway | 75/3704 | 97/8465 | 1.30e-11 | 2.01e-10 | 1.02e-10 | 75 |
| hsa0516418 | Oral cavity | OSCC | Influenza A | 116/3704 | 171/8465 | 1.23e-10 | 1.78e-09 | 9.08e-10 | 116 |
| Page: 1 2 |
Top |
Cell-cell communication analysis |
| Identification of potential cell-cell interactions between two cell types and their ligand-receptor pairs for different disease states |
| Ligand | Receptor | LRpair | Pathway | Tissue | Disease Stage |
| Page: 1 |
Top |
Single-cell gene regulatory network inference analysis |
| Find out the significant the regulons (TFs) and the target genes of each regulon across cell types for different disease states |
| TF | Cell Type | Tissue | Disease Stage | Target Gene | RSS | Regulon Activity |
| ∗The dot plots of a searched regulon are shown for all cell subpopulations in each disease state of each tissue based on the regulon specific score inferred using pySCENIC and by calculating the average expression. |
| Page: 1 |
Top |
Somatic mutation of malignant transformation related genes |
| Annotation of somatic variants for genes involved in malignant transformation |
| Hugo Symbol | Variant Class | Variant Classification | dbSNP RS | HGVSc | HGVSp | HGVSp Short | SWISSPROT | BIOTYPE | SIFT | PolyPhen | Tumor Sample Barcode | Tissue | Histology | Sex | Age | Stage | Therapy Types | Drugs | Outcome |
| PABPN1 | SNV | Missense_Mutation | c.424G>A | p.Glu142Lys | p.E142K | Q86U42 | protein_coding | tolerated(0.18) | benign(0.125) | TCGA-BH-A18P-01 | Breast | breast invasive carcinoma | Female | <65 | I/II | Unknown | Unknown | PD | |
| PABPN1 | SNV | Missense_Mutation | rs201713476 | c.533N>G | p.Asn178Ser | p.N178S | Q86U42 | protein_coding | deleterious(0.01) | probably_damaging(0.966) | TCGA-D8-A27K-01 | Breast | breast invasive carcinoma | Female | <65 | I/II | Chemotherapy | adriamycin+cyclophosphamid | SD |
| PABPN1 | SNV | Missense_Mutation | novel | c.729N>T | p.Lys243Asn | p.K243N | Q86U42 | protein_coding | deleterious(0) | possibly_damaging(0.823) | TCGA-C5-A7CJ-01 | Cervix | cervical & endocervical cancer | Female | <65 | I/II | Chemotherapy | cisplatin | SD |
| PABPN1 | SNV | Missense_Mutation | c.833C>G | p.Ser278Cys | p.S278C | Q86U42 | protein_coding | tolerated(0.05) | benign(0.017) | TCGA-IR-A3LK-01 | Cervix | cervical & endocervical cancer | Female | >=65 | I/II | Chemotherapy | cisplatin | PD | |
| PABPN1 | SNV | Missense_Mutation | c.802N>T | p.Ala268Ser | p.A268S | Q86U42 | protein_coding | tolerated(0.12) | benign(0.031) | TCGA-DY-A1DG-01 | Colorectum | rectum adenocarcinoma | Male | >=65 | I/II | Unknown | Unknown | PD | |
| PABPN1 | deletion | Frame_Shift_Del | c.862delN | p.Arg289GlyfsTer24 | p.R289Gfs*24 | Q86U42 | protein_coding | TCGA-AA-3966-01 | Colorectum | colon adenocarcinoma | Female | >=65 | I/II | Unknown | Unknown | SD | |||
| PABPN1 | SNV | Missense_Mutation | rs758290474 | c.805N>T | p.Arg269Trp | p.R269W | Q86U42 | protein_coding | deleterious(0.01) | probably_damaging(0.988) | TCGA-AJ-A3OK-01 | Endometrium | uterine corpus endometrioid carcinoma | Female | >=65 | I/II | Chemotherapy | carboplatin | CR |
| PABPN1 | SNV | Missense_Mutation | c.411N>T | p.Lys137Asn | p.K137N | Q86U42 | protein_coding | deleterious(0.02) | possibly_damaging(0.885) | TCGA-D1-A103-01 | Endometrium | uterine corpus endometrioid carcinoma | Female | >=65 | I/II | Unknown | Unknown | SD | |
| PABPN1 | SNV | Missense_Mutation | c.872N>A | p.Arg291His | p.R291H | Q86U42 | protein_coding | tolerated(0.08) | probably_damaging(0.987) | TCGA-D1-A103-01 | Endometrium | uterine corpus endometrioid carcinoma | Female | >=65 | I/II | Unknown | Unknown | SD | |
| PABPN1 | SNV | Missense_Mutation | novel | c.559N>A | p.Glu187Lys | p.E187K | Q86U42 | protein_coding | deleterious(0) | probably_damaging(0.954) | TCGA-DF-A2KU-01 | Endometrium | uterine corpus endometrioid carcinoma | Female | Unknown | I/II | Unknown | Unknown | SD |
| Page: 1 2 |
Top |
Related drugs of malignant transformation related genes |
| Identification of chemicals and drugs interact with genes involved in malignant transfromation |
| (DGIdb 4.0) |
| Entrez ID | Symbol | Category | Interaction Types | Drug Claim Name | Drug Name | PMIDs |
| Page: 1 |

Copyright 2023-Present -The University of Texas Health Science Center at Houston |