
|
|||||
|
 | |
| |
| |
| |
| |
| |
|
Gene: P4HTM |
Gene summary for P4HTM |
| Gene information | Species | Human | Gene symbol | P4HTM | Gene ID | 54681 |
| Gene name | prolyl 4-hydroxylase, transmembrane | |
| Gene Alias | EGLN4 | |
| Cytomap | 3p21.31 | |
| Gene Type | protein-coding | GO ID | GO:0002262 | UniProtAcc | Q9NXG6 |
Top |
Malignant transformation analysis |
| Identification of the aberrant gene expression in precancerous and cancerous lesions by comparing the gene expression of stem-like cells in diseased tissues with normal stem cells |
| Entrez ID | Symbol | Replicates | Species | Organ | Tissue | Adj P-value | Log2FC | Malignancy |
| 54681 | P4HTM | LZE20T | Human | Esophagus | ESCC | 1.46e-02 | 1.79e-01 | 0.0662 |
| 54681 | P4HTM | LZE22T | Human | Esophagus | ESCC | 1.24e-03 | 3.06e-01 | 0.068 |
| 54681 | P4HTM | LZE24T | Human | Esophagus | ESCC | 4.64e-15 | 4.55e-01 | 0.0596 |
| 54681 | P4HTM | P1T-E | Human | Esophagus | ESCC | 9.04e-07 | 3.36e-01 | 0.0875 |
| 54681 | P4HTM | P2T-E | Human | Esophagus | ESCC | 3.97e-06 | 9.48e-02 | 0.1177 |
| 54681 | P4HTM | P4T-E | Human | Esophagus | ESCC | 5.59e-26 | 4.08e-01 | 0.1323 |
| 54681 | P4HTM | P5T-E | Human | Esophagus | ESCC | 2.27e-08 | 7.42e-02 | 0.1327 |
| 54681 | P4HTM | P8T-E | Human | Esophagus | ESCC | 4.69e-34 | 5.70e-01 | 0.0889 |
| 54681 | P4HTM | P9T-E | Human | Esophagus | ESCC | 2.90e-08 | 2.24e-01 | 0.1131 |
| 54681 | P4HTM | P10T-E | Human | Esophagus | ESCC | 6.69e-14 | 1.05e-01 | 0.116 |
| 54681 | P4HTM | P11T-E | Human | Esophagus | ESCC | 5.94e-09 | 3.60e-01 | 0.1426 |
| 54681 | P4HTM | P12T-E | Human | Esophagus | ESCC | 1.76e-18 | 3.30e-01 | 0.1122 |
| 54681 | P4HTM | P15T-E | Human | Esophagus | ESCC | 2.36e-16 | 3.22e-01 | 0.1149 |
| 54681 | P4HTM | P17T-E | Human | Esophagus | ESCC | 8.12e-07 | 2.85e-01 | 0.1278 |
| 54681 | P4HTM | P20T-E | Human | Esophagus | ESCC | 1.81e-08 | 1.79e-01 | 0.1124 |
| 54681 | P4HTM | P21T-E | Human | Esophagus | ESCC | 6.54e-08 | 1.75e-01 | 0.1617 |
| 54681 | P4HTM | P23T-E | Human | Esophagus | ESCC | 4.89e-09 | 1.70e-01 | 0.108 |
| 54681 | P4HTM | P24T-E | Human | Esophagus | ESCC | 2.93e-19 | 2.70e-01 | 0.1287 |
| 54681 | P4HTM | P26T-E | Human | Esophagus | ESCC | 1.38e-20 | 3.99e-01 | 0.1276 |
| 54681 | P4HTM | P27T-E | Human | Esophagus | ESCC | 4.60e-19 | 3.33e-01 | 0.1055 |
| Page: 1 2 3 4 5 |
| Tissue | Expression Dynamics | Abbreviation |
| Esophagus | 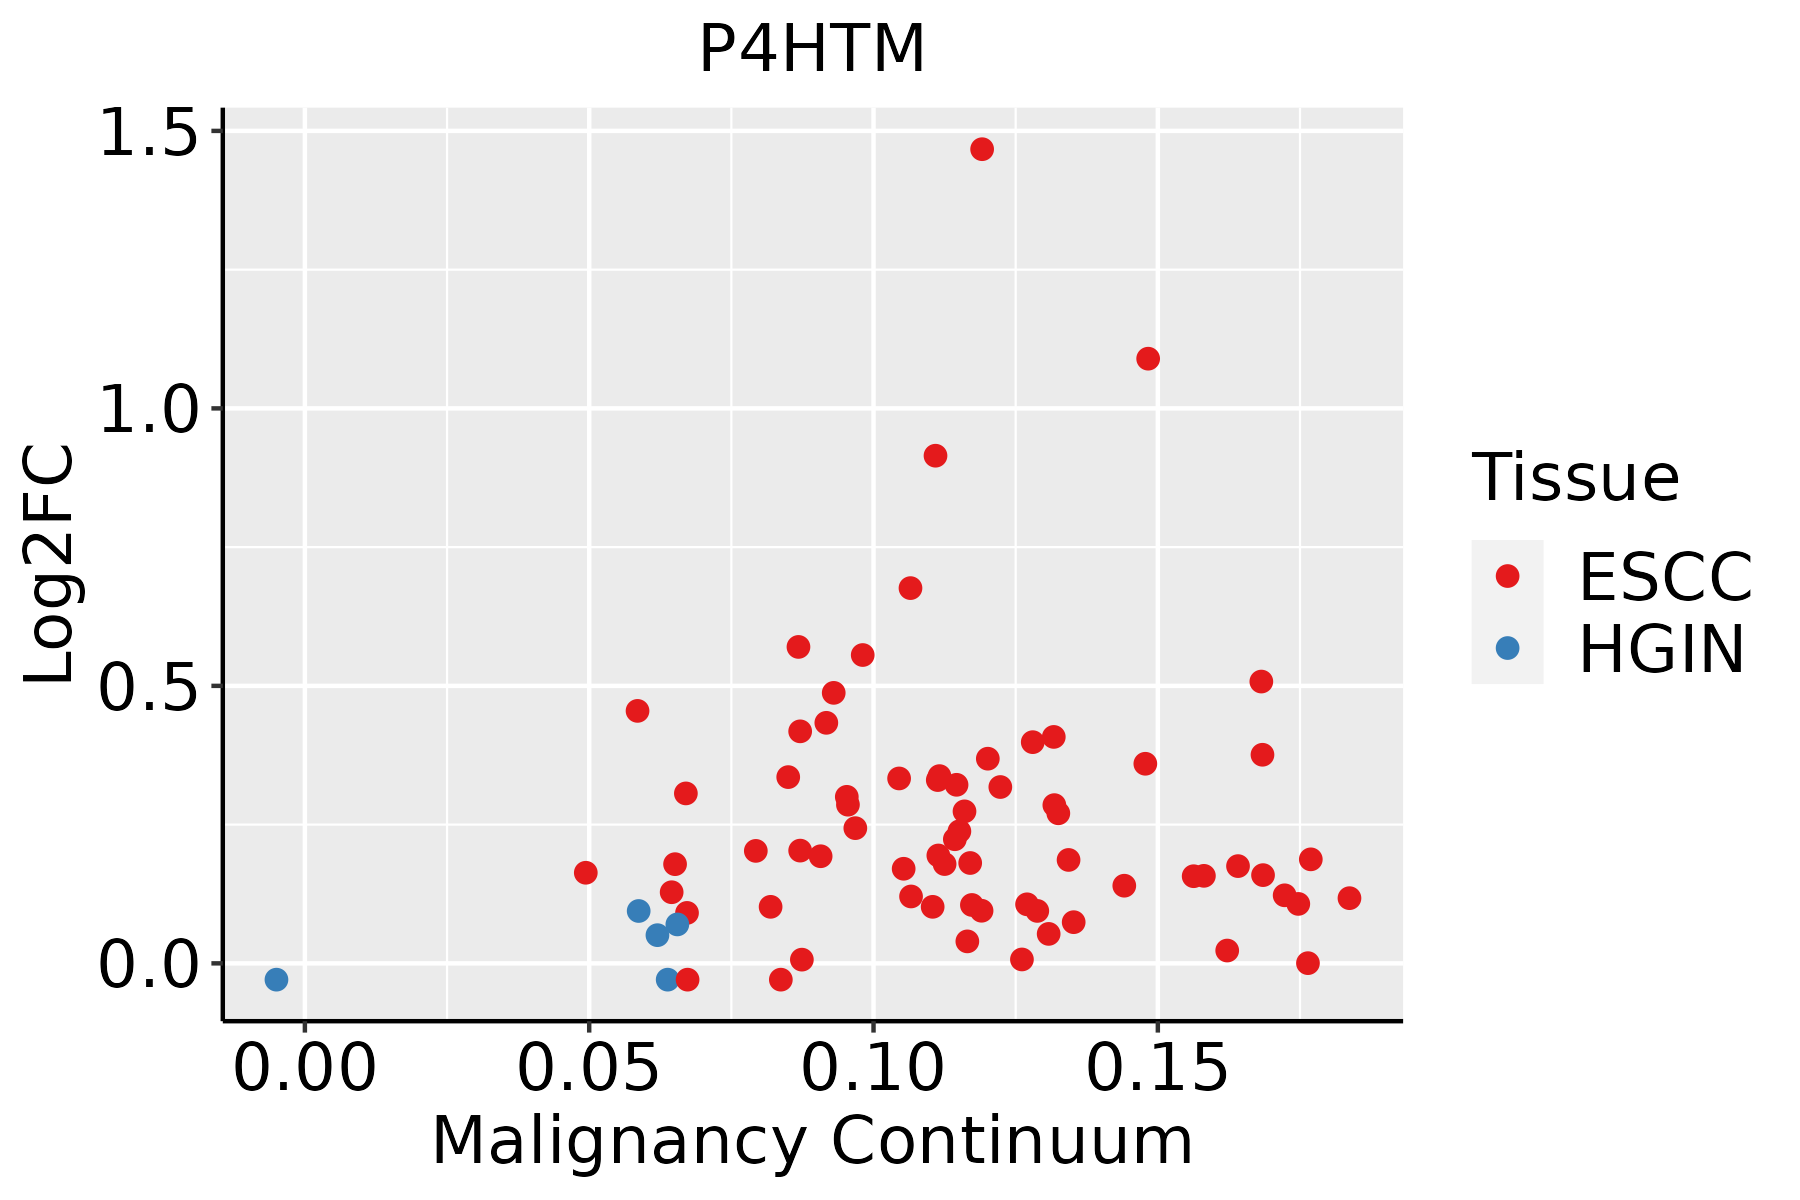 | ESCC: Esophageal squamous cell carcinoma |
| HGIN: High-grade intraepithelial neoplasias | ||
| LGIN: Low-grade intraepithelial neoplasias | ||
| Liver | 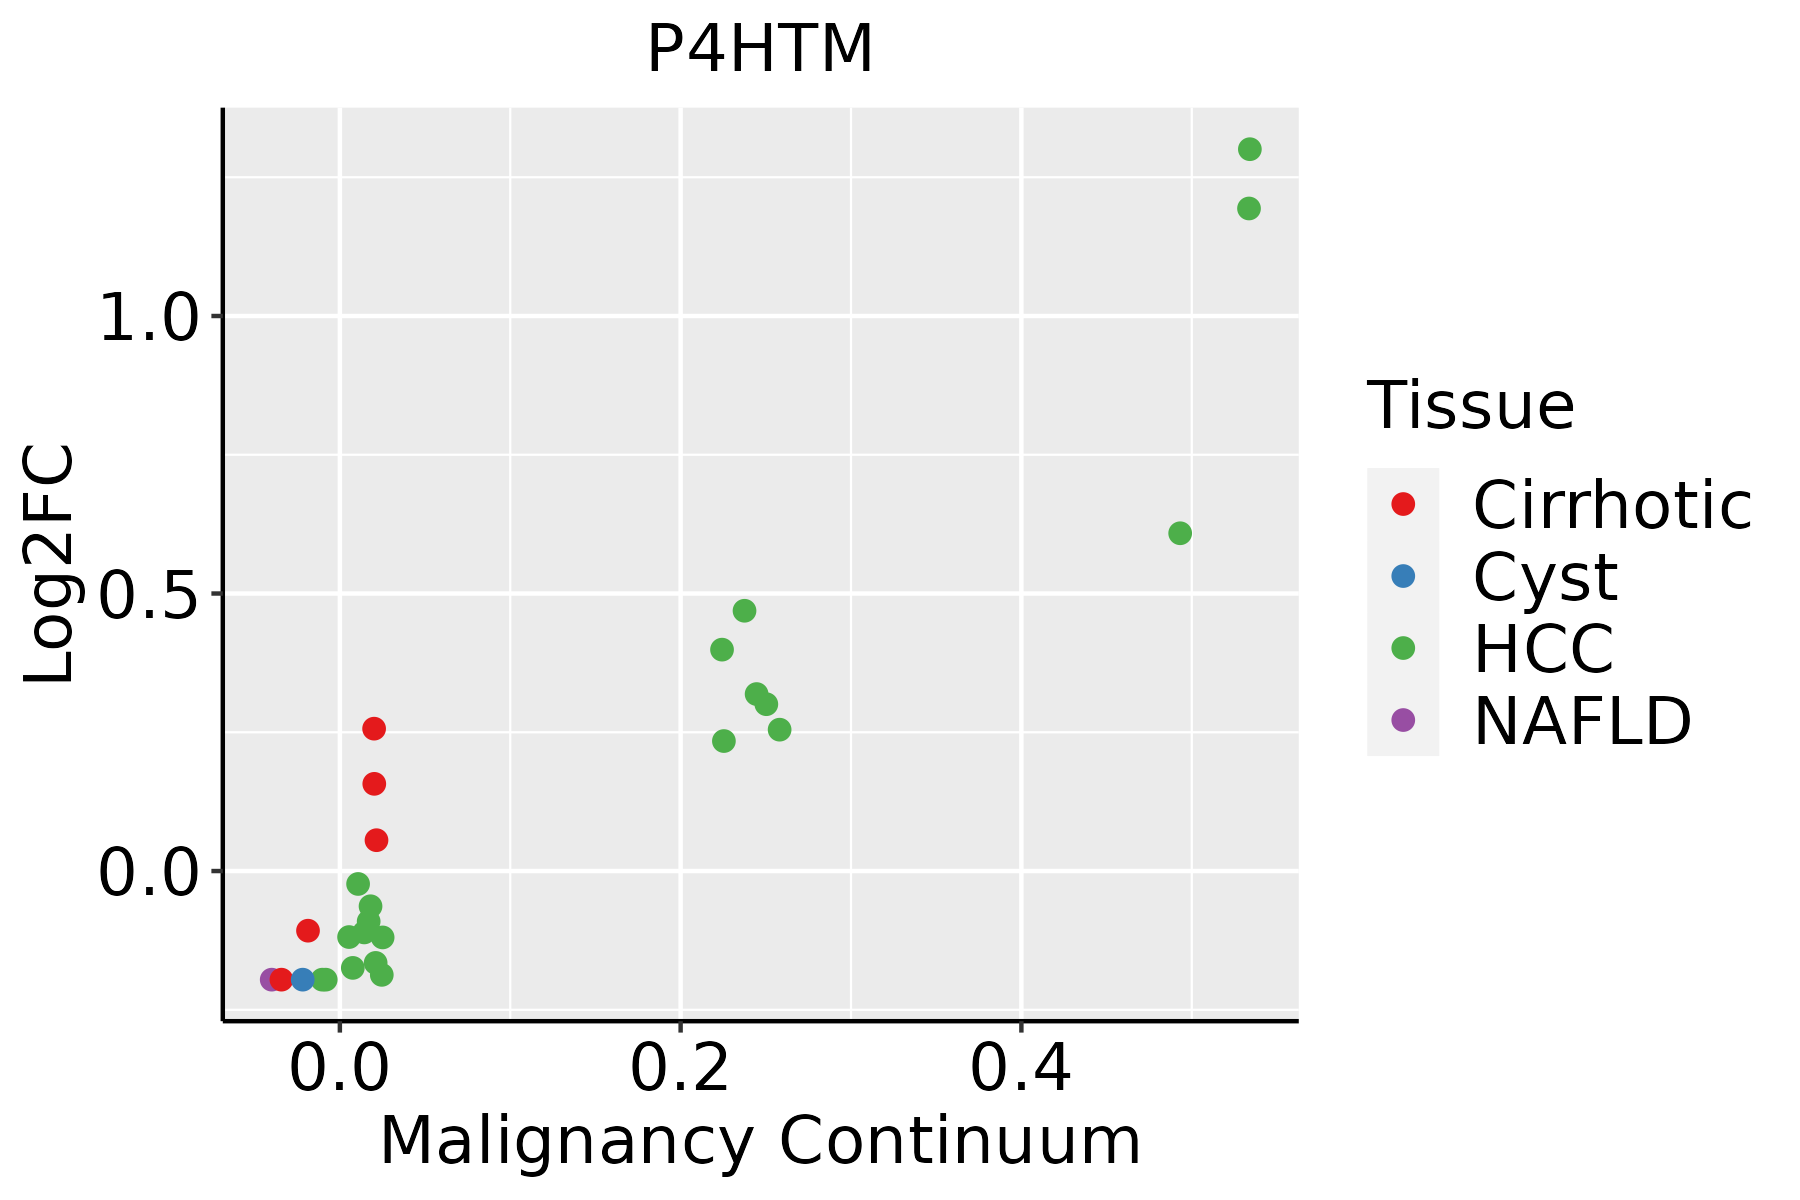 | HCC: Hepatocellular carcinoma |
| NAFLD: Non-alcoholic fatty liver disease | ||
| Oral Cavity | 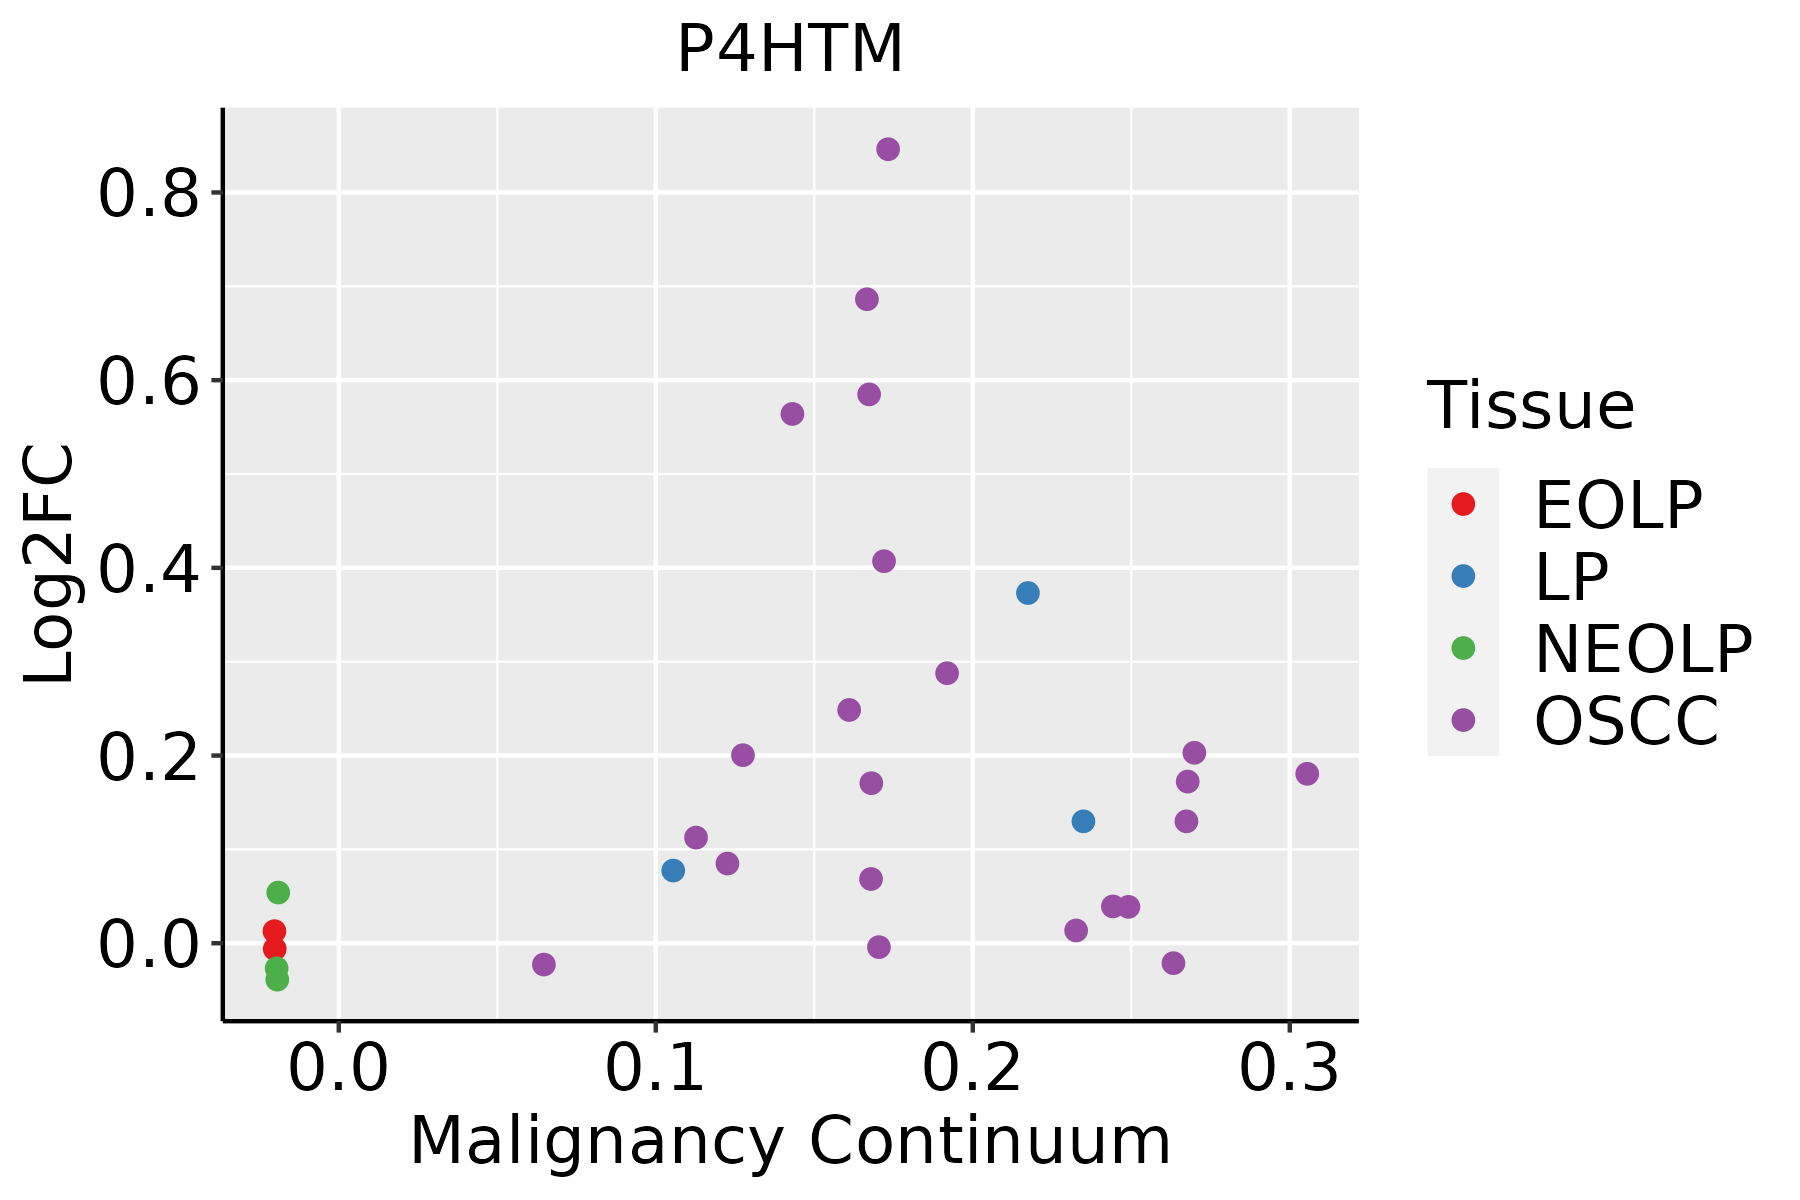 | EOLP: Erosive Oral lichen planus |
| LP: leukoplakia | ||
| NEOLP: Non-erosive oral lichen planus | ||
| OSCC: Oral squamous cell carcinoma | ||
| Prostate | 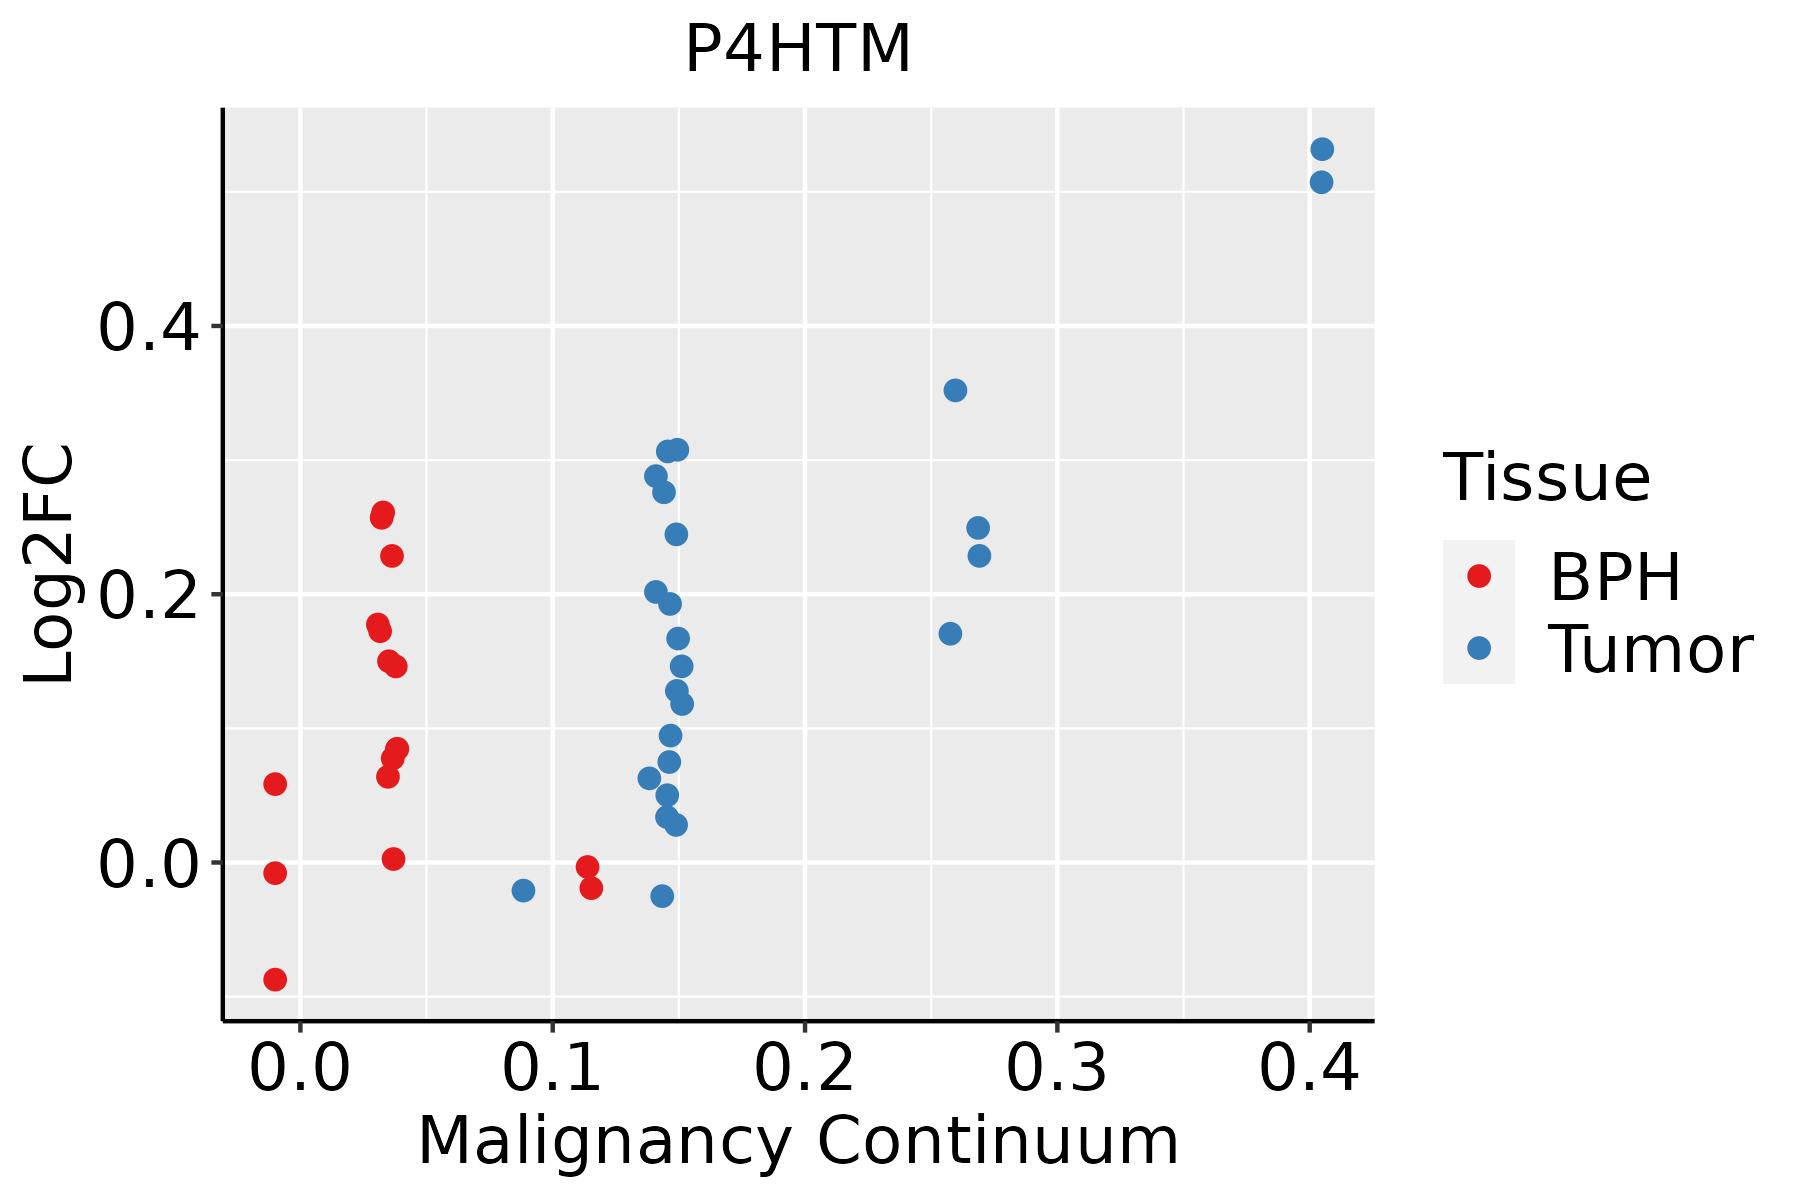 | BPH: Benign Prostatic Hyperplasia |
| Thyroid | 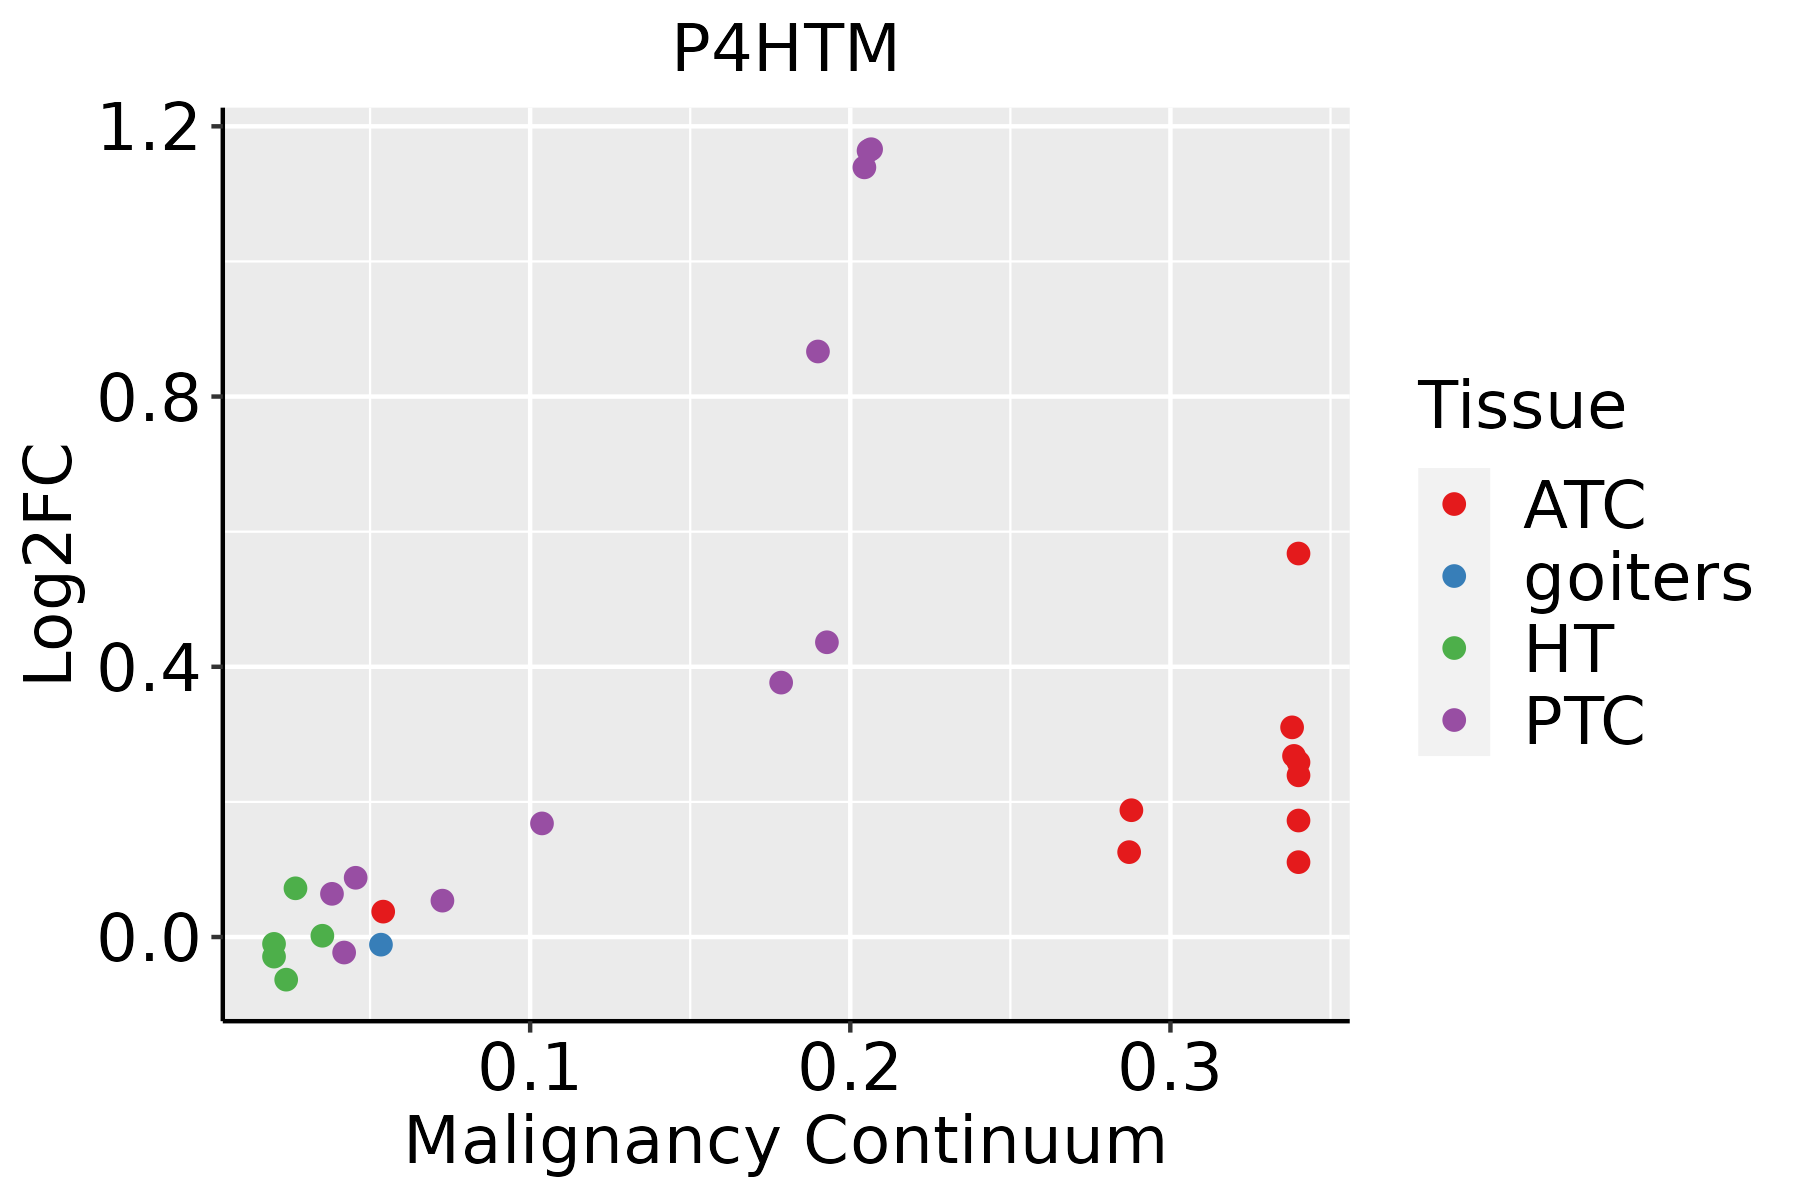 | ATC: Anaplastic thyroid cancer |
| HT: Hashimoto's thyroiditis | ||
| PTC: Papillary thyroid cancer |
| ∗log2FC in expression of this searched gene in stem-like cells from each diseased tissue sample relative to stem-like cells in normal samples in each tissue plotted against the malignancy continuum. Samples are colored based on if they are from different disease stage. |
Top |
Malignant transformation related pathway analysis |
| Find out the enriched GO biological processes and KEGG pathways involved in transition from healthy to precancer to cancer |
| Tissue | Disease Stage | Enriched GO biological Processes |
| Colorectum | AD |  |
| Colorectum | SER |  |
| Colorectum | MSS |  |
| Colorectum | MSI-H |  |
| Colorectum | FAP |  |
| ∗Top 15 enriched GO BP terms are showed in the bar plot of each disease state in each tissue. Each row represents a significant GO biological process which is colored according to the -log10(p.adjust). |
| Page: 1 2 3 4 5 6 7 8 9 |
| GO ID | Tissue | Disease Stage | Description | Gene Ratio | Bg Ratio | pvalue | p.adjust | Count |
| GO:0030099111 | Esophagus | ESCC | myeloid cell differentiation | 232/8552 | 381/18723 | 1.22e-09 | 2.90e-08 | 232 |
| GO:0002262111 | Esophagus | ESCC | myeloid cell homeostasis | 104/8552 | 157/18723 | 1.49e-07 | 2.36e-06 | 104 |
| GO:001820816 | Esophagus | ESCC | peptidyl-proline modification | 46/8552 | 58/18723 | 1.59e-07 | 2.51e-06 | 46 |
| GO:0034101111 | Esophagus | ESCC | erythrocyte homeostasis | 88/8552 | 129/18723 | 1.81e-07 | 2.84e-06 | 88 |
| GO:0048872111 | Esophagus | ESCC | homeostasis of number of cells | 163/8552 | 272/18723 | 1.40e-06 | 1.69e-05 | 163 |
| GO:0030218111 | Esophagus | ESCC | erythrocyte differentiation | 80/8552 | 120/18723 | 2.69e-06 | 3.08e-05 | 80 |
| GO:00181263 | Esophagus | ESCC | protein hydroxylation | 23/8552 | 27/18723 | 2.60e-05 | 2.19e-04 | 23 |
| GO:1903706110 | Esophagus | ESCC | regulation of hemopoiesis | 201/8552 | 367/18723 | 2.60e-04 | 1.58e-03 | 201 |
| GO:00195114 | Esophagus | ESCC | peptidyl-proline hydroxylation | 13/8552 | 15/18723 | 1.31e-03 | 6.26e-03 | 13 |
| GO:0045637111 | Esophagus | ESCC | regulation of myeloid cell differentiation | 118/8552 | 210/18723 | 1.35e-03 | 6.43e-03 | 118 |
| GO:004564619 | Esophagus | ESCC | regulation of erythrocyte differentiation | 32/8552 | 47/18723 | 1.59e-03 | 7.43e-03 | 32 |
| GO:00184014 | Esophagus | ESCC | peptidyl-proline hydroxylation to 4-hydroxy-L-proline | 9/8552 | 10/18723 | 5.09e-03 | 1.92e-02 | 9 |
| GO:003009912 | Liver | Cirrhotic | myeloid cell differentiation | 135/4634 | 381/18723 | 1.69e-06 | 3.22e-05 | 135 |
| GO:003410112 | Liver | Cirrhotic | erythrocyte homeostasis | 54/4634 | 129/18723 | 1.41e-05 | 1.97e-04 | 54 |
| GO:00302187 | Liver | Cirrhotic | erythrocyte differentiation | 50/4634 | 120/18723 | 3.35e-05 | 4.13e-04 | 50 |
| GO:000226212 | Liver | Cirrhotic | myeloid cell homeostasis | 59/4634 | 157/18723 | 2.33e-04 | 2.11e-03 | 59 |
| GO:00182084 | Liver | Cirrhotic | peptidyl-proline modification | 26/4634 | 58/18723 | 6.65e-04 | 5.04e-03 | 26 |
| GO:004887212 | Liver | Cirrhotic | homeostasis of number of cells | 89/4634 | 272/18723 | 1.76e-03 | 1.12e-02 | 89 |
| GO:00456377 | Liver | Cirrhotic | regulation of myeloid cell differentiation | 68/4634 | 210/18723 | 7.40e-03 | 3.53e-02 | 68 |
| GO:001820811 | Liver | HCC | peptidyl-proline modification | 42/7958 | 58/18723 | 3.73e-06 | 4.85e-05 | 42 |
| Page: 1 2 3 4 |
| Pathway ID | Tissue | Disease Stage | Description | Gene Ratio | Bg Ratio | pvalue | p.adjust | qvalue | Count |
| Page: 1 |
Top |
Cell-cell communication analysis |
| Identification of potential cell-cell interactions between two cell types and their ligand-receptor pairs for different disease states |
| Ligand | Receptor | LRpair | Pathway | Tissue | Disease Stage |
| Page: 1 |
Top |
Single-cell gene regulatory network inference analysis |
| Find out the significant the regulons (TFs) and the target genes of each regulon across cell types for different disease states |
| TF | Cell Type | Tissue | Disease Stage | Target Gene | RSS | Regulon Activity |
| ∗The dot plots of a searched regulon are shown for all cell subpopulations in each disease state of each tissue based on the regulon specific score inferred using pySCENIC and by calculating the average expression. |
| Page: 1 |
Top |
Somatic mutation of malignant transformation related genes |
| Annotation of somatic variants for genes involved in malignant transformation |
| Hugo Symbol | Variant Class | Variant Classification | dbSNP RS | HGVSc | HGVSp | HGVSp Short | SWISSPROT | BIOTYPE | SIFT | PolyPhen | Tumor Sample Barcode | Tissue | Histology | Sex | Age | Stage | Therapy Types | Drugs | Outcome |
| P4HTM | SNV | Missense_Mutation | c.533A>C | p.Glu178Ala | p.E178A | Q9NXG6 | protein_coding | tolerated(0.49) | benign(0.269) | TCGA-AR-A1AJ-01 | Breast | breast invasive carcinoma | Female | >=65 | I/II | Unknown | Unknown | SD | |
| P4HTM | SNV | Missense_Mutation | novel | c.1592N>C | p.Phe531Ser | p.F531S | Q9NXG6 | protein_coding | deleterious(0) | possibly_damaging(0.739) | TCGA-D8-A1X6-01 | Breast | breast invasive carcinoma | Female | >=65 | III/IV | Hormone Therapy | tamoxiphen | SD |
| P4HTM | SNV | Missense_Mutation | c.529G>A | p.Glu177Lys | p.E177K | Q9NXG6 | protein_coding | tolerated(0.08) | possibly_damaging(0.737) | TCGA-A6-A56B-01 | Colorectum | colon adenocarcinoma | Male | <65 | III/IV | Chemotherapy | fluorouracil | PD | |
| P4HTM | SNV | Missense_Mutation | novel | c.698C>T | p.Ala233Val | p.A233V | Q9NXG6 | protein_coding | deleterious(0.04) | probably_damaging(0.994) | TCGA-AZ-4313-01 | Colorectum | colon adenocarcinoma | Female | <65 | I/II | Unknown | Unknown | SD |
| P4HTM | SNV | Missense_Mutation | c.455C>G | p.Thr152Ser | p.T152S | Q9NXG6 | protein_coding | tolerated(1) | benign(0) | TCGA-CK-4951-01 | Colorectum | colon adenocarcinoma | Female | >=65 | I/II | Unknown | Unknown | PD | |
| P4HTM | SNV | Missense_Mutation | c.1526N>A | p.Arg509His | p.R509H | Q9NXG6 | protein_coding | deleterious(0.05) | benign(0.379) | TCGA-G4-6628-01 | Colorectum | colon adenocarcinoma | Male | >=65 | I/II | Unknown | Unknown | SD | |
| P4HTM | SNV | Missense_Mutation | c.1385N>A | p.Arg462Gln | p.R462Q | Q9NXG6 | protein_coding | tolerated(0.28) | benign(0.147) | TCGA-EI-6882-01 | Colorectum | rectum adenocarcinoma | Male | <65 | I/II | Unknown | Unknown | SD | |
| P4HTM | SNV | Missense_Mutation | rs568151159 | c.911C>T | p.Ser304Leu | p.S304L | Q9NXG6 | protein_coding | deleterious(0) | benign(0.09) | TCGA-AJ-A3OK-01 | Endometrium | uterine corpus endometrioid carcinoma | Female | >=65 | I/II | Chemotherapy | carboplatin | CR |
| P4HTM | SNV | Missense_Mutation | c.1099N>T | p.Pro367Ser | p.P367S | Q9NXG6 | protein_coding | tolerated(0.27) | benign(0) | TCGA-AP-A059-01 | Endometrium | uterine corpus endometrioid carcinoma | Female | >=65 | I/II | Unknown | Unknown | SD | |
| P4HTM | SNV | Missense_Mutation | c.1658N>G | p.Asp553Gly | p.D553G | Q9NXG6 | protein_coding | deleterious_low_confidence(0.01) | probably_damaging(0.974) | TCGA-AP-A0LM-01 | Endometrium | uterine corpus endometrioid carcinoma | Female | <65 | III/IV | Chemotherapy | cisplatin | SD |
| Page: 1 2 3 4 5 |
Top |
Related drugs of malignant transformation related genes |
| Identification of chemicals and drugs interact with genes involved in malignant transfromation |
| (DGIdb 4.0) |
| Entrez ID | Symbol | Category | Interaction Types | Drug Claim Name | Drug Name | PMIDs |
| 54681 | P4HTM | TRANSCRIPTION FACTOR, DRUGGABLE GENOME | inhibitor | CHEMBL3544988 | DAPRODUSTAT | |
| 54681 | P4HTM | TRANSCRIPTION FACTOR, DRUGGABLE GENOME | inhibitor | CHEMBL2338329 | ROXADUSTAT |
| Page: 1 |

Copyright 2023-Present -The University of Texas Health Science Center at Houston |