
|
|||||
|
 | |
| |
| |
| |
| |
| |
|
Gene: P4HA1 |
Gene summary for P4HA1 |
| Gene information | Species | Human | Gene symbol | P4HA1 | Gene ID | 5033 |
| Gene name | prolyl 4-hydroxylase subunit alpha 1 | |
| Gene Alias | P4HA | |
| Cytomap | 10q22.1 | |
| Gene Type | protein-coding | GO ID | GO:0006464 | UniProtAcc | P13674 |
Top |
Malignant transformation analysis |
| Identification of the aberrant gene expression in precancerous and cancerous lesions by comparing the gene expression of stem-like cells in diseased tissues with normal stem cells |
| Entrez ID | Symbol | Replicates | Species | Organ | Tissue | Adj P-value | Log2FC | Malignancy |
| 5033 | P4HA1 | GSM4909285 | Human | Breast | IDC | 3.22e-09 | 4.43e-01 | 0.21 |
| 5033 | P4HA1 | GSM4909292 | Human | Breast | IDC | 2.28e-03 | 6.58e-01 | 0.1236 |
| 5033 | P4HA1 | GSM4909311 | Human | Breast | IDC | 1.26e-07 | -1.14e-01 | 0.1534 |
| 5033 | P4HA1 | GSM4909312 | Human | Breast | IDC | 4.53e-02 | -1.43e-02 | 0.1552 |
| 5033 | P4HA1 | GSM4909315 | Human | Breast | IDC | 9.05e-17 | 6.38e-01 | 0.21 |
| 5033 | P4HA1 | GSM4909319 | Human | Breast | IDC | 1.23e-08 | -1.13e-01 | 0.1563 |
| 5033 | P4HA1 | GSM4909321 | Human | Breast | IDC | 1.51e-02 | -1.51e-01 | 0.1559 |
| 5033 | P4HA1 | ctrl6 | Human | Breast | Precancer | 6.11e-13 | 6.58e-01 | -0.0061 |
| 5033 | P4HA1 | brca1 | Human | Breast | Precancer | 1.90e-02 | -1.62e-01 | -0.0338 |
| 5033 | P4HA1 | brca3 | Human | Breast | Precancer | 6.22e-05 | 2.99e-01 | -0.0263 |
| 5033 | P4HA1 | brca10 | Human | Breast | Precancer | 3.14e-14 | 5.23e-01 | -0.0029 |
| 5033 | P4HA1 | P1 | Human | Breast | IDC | 3.97e-02 | -1.21e-01 | 0.1527 |
| 5033 | P4HA1 | DCIS2 | Human | Breast | DCIS | 1.03e-19 | -3.37e-02 | 0.0085 |
| 5033 | P4HA1 | LZE4T | Human | Esophagus | ESCC | 7.18e-35 | 8.01e-01 | 0.0811 |
| 5033 | P4HA1 | LZE8T | Human | Esophagus | ESCC | 8.79e-14 | 5.04e-01 | 0.067 |
| 5033 | P4HA1 | LZE20T | Human | Esophagus | ESCC | 9.27e-10 | 5.13e-01 | 0.0662 |
| 5033 | P4HA1 | LZE22T | Human | Esophagus | ESCC | 8.06e-08 | 7.23e-01 | 0.068 |
| 5033 | P4HA1 | LZE24T | Human | Esophagus | ESCC | 3.81e-21 | 5.58e-01 | 0.0596 |
| 5033 | P4HA1 | LZE21T | Human | Esophagus | ESCC | 3.29e-02 | 2.22e-01 | 0.0655 |
| 5033 | P4HA1 | LZE6T | Human | Esophagus | ESCC | 4.25e-08 | 4.87e-01 | 0.0845 |
| Page: 1 2 3 4 5 6 7 |
| Tissue | Expression Dynamics | Abbreviation |
| Breast | 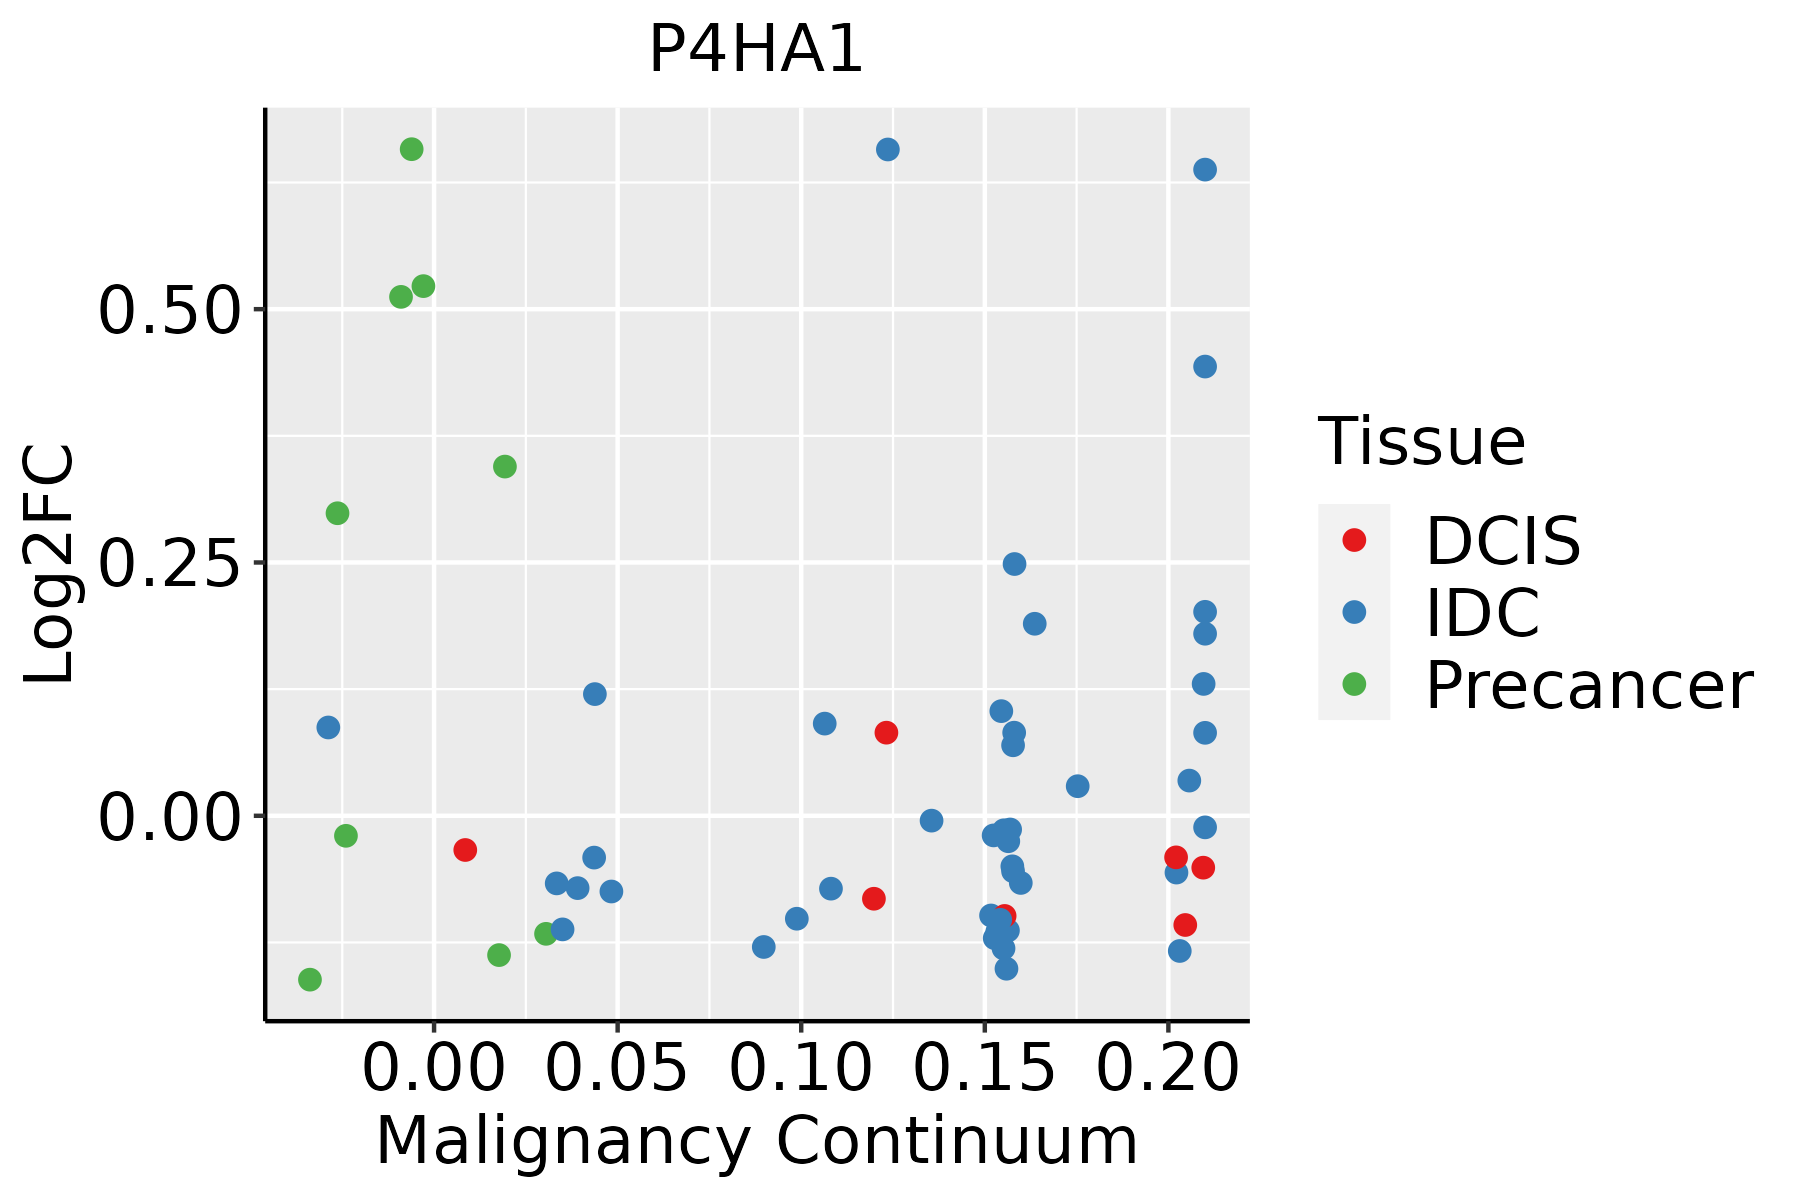 | IDC: Invasive ductal carcinoma |
| DCIS: Ductal carcinoma in situ | ||
| Precancer(BRCA1-mut): Precancerous lesion from BRCA1 mutation carriers | ||
| Esophagus | 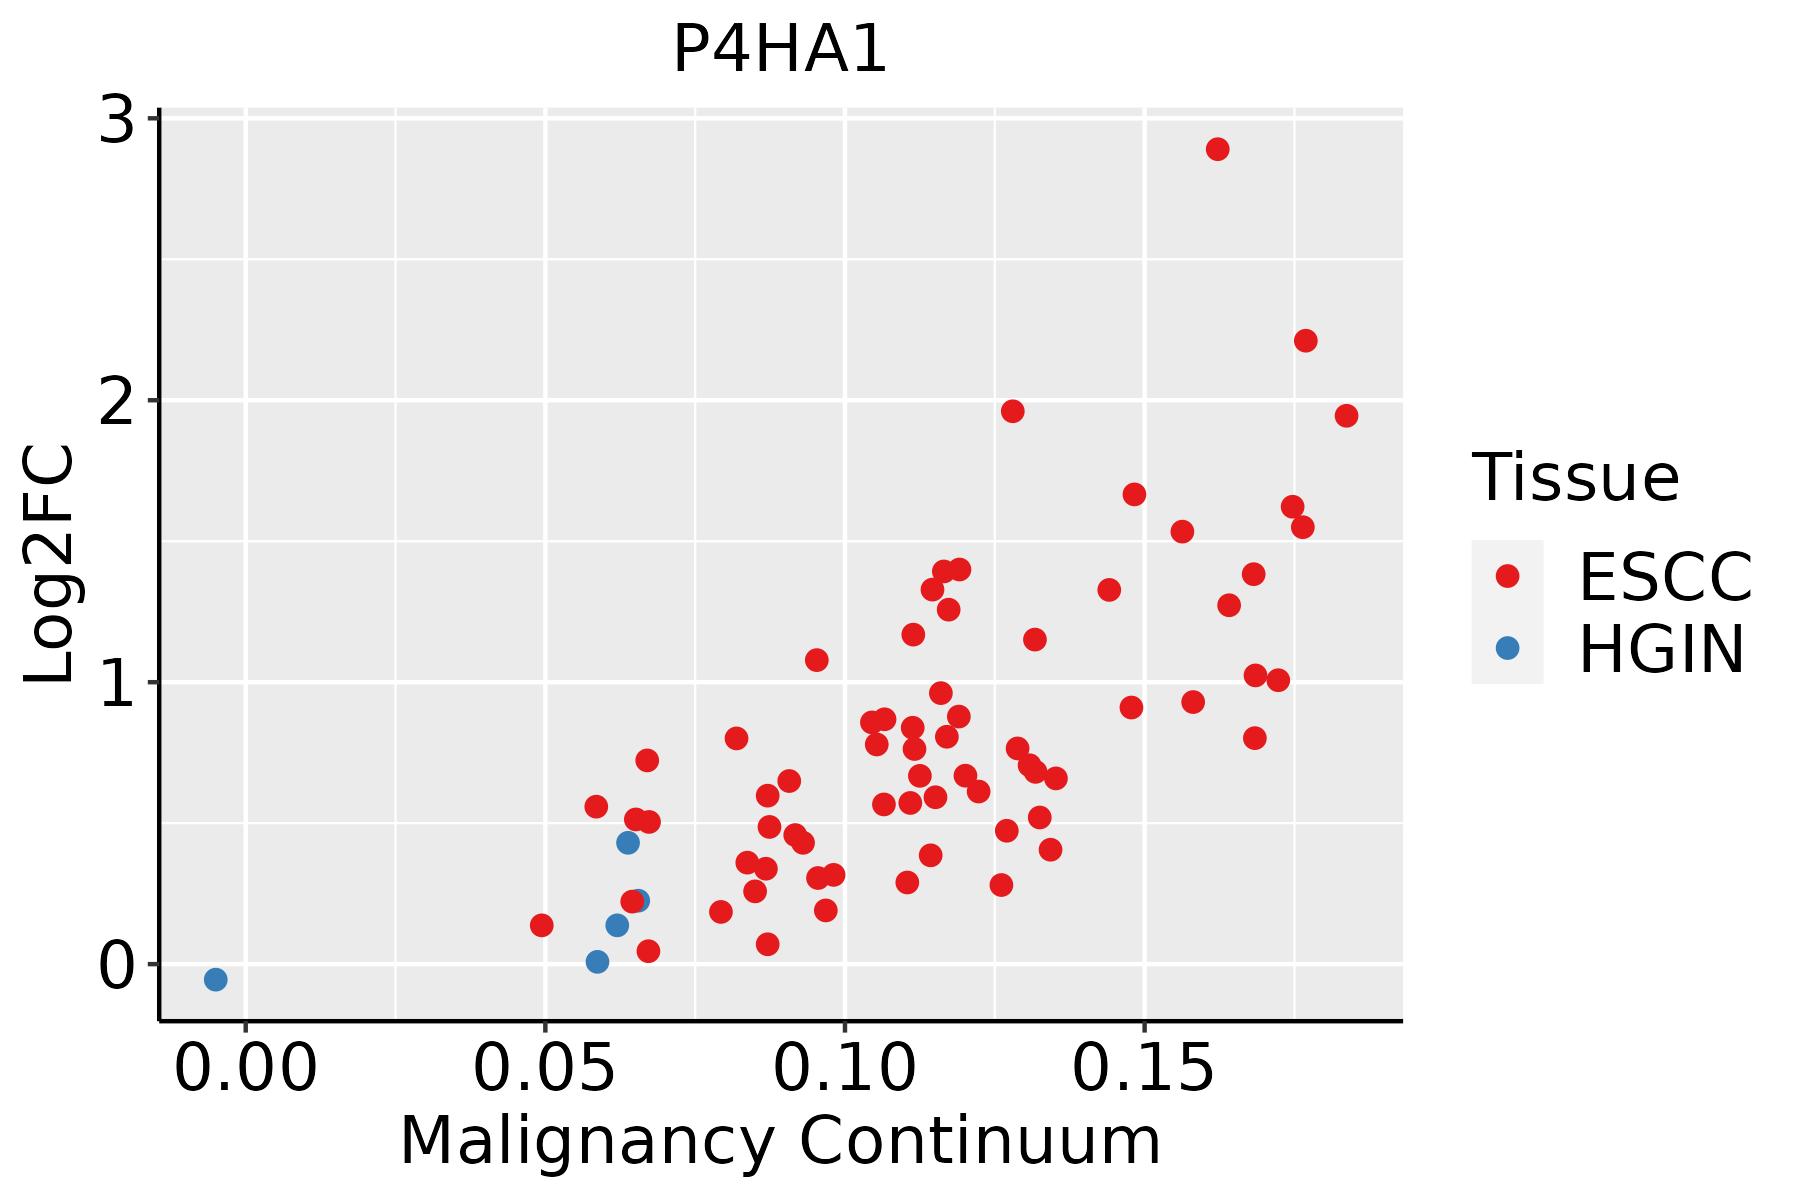 | ESCC: Esophageal squamous cell carcinoma |
| HGIN: High-grade intraepithelial neoplasias | ||
| LGIN: Low-grade intraepithelial neoplasias | ||
| Liver | 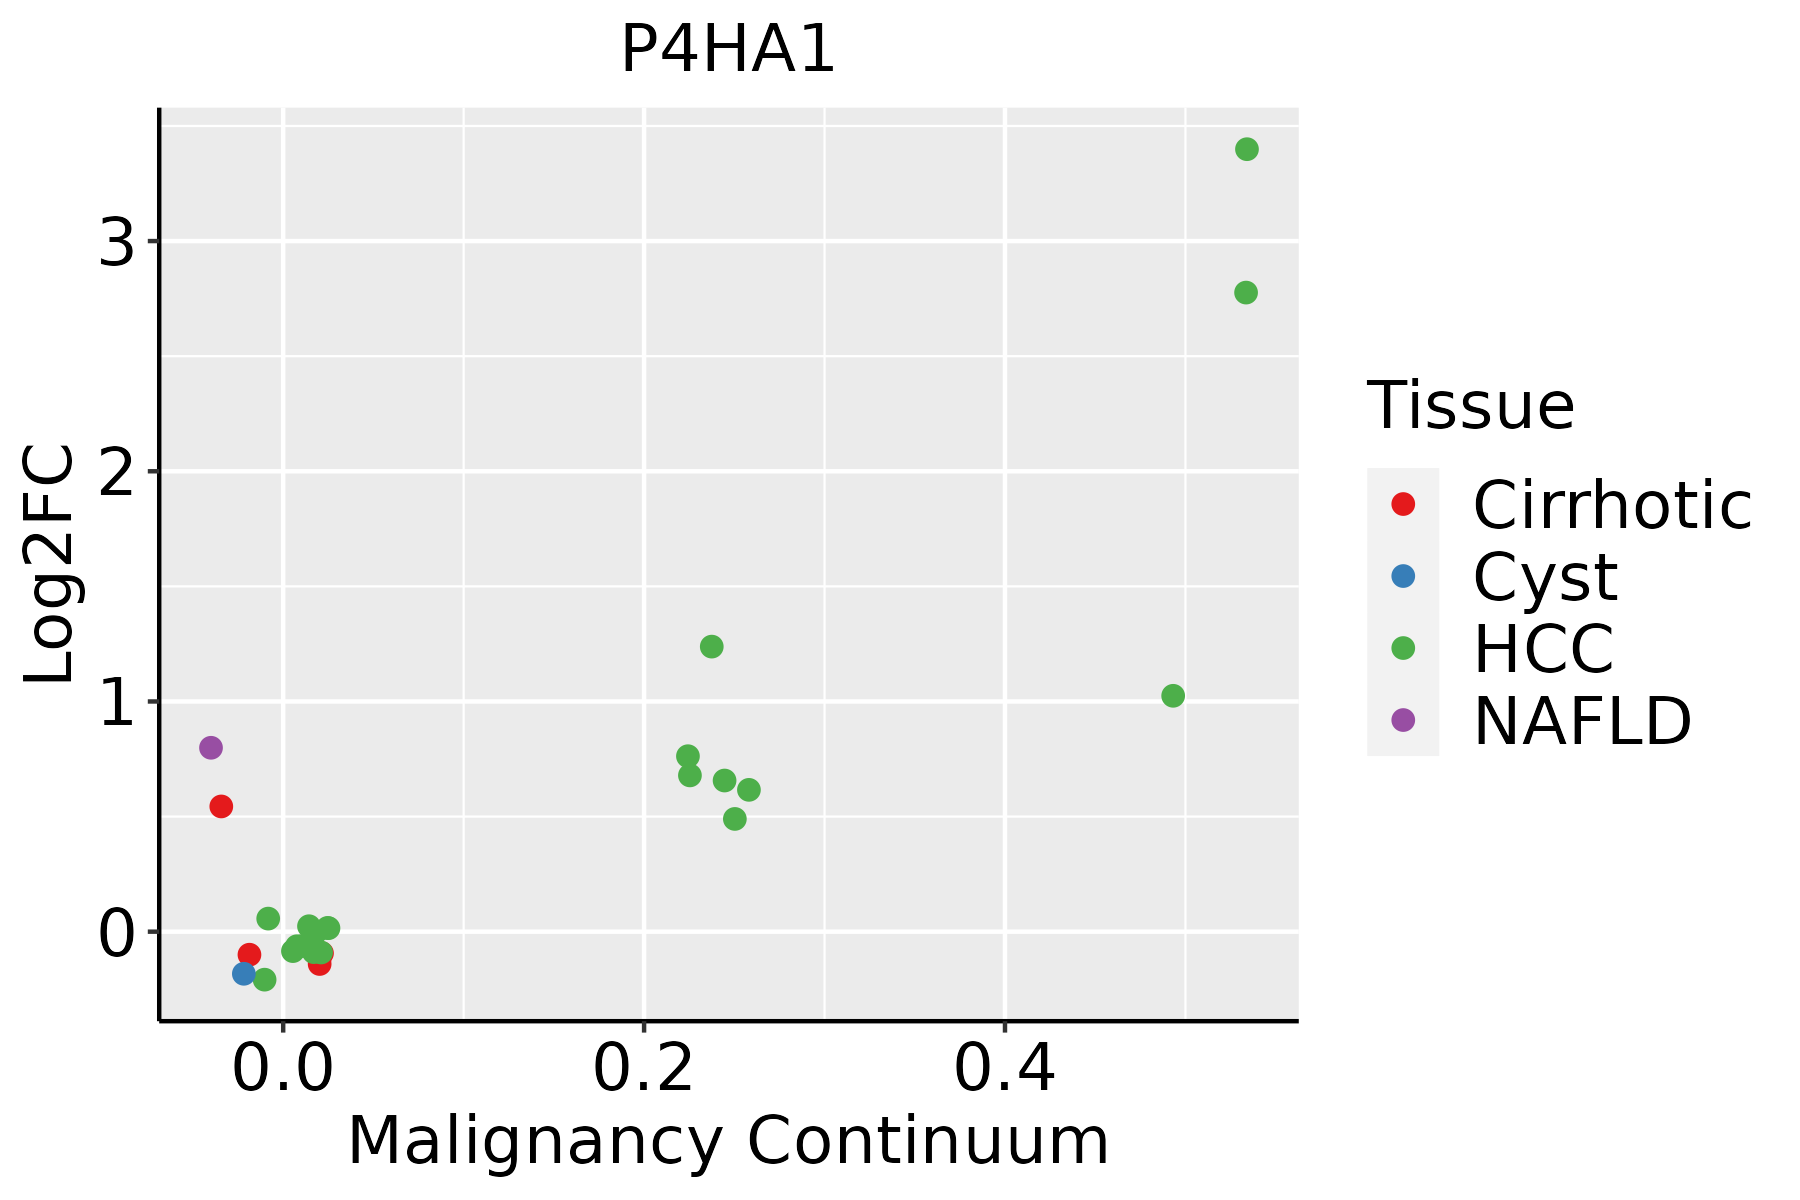 | HCC: Hepatocellular carcinoma |
| NAFLD: Non-alcoholic fatty liver disease | ||
| Lung | 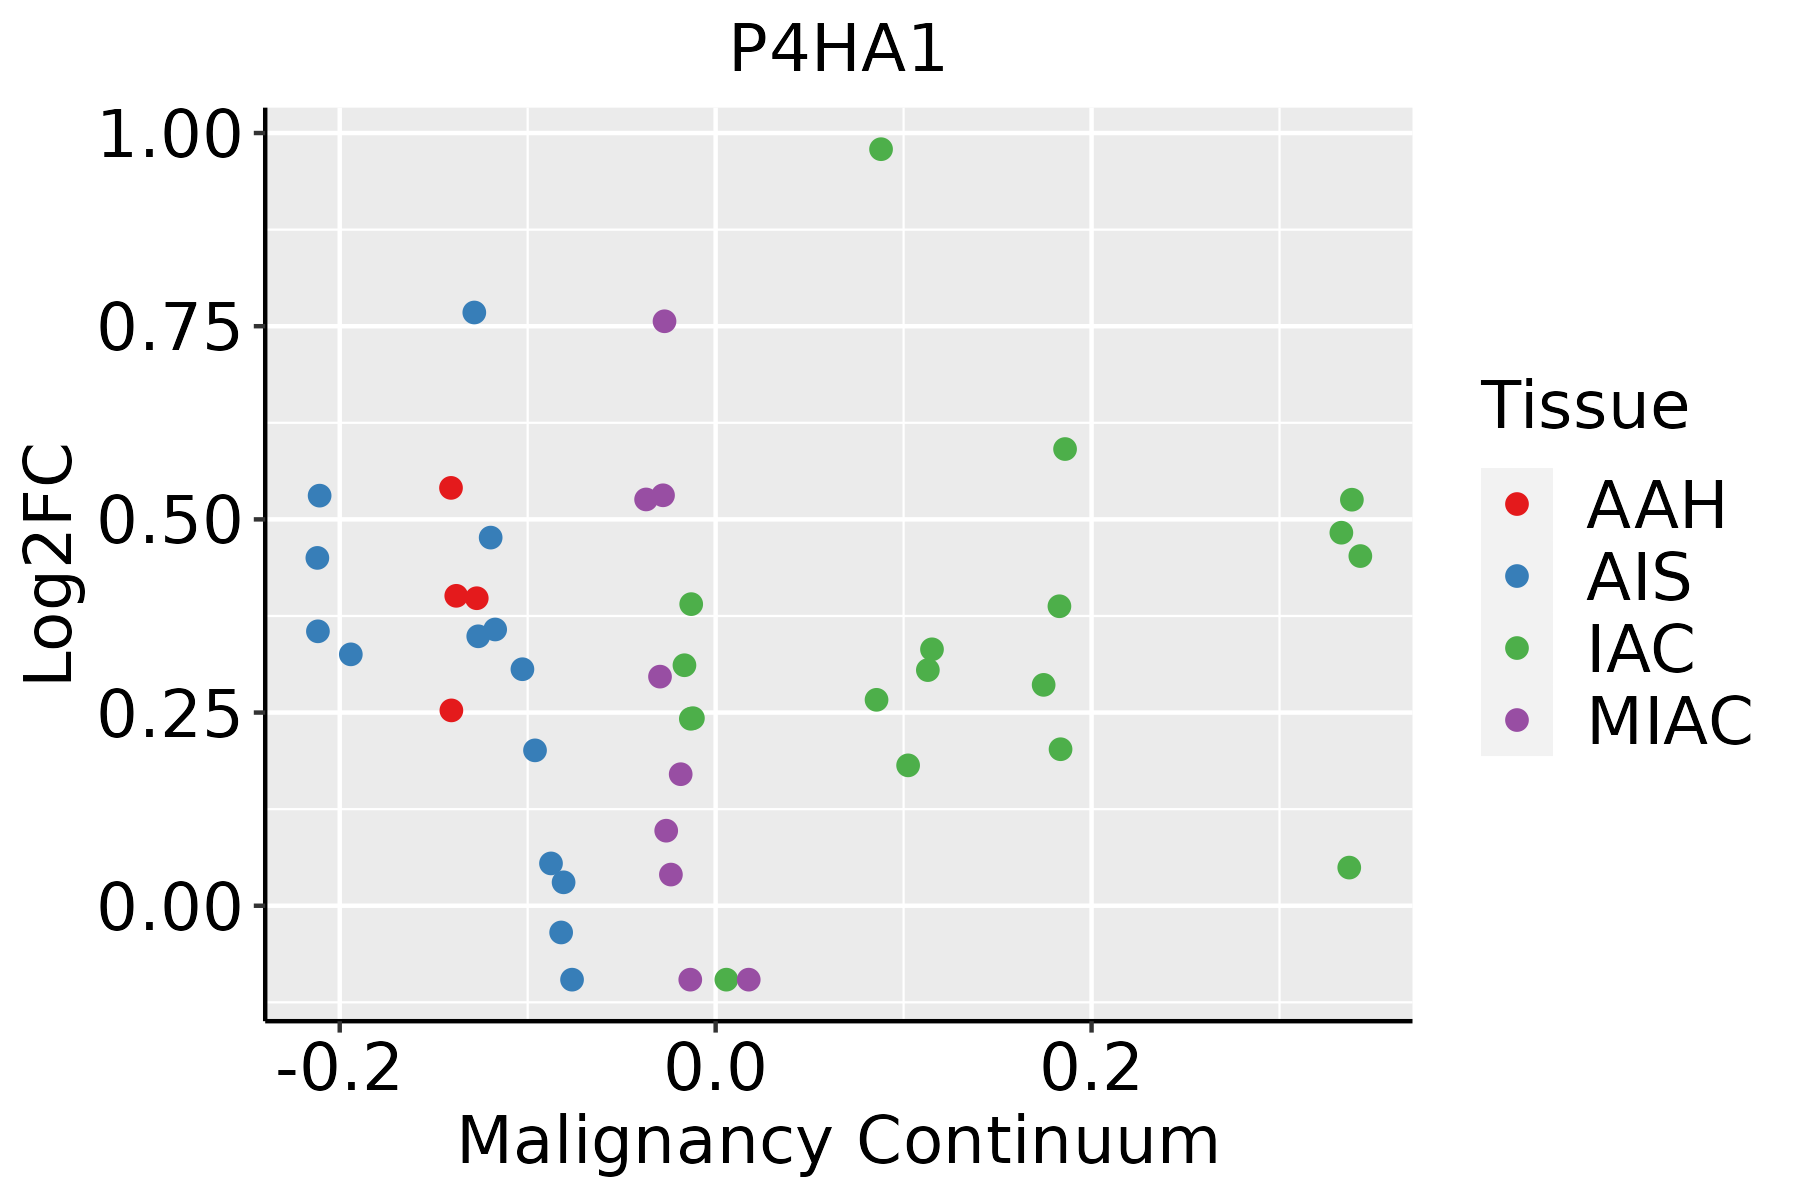 | AAH: Atypical adenomatous hyperplasia |
| AIS: Adenocarcinoma in situ | ||
| IAC: Invasive lung adenocarcinoma | ||
| MIA: Minimally invasive adenocarcinoma | ||
| Oral Cavity |  | EOLP: Erosive Oral lichen planus |
| LP: leukoplakia | ||
| NEOLP: Non-erosive oral lichen planus | ||
| OSCC: Oral squamous cell carcinoma | ||
| Prostate | 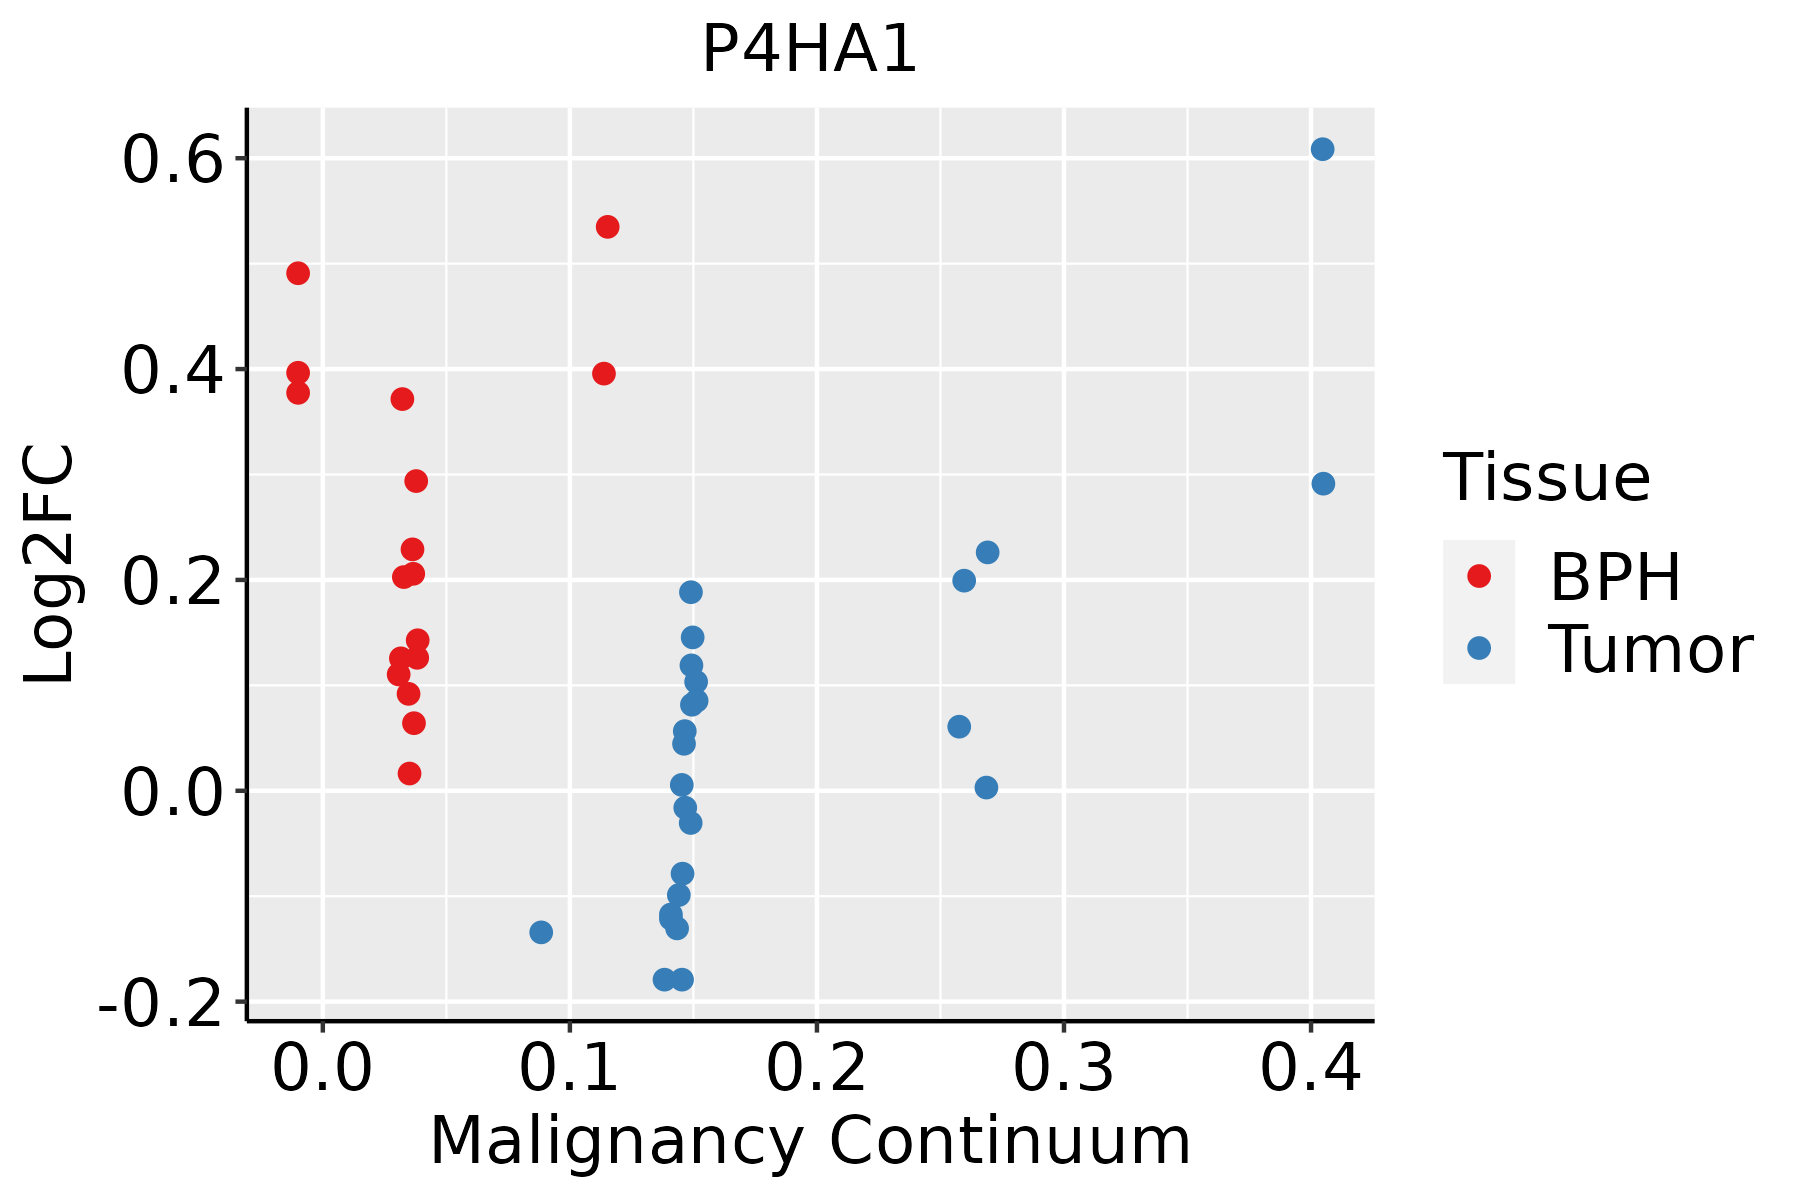 | BPH: Benign Prostatic Hyperplasia |
| Skin |  | AK: Actinic keratosis |
| cSCC: Cutaneous squamous cell carcinoma | ||
| SCCIS:squamous cell carcinoma in situ | ||
| Thyroid |  | ATC: Anaplastic thyroid cancer |
| HT: Hashimoto's thyroiditis | ||
| PTC: Papillary thyroid cancer |
| ∗log2FC in expression of this searched gene in stem-like cells from each diseased tissue sample relative to stem-like cells in normal samples in each tissue plotted against the malignancy continuum. Samples are colored based on if they are from different disease stage. |
Top |
Malignant transformation related pathway analysis |
| Find out the enriched GO biological processes and KEGG pathways involved in transition from healthy to precancer to cancer |
| Tissue | Disease Stage | Enriched GO biological Processes |
| Colorectum | AD |  |
| Colorectum | SER |  |
| Colorectum | MSS |  |
| Colorectum | MSI-H |  |
| Colorectum | FAP |  |
| ∗Top 15 enriched GO BP terms are showed in the bar plot of each disease state in each tissue. Each row represents a significant GO biological process which is colored according to the -log10(p.adjust). |
| Page: 1 2 3 4 5 6 7 8 9 |
| GO ID | Tissue | Disease Stage | Description | Gene Ratio | Bg Ratio | pvalue | p.adjust | Count |
| GO:0018401 | Breast | Precancer | peptidyl-proline hydroxylation to 4-hydroxy-L-proline | 5/1080 | 10/18723 | 1.25e-04 | 2.21e-03 | 5 |
| GO:0019511 | Breast | Precancer | peptidyl-proline hydroxylation | 5/1080 | 15/18723 | 1.17e-03 | 1.26e-02 | 5 |
| GO:00182085 | Breast | Precancer | peptidyl-proline modification | 10/1080 | 58/18723 | 1.62e-03 | 1.65e-02 | 10 |
| GO:00181261 | Breast | Precancer | protein hydroxylation | 6/1080 | 27/18723 | 3.78e-03 | 3.04e-02 | 6 |
| GO:001820812 | Breast | IDC | peptidyl-proline modification | 13/1434 | 58/18723 | 3.59e-04 | 5.18e-03 | 13 |
| GO:00184011 | Breast | IDC | peptidyl-proline hydroxylation to 4-hydroxy-L-proline | 5/1434 | 10/18723 | 4.76e-04 | 6.33e-03 | 5 |
| GO:00195111 | Breast | IDC | peptidyl-proline hydroxylation | 5/1434 | 15/18723 | 4.10e-03 | 3.25e-02 | 5 |
| GO:001820821 | Breast | DCIS | peptidyl-proline modification | 13/1390 | 58/18723 | 2.65e-04 | 4.03e-03 | 13 |
| GO:00184012 | Breast | DCIS | peptidyl-proline hydroxylation to 4-hydroxy-L-proline | 5/1390 | 10/18723 | 4.11e-04 | 5.55e-03 | 5 |
| GO:00195112 | Breast | DCIS | peptidyl-proline hydroxylation | 5/1390 | 15/18723 | 3.58e-03 | 2.92e-02 | 5 |
| GO:001820816 | Esophagus | ESCC | peptidyl-proline modification | 46/8552 | 58/18723 | 1.59e-07 | 2.51e-06 | 46 |
| GO:00181263 | Esophagus | ESCC | protein hydroxylation | 23/8552 | 27/18723 | 2.60e-05 | 2.19e-04 | 23 |
| GO:00301984 | Esophagus | ESCC | extracellular matrix organization | 171/8552 | 301/18723 | 6.08e-05 | 4.67e-04 | 171 |
| GO:00430624 | Esophagus | ESCC | extracellular structure organization | 171/8552 | 302/18723 | 7.73e-05 | 5.76e-04 | 171 |
| GO:00452294 | Esophagus | ESCC | external encapsulating structure organization | 172/8552 | 304/18723 | 7.80e-05 | 5.80e-04 | 172 |
| GO:00195114 | Esophagus | ESCC | peptidyl-proline hydroxylation | 13/8552 | 15/18723 | 1.31e-03 | 6.26e-03 | 13 |
| GO:00301993 | Esophagus | ESCC | collagen fibril organization | 40/8552 | 61/18723 | 1.35e-03 | 6.44e-03 | 40 |
| GO:00184014 | Esophagus | ESCC | peptidyl-proline hydroxylation to 4-hydroxy-L-proline | 9/8552 | 10/18723 | 5.09e-03 | 1.92e-02 | 9 |
| GO:001820811 | Liver | HCC | peptidyl-proline modification | 42/7958 | 58/18723 | 3.73e-06 | 4.85e-05 | 42 |
| GO:0018126 | Liver | HCC | protein hydroxylation | 18/7958 | 27/18723 | 9.75e-03 | 3.66e-02 | 18 |
| Page: 1 2 3 |
| Pathway ID | Tissue | Disease Stage | Description | Gene Ratio | Bg Ratio | pvalue | p.adjust | qvalue | Count |
| hsa0033021 | Liver | HCC | Arginine and proline metabolism | 33/4020 | 50/8465 | 6.28e-03 | 1.77e-02 | 9.83e-03 | 33 |
| hsa0033031 | Liver | HCC | Arginine and proline metabolism | 33/4020 | 50/8465 | 6.28e-03 | 1.77e-02 | 9.83e-03 | 33 |
| hsa0033010 | Oral cavity | OSCC | Arginine and proline metabolism | 30/3704 | 50/8465 | 1.50e-02 | 3.26e-02 | 1.66e-02 | 30 |
| hsa0033013 | Oral cavity | OSCC | Arginine and proline metabolism | 30/3704 | 50/8465 | 1.50e-02 | 3.26e-02 | 1.66e-02 | 30 |
| hsa003309 | Prostate | BPH | Arginine and proline metabolism | 18/1718 | 50/8465 | 7.17e-03 | 2.32e-02 | 1.43e-02 | 18 |
| hsa0033012 | Prostate | BPH | Arginine and proline metabolism | 18/1718 | 50/8465 | 7.17e-03 | 2.32e-02 | 1.43e-02 | 18 |
| hsa0033022 | Prostate | Tumor | Arginine and proline metabolism | 19/1791 | 50/8465 | 4.73e-03 | 1.67e-02 | 1.03e-02 | 19 |
| hsa0033032 | Prostate | Tumor | Arginine and proline metabolism | 19/1791 | 50/8465 | 4.73e-03 | 1.67e-02 | 1.03e-02 | 19 |
| Page: 1 |
Top |
Cell-cell communication analysis |
| Identification of potential cell-cell interactions between two cell types and their ligand-receptor pairs for different disease states |
| Ligand | Receptor | LRpair | Pathway | Tissue | Disease Stage |
| Page: 1 |
Top |
Single-cell gene regulatory network inference analysis |
| Find out the significant the regulons (TFs) and the target genes of each regulon across cell types for different disease states |
| TF | Cell Type | Tissue | Disease Stage | Target Gene | RSS | Regulon Activity |
| ∗The dot plots of a searched regulon are shown for all cell subpopulations in each disease state of each tissue based on the regulon specific score inferred using pySCENIC and by calculating the average expression. |
| Page: 1 |
Top |
Somatic mutation of malignant transformation related genes |
| Annotation of somatic variants for genes involved in malignant transformation |
| Hugo Symbol | Variant Class | Variant Classification | dbSNP RS | HGVSc | HGVSp | HGVSp Short | SWISSPROT | BIOTYPE | SIFT | PolyPhen | Tumor Sample Barcode | Tissue | Histology | Sex | Age | Stage | Therapy Types | Drugs | Outcome |
| P4HA1 | SNV | Missense_Mutation | rs775043819 | c.1054N>A | p.Val352Ile | p.V352I | P13674 | protein_coding | tolerated(1) | benign(0.007) | TCGA-A2-A0EQ-01 | Breast | breast invasive carcinoma | Female | <65 | I/II | Chemotherapy | adriamycin | SD |
| P4HA1 | SNV | Missense_Mutation | c.460C>T | p.Pro154Ser | p.P154S | P13674 | protein_coding | tolerated(0.23) | benign(0.34) | TCGA-AN-A0AK-01 | Breast | breast invasive carcinoma | Female | >=65 | I/II | Unknown | Unknown | SD | |
| P4HA1 | SNV | Missense_Mutation | c.1508N>T | p.Cys503Phe | p.C503F | P13674 | protein_coding | deleterious(0) | probably_damaging(0.993) | TCGA-D8-A1X9-01 | Breast | breast invasive carcinoma | Female | >=65 | I/II | Chemotherapy | adriamycin+cyclophosphamide | SD | |
| P4HA1 | SNV | Missense_Mutation | c.1148N>T | p.Ser383Ile | p.S383I | P13674 | protein_coding | deleterious(0) | possibly_damaging(0.774) | TCGA-AA-A02R-01 | Colorectum | colon adenocarcinoma | Female | >=65 | I/II | Unknown | Unknown | PD | |
| P4HA1 | SNV | Missense_Mutation | novel | c.138T>G | p.Ile46Met | p.I46M | P13674 | protein_coding | deleterious(0) | probably_damaging(1) | TCGA-AZ-4315-01 | Colorectum | colon adenocarcinoma | Male | <65 | I/II | Unknown | Unknown | SD |
| P4HA1 | SNV | Missense_Mutation | rs761463646 | c.932N>A | p.Arg311His | p.R311H | P13674 | protein_coding | deleterious(0) | probably_damaging(0.925) | TCGA-G4-6628-01 | Colorectum | colon adenocarcinoma | Male | >=65 | I/II | Unknown | Unknown | SD |
| P4HA1 | SNV | Missense_Mutation | c.214N>C | p.Lys72Gln | p.K72Q | P13674 | protein_coding | tolerated(0.69) | benign(0.034) | TCGA-AG-3892-01 | Colorectum | rectum adenocarcinoma | Female | <65 | I/II | Unknown | Unknown | SD | |
| P4HA1 | SNV | Missense_Mutation | novel | c.1305N>C | p.Lys435Asn | p.K435N | P13674 | protein_coding | deleterious(0.03) | benign(0.366) | TCGA-A5-A0G2-01 | Endometrium | uterine corpus endometrioid carcinoma | Female | <65 | III/IV | Unknown | Unknown | SD |
| P4HA1 | SNV | Missense_Mutation | c.1199N>A | p.Arg400Lys | p.R400K | P13674 | protein_coding | deleterious(0.01) | possibly_damaging(0.611) | TCGA-A5-A0G2-01 | Endometrium | uterine corpus endometrioid carcinoma | Female | <65 | III/IV | Unknown | Unknown | SD | |
| P4HA1 | SNV | Missense_Mutation | c.1015N>T | p.Arg339Cys | p.R339C | P13674 | protein_coding | deleterious(0.02) | probably_damaging(0.962) | TCGA-A5-A0G2-01 | Endometrium | uterine corpus endometrioid carcinoma | Female | <65 | III/IV | Unknown | Unknown | SD |
| Page: 1 2 3 4 5 |
Top |
Related drugs of malignant transformation related genes |
| Identification of chemicals and drugs interact with genes involved in malignant transfromation |
| (DGIdb 4.0) |
| Entrez ID | Symbol | Category | Interaction Types | Drug Claim Name | Drug Name | PMIDs |
| 5033 | P4HA1 | DRUGGABLE GENOME, ENZYME | PYRIDINE-2,5-DICARBOXYLIC ACID | PYRIDINE-2,5-DICARBOXYLIC ACID | 26022078 | |
| 5033 | P4HA1 | DRUGGABLE GENOME, ENZYME | SAFIRONIL | SAFIRONIL | ||
| 5033 | P4HA1 | DRUGGABLE GENOME, ENZYME | Lufironil | LUFIRONIL |
| Page: 1 |

Copyright 2023-Present -The University of Texas Health Science Center at Houston |