
|
|||||
|
 | |
| |
| |
| |
| |
| |
|
Gene: P3H4 |
Gene summary for P3H4 |
| Gene information | Species | Human | Gene symbol | P3H4 | Gene ID | 10609 |
| Gene name | prolyl 3-hydroxylase family member 4 (inactive) | |
| Gene Alias | LEPREL4 | |
| Cytomap | 17q21.2 | |
| Gene Type | protein-coding | GO ID | GO:0000003 | UniProtAcc | Q92791 |
Top |
Malignant transformation analysis |
| Identification of the aberrant gene expression in precancerous and cancerous lesions by comparing the gene expression of stem-like cells in diseased tissues with normal stem cells |
| Entrez ID | Symbol | Replicates | Species | Organ | Tissue | Adj P-value | Log2FC | Malignancy |
| 10609 | P3H4 | LZE7T | Human | Esophagus | ESCC | 6.33e-03 | 1.50e-01 | 0.0667 |
| 10609 | P3H4 | LZE22D1 | Human | Esophagus | HGIN | 3.26e-02 | 1.35e-01 | 0.0595 |
| 10609 | P3H4 | LZE22T | Human | Esophagus | ESCC | 1.48e-05 | 3.88e-01 | 0.068 |
| 10609 | P3H4 | LZE24T | Human | Esophagus | ESCC | 1.09e-06 | 1.50e-01 | 0.0596 |
| 10609 | P3H4 | P1T-E | Human | Esophagus | ESCC | 4.62e-03 | 1.57e-01 | 0.0875 |
| 10609 | P3H4 | P2T-E | Human | Esophagus | ESCC | 3.26e-40 | 7.44e-01 | 0.1177 |
| 10609 | P3H4 | P4T-E | Human | Esophagus | ESCC | 3.57e-46 | 9.03e-01 | 0.1323 |
| 10609 | P3H4 | P5T-E | Human | Esophagus | ESCC | 5.54e-16 | 3.89e-01 | 0.1327 |
| 10609 | P3H4 | P8T-E | Human | Esophagus | ESCC | 1.20e-18 | 3.85e-01 | 0.0889 |
| 10609 | P3H4 | P9T-E | Human | Esophagus | ESCC | 1.23e-14 | 3.57e-01 | 0.1131 |
| 10609 | P3H4 | P10T-E | Human | Esophagus | ESCC | 3.65e-15 | 2.48e-01 | 0.116 |
| 10609 | P3H4 | P11T-E | Human | Esophagus | ESCC | 2.96e-18 | 6.25e-01 | 0.1426 |
| 10609 | P3H4 | P12T-E | Human | Esophagus | ESCC | 1.10e-29 | 6.55e-01 | 0.1122 |
| 10609 | P3H4 | P15T-E | Human | Esophagus | ESCC | 4.46e-14 | 3.29e-01 | 0.1149 |
| 10609 | P3H4 | P16T-E | Human | Esophagus | ESCC | 1.06e-44 | 8.91e-01 | 0.1153 |
| 10609 | P3H4 | P19T-E | Human | Esophagus | ESCC | 1.65e-10 | 6.46e-01 | 0.1662 |
| 10609 | P3H4 | P20T-E | Human | Esophagus | ESCC | 2.72e-14 | 2.69e-01 | 0.1124 |
| 10609 | P3H4 | P21T-E | Human | Esophagus | ESCC | 1.90e-22 | 3.92e-01 | 0.1617 |
| 10609 | P3H4 | P22T-E | Human | Esophagus | ESCC | 2.51e-25 | 5.22e-01 | 0.1236 |
| 10609 | P3H4 | P23T-E | Human | Esophagus | ESCC | 7.50e-13 | 2.83e-01 | 0.108 |
| Page: 1 2 3 4 5 |
| Tissue | Expression Dynamics | Abbreviation |
| Esophagus | 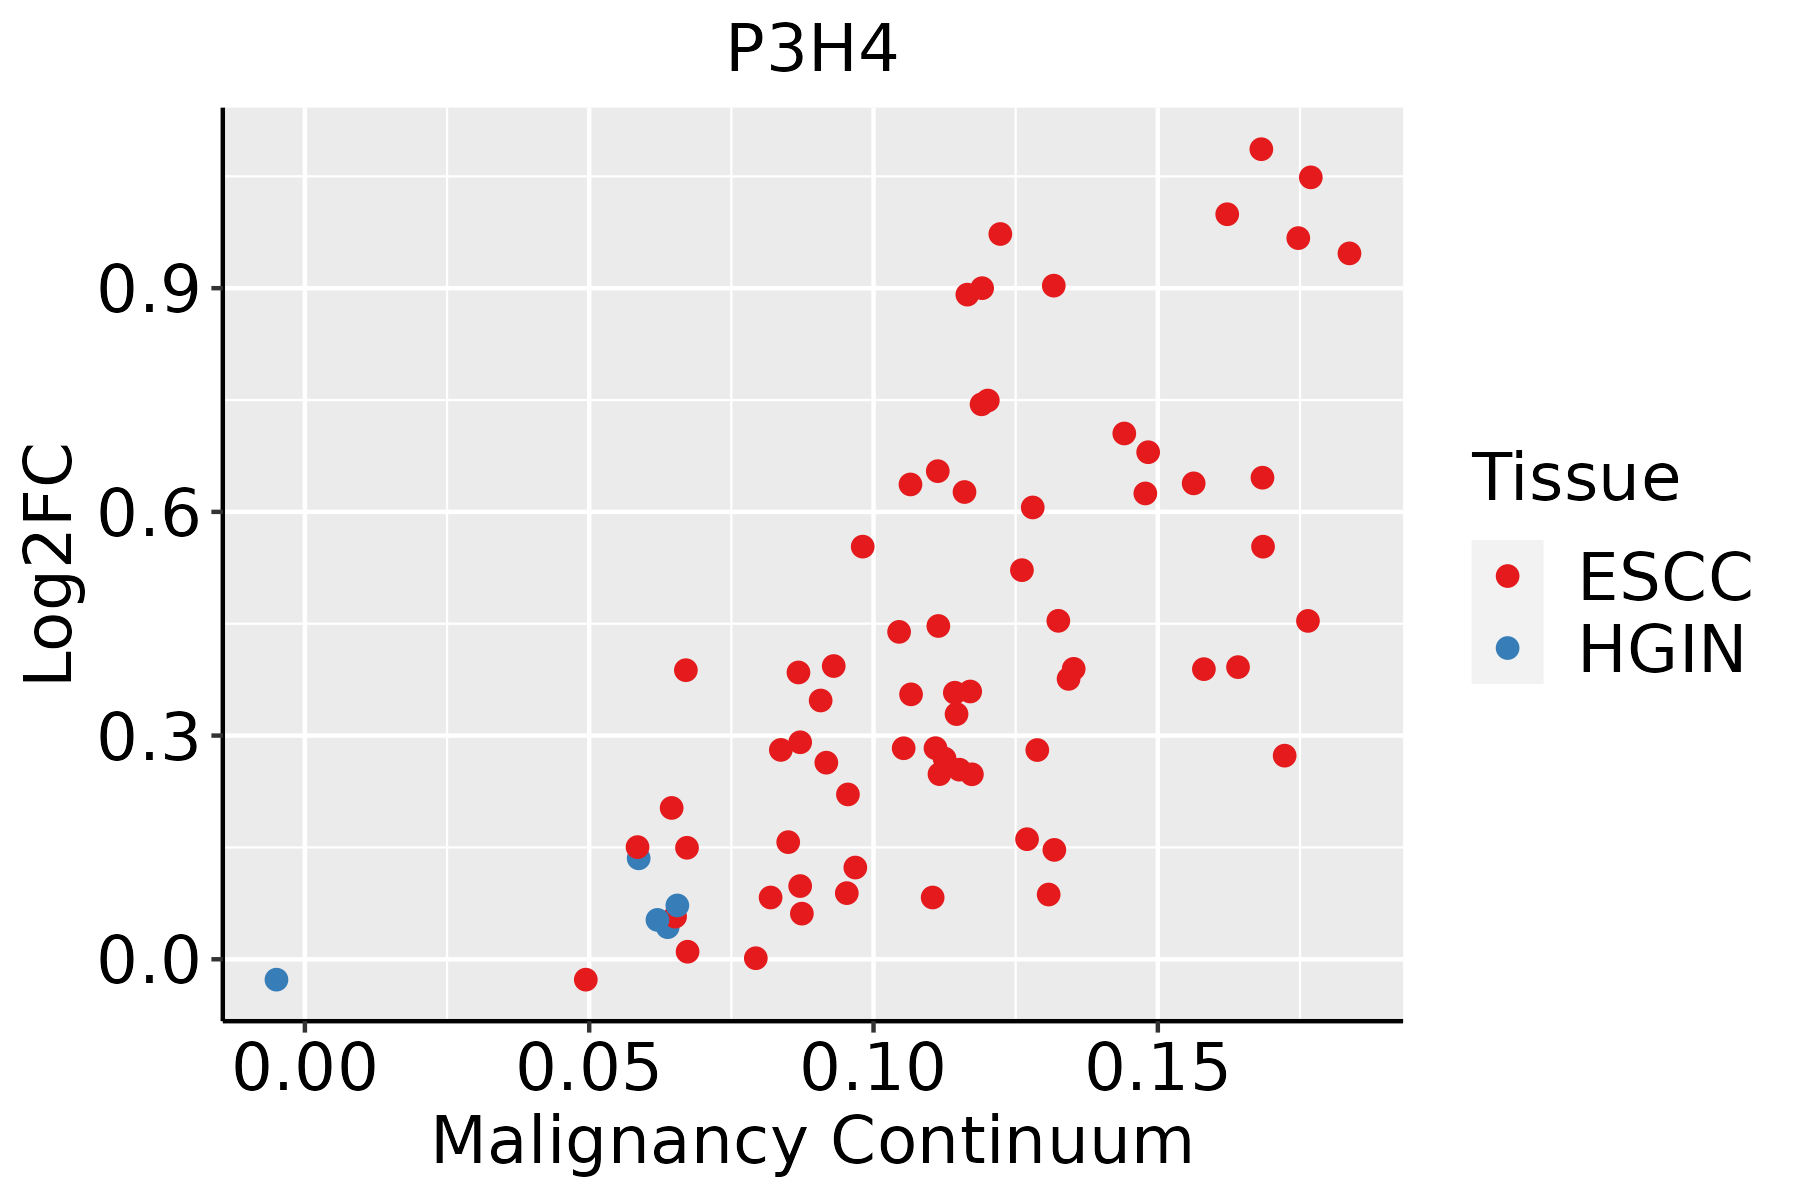 | ESCC: Esophageal squamous cell carcinoma |
| HGIN: High-grade intraepithelial neoplasias | ||
| LGIN: Low-grade intraepithelial neoplasias | ||
| Liver |  | HCC: Hepatocellular carcinoma |
| NAFLD: Non-alcoholic fatty liver disease | ||
| Oral Cavity | 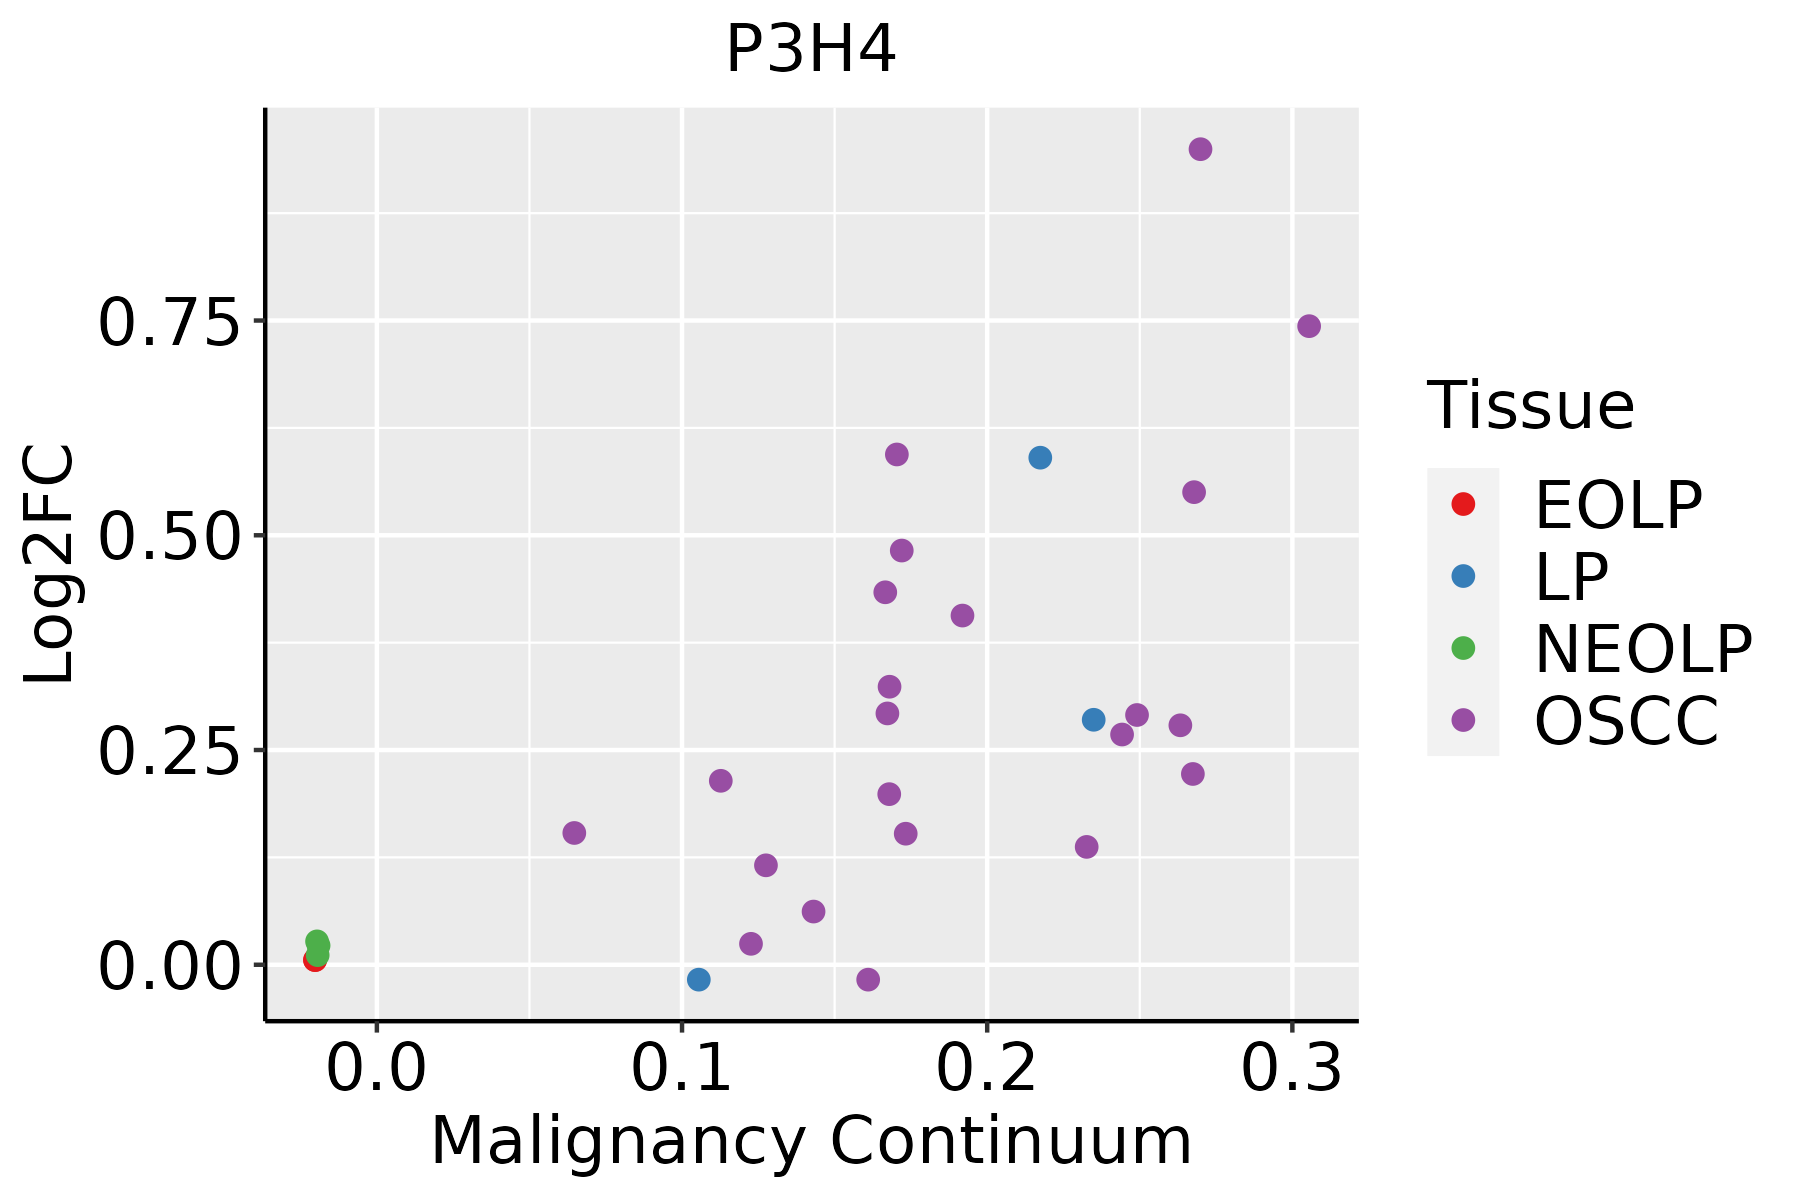 | EOLP: Erosive Oral lichen planus |
| LP: leukoplakia | ||
| NEOLP: Non-erosive oral lichen planus | ||
| OSCC: Oral squamous cell carcinoma | ||
| Thyroid |  | ATC: Anaplastic thyroid cancer |
| HT: Hashimoto's thyroiditis | ||
| PTC: Papillary thyroid cancer |
| ∗log2FC in expression of this searched gene in stem-like cells from each diseased tissue sample relative to stem-like cells in normal samples in each tissue plotted against the malignancy continuum. Samples are colored based on if they are from different disease stage. |
Top |
Malignant transformation related pathway analysis |
| Find out the enriched GO biological processes and KEGG pathways involved in transition from healthy to precancer to cancer |
| Tissue | Disease Stage | Enriched GO biological Processes |
| Colorectum | AD |  |
| Colorectum | SER |  |
| Colorectum | MSS |  |
| Colorectum | MSI-H |  |
| Colorectum | FAP |  |
| ∗Top 15 enriched GO BP terms are showed in the bar plot of each disease state in each tissue. Each row represents a significant GO biological process which is colored according to the -log10(p.adjust). |
| Page: 1 2 3 4 5 6 7 8 9 |
| GO ID | Tissue | Disease Stage | Description | Gene Ratio | Bg Ratio | pvalue | p.adjust | Count |
| GO:00182057 | Esophagus | HGIN | peptidyl-lysine modification | 88/2587 | 376/18723 | 2.99e-07 | 1.39e-05 | 88 |
| GO:00070593 | Esophagus | HGIN | chromosome segregation | 71/2587 | 346/18723 | 3.47e-04 | 5.62e-03 | 71 |
| GO:001820514 | Esophagus | ESCC | peptidyl-lysine modification | 259/8552 | 376/18723 | 3.90e-20 | 5.26e-18 | 259 |
| GO:000705911 | Esophagus | ESCC | chromosome segregation | 238/8552 | 346/18723 | 1.72e-18 | 1.82e-16 | 238 |
| GO:00482853 | Esophagus | ESCC | organelle fission | 301/8552 | 488/18723 | 4.64e-13 | 2.12e-11 | 301 |
| GO:00988133 | Esophagus | ESCC | nuclear chromosome segregation | 187/8552 | 281/18723 | 1.00e-12 | 4.36e-11 | 187 |
| GO:00002802 | Esophagus | ESCC | nuclear division | 270/8552 | 439/18723 | 1.17e-11 | 4.24e-10 | 270 |
| GO:00181263 | Esophagus | ESCC | protein hydroxylation | 23/8552 | 27/18723 | 2.60e-05 | 2.19e-04 | 23 |
| GO:00301984 | Esophagus | ESCC | extracellular matrix organization | 171/8552 | 301/18723 | 6.08e-05 | 4.67e-04 | 171 |
| GO:00430624 | Esophagus | ESCC | extracellular structure organization | 171/8552 | 302/18723 | 7.73e-05 | 5.76e-04 | 171 |
| GO:00452294 | Esophagus | ESCC | external encapsulating structure organization | 172/8552 | 304/18723 | 7.80e-05 | 5.80e-04 | 172 |
| GO:00301993 | Esophagus | ESCC | collagen fibril organization | 40/8552 | 61/18723 | 1.35e-03 | 6.44e-03 | 40 |
| GO:00329631 | Esophagus | ESCC | collagen metabolic process | 62/8552 | 104/18723 | 2.90e-03 | 1.22e-02 | 62 |
| GO:00182052 | Liver | HCC | peptidyl-lysine modification | 230/7958 | 376/18723 | 1.51e-13 | 8.32e-12 | 230 |
| GO:0007059 | Liver | HCC | chromosome segregation | 197/7958 | 346/18723 | 3.57e-08 | 7.87e-07 | 197 |
| GO:0098813 | Liver | HCC | nuclear chromosome segregation | 157/7958 | 281/18723 | 3.82e-06 | 4.95e-05 | 157 |
| GO:0048285 | Liver | HCC | organelle fission | 254/7958 | 488/18723 | 1.07e-05 | 1.23e-04 | 254 |
| GO:0000280 | Liver | HCC | nuclear division | 220/7958 | 439/18723 | 6.90e-04 | 4.25e-03 | 220 |
| GO:0018126 | Liver | HCC | protein hydroxylation | 18/7958 | 27/18723 | 9.75e-03 | 3.66e-02 | 18 |
| GO:00070592 | Oral cavity | OSCC | chromosome segregation | 206/7305 | 346/18723 | 5.82e-15 | 3.76e-13 | 206 |
| Page: 1 2 3 |
| Pathway ID | Tissue | Disease Stage | Description | Gene Ratio | Bg Ratio | pvalue | p.adjust | qvalue | Count |
| Page: 1 |
Top |
Cell-cell communication analysis |
| Identification of potential cell-cell interactions between two cell types and their ligand-receptor pairs for different disease states |
| Ligand | Receptor | LRpair | Pathway | Tissue | Disease Stage |
| Page: 1 |
Top |
Single-cell gene regulatory network inference analysis |
| Find out the significant the regulons (TFs) and the target genes of each regulon across cell types for different disease states |
| TF | Cell Type | Tissue | Disease Stage | Target Gene | RSS | Regulon Activity |
| ∗The dot plots of a searched regulon are shown for all cell subpopulations in each disease state of each tissue based on the regulon specific score inferred using pySCENIC and by calculating the average expression. |
| Page: 1 |
Top |
Somatic mutation of malignant transformation related genes |
| Annotation of somatic variants for genes involved in malignant transformation |
| Hugo Symbol | Variant Class | Variant Classification | dbSNP RS | HGVSc | HGVSp | HGVSp Short | SWISSPROT | BIOTYPE | SIFT | PolyPhen | Tumor Sample Barcode | Tissue | Histology | Sex | Age | Stage | Therapy Types | Drugs | Outcome |
| P3H4 | SNV | Missense_Mutation | c.1156N>C | p.Glu386Gln | p.E386Q | Q92791 | protein_coding | tolerated(0.56) | benign(0.027) | TCGA-C8-A26Y-01 | Breast | breast invasive carcinoma | Female | >=65 | I/II | Unknown | Unknown | SD | |
| P3H4 | insertion | Frame_Shift_Ins | novel | c.1188_1189insCACGCCTGTAATCCCAGCACTGAGAGGC | p.Ala397HisfsTer13 | p.A397Hfs*13 | Q92791 | protein_coding | TCGA-AN-A0FX-01 | Breast | breast invasive carcinoma | Female | <65 | I/II | Unknown | Unknown | SD | ||
| P3H4 | insertion | Nonsense_Mutation | novel | c.968_969insAAAATAAATAAATAAATAATAAAAAATAAACTC | p.Asp323delinsGluLysTerIleAsnLysTerTerLysIleAsnSer | p.D323delinsEK*INK**KINS | Q92791 | protein_coding | TCGA-B6-A0IA-01 | Breast | breast invasive carcinoma | Female | <65 | I/II | Unknown | Unknown | SD | ||
| P3H4 | SNV | Missense_Mutation | rs782752371 | c.1025N>A | p.Arg342His | p.R342H | Q92791 | protein_coding | deleterious(0.01) | benign(0.028) | TCGA-ZX-AA5X-01 | Cervix | cervical & endocervical cancer | Female | <65 | III/IV | Unknown | Unknown | SD |
| P3H4 | SNV | Missense_Mutation | c.615G>T | p.Glu205Asp | p.E205D | Q92791 | protein_coding | deleterious(0.03) | benign(0.34) | TCGA-CM-5861-01 | Colorectum | colon adenocarcinoma | Female | <65 | I/II | Unknown | Unknown | PD | |
| P3H4 | SNV | Missense_Mutation | rs781875731 | c.1169N>T | p.Pro390Leu | p.P390L | Q92791 | protein_coding | tolerated(0.29) | benign(0) | TCGA-A5-A0G2-01 | Endometrium | uterine corpus endometrioid carcinoma | Female | <65 | III/IV | Unknown | Unknown | SD |
| P3H4 | SNV | Missense_Mutation | rs782149319 | c.1018N>T | p.Arg340Trp | p.R340W | Q92791 | protein_coding | deleterious(0) | probably_damaging(0.994) | TCGA-AP-A1DK-01 | Endometrium | uterine corpus endometrioid carcinoma | Female | <65 | I/II | Unknown | Unknown | SD |
| P3H4 | SNV | Missense_Mutation | rs551655243 | c.929N>A | p.Arg310His | p.R310H | Q92791 | protein_coding | deleterious(0.05) | benign(0.003) | TCGA-AP-A1DV-01 | Endometrium | uterine corpus endometrioid carcinoma | Female | <65 | I/II | Unknown | Unknown | SD |
| P3H4 | SNV | Missense_Mutation | novel | c.518N>A | p.Pro173Gln | p.P173Q | Q92791 | protein_coding | deleterious(0) | probably_damaging(1) | TCGA-AX-A0IZ-01 | Endometrium | uterine corpus endometrioid carcinoma | Female | <65 | I/II | Unknown | Unknown | SD |
| P3H4 | SNV | Missense_Mutation | c.1016N>G | p.His339Arg | p.H339R | Q92791 | protein_coding | deleterious(0) | possibly_damaging(0.731) | TCGA-D1-A0ZO-01 | Endometrium | uterine corpus endometrioid carcinoma | Female | >=65 | I/II | Unknown | Unknown | SD |
| Page: 1 2 3 |
Top |
Related drugs of malignant transformation related genes |
| Identification of chemicals and drugs interact with genes involved in malignant transfromation |
| (DGIdb 4.0) |
| Entrez ID | Symbol | Category | Interaction Types | Drug Claim Name | Drug Name | PMIDs |
| Page: 1 |

Copyright 2023-Present -The University of Texas Health Science Center at Houston |