Schematic overview of the cellular and molecular mechanisms involved in the cancer progression, including the proposed cellular and molecular mechanisms in cancer cells trajectory. AT1: alveolar type 1 cells; AT2: alveolar type 2 cells; AAH: atypical adenomatous hyperplasia; AIS: adenocarcinoma in situ; MIA: minimally invasive adenocarcinoma; IA: invasive adenocarcinoma; EMT: epithelial-mesenchymal transition

Home

Download

Statistics

Help

Contact

Center for Computational Systems Medicine
leaf

Gene summary

leaf

Malignant transformation analysis

leaf

Malignant transformation related pathway analysis

leaf

Cell-cell communication analysis

leaf

Single-cell gene regulatory network inference analysis

leaf

Somatic mutation of malignant transformation related genes

leaf

Related drugs of malignant transformation related genes

Gene: P3H1

Gene summary for P3H1

check button Gene summary.

Gene informationSpeciesHuman
Gene symbol

P3H1

Gene ID

64175

Gene nameprolyl 3-hydroxylase 1
Gene AliasGROS1
Cytomap1p34.2
Gene Typeprotein-coding
GO ID

GO:0001501

UniProtAcc

Q32P28


Top

Malignant transformation analysis

check button Identification of the aberrant gene expression in precancerous and cancerous lesions by comparing the gene expression of stem-like cells in diseased tissues with normal stem cells
check button Malignant transformation involving gene list.
Entrez IDSymbolReplicatesSpeciesOrganTissueAdj P-valueLog2FCMalignancy
64175P3H1LZE2THumanEsophagusESCC8.57e-064.89e-010.082
64175P3H1LZE4THumanEsophagusESCC1.95e-031.37e-010.0811
64175P3H1LZE24THumanEsophagusESCC7.75e-082.14e-010.0596
64175P3H1P2T-EHumanEsophagusESCC1.75e-283.98e-010.1177
64175P3H1P4T-EHumanEsophagusESCC9.46e-184.66e-010.1323
64175P3H1P5T-EHumanEsophagusESCC5.77e-051.78e-010.1327
64175P3H1P8T-EHumanEsophagusESCC3.10e-153.05e-010.0889
64175P3H1P9T-EHumanEsophagusESCC4.48e-092.58e-010.1131
64175P3H1P10T-EHumanEsophagusESCC2.70e-518.02e-010.116
64175P3H1P11T-EHumanEsophagusESCC5.88e-104.52e-010.1426
64175P3H1P12T-EHumanEsophagusESCC7.69e-183.67e-010.1122
64175P3H1P15T-EHumanEsophagusESCC5.22e-123.50e-010.1149
64175P3H1P16T-EHumanEsophagusESCC4.87e-234.10e-010.1153
64175P3H1P17T-EHumanEsophagusESCC2.93e-063.33e-010.1278
64175P3H1P19T-EHumanEsophagusESCC3.45e-146.72e-010.1662
64175P3H1P20T-EHumanEsophagusESCC7.79e-132.65e-010.1124
64175P3H1P21T-EHumanEsophagusESCC1.17e-265.68e-010.1617
64175P3H1P22T-EHumanEsophagusESCC9.89e-153.71e-010.1236
64175P3H1P23T-EHumanEsophagusESCC1.53e-173.18e-010.108
64175P3H1P24T-EHumanEsophagusESCC1.81e-072.44e-010.1287
Page: 1 2 3 4 5 

check button Transcriptomic changes along malignancy continuum.
TissueExpression DynamicsAbbreviation
EsophagusThe image shows the transcriptomic changes along malignancy continuum.log2FC in expression of this searched gene in stem-like cells from each diseased tissue sample relative to stem-like cells in normal samples in each tissue plotted against the malignancy continuum. Samples are colored based on if they are from different disease stage.
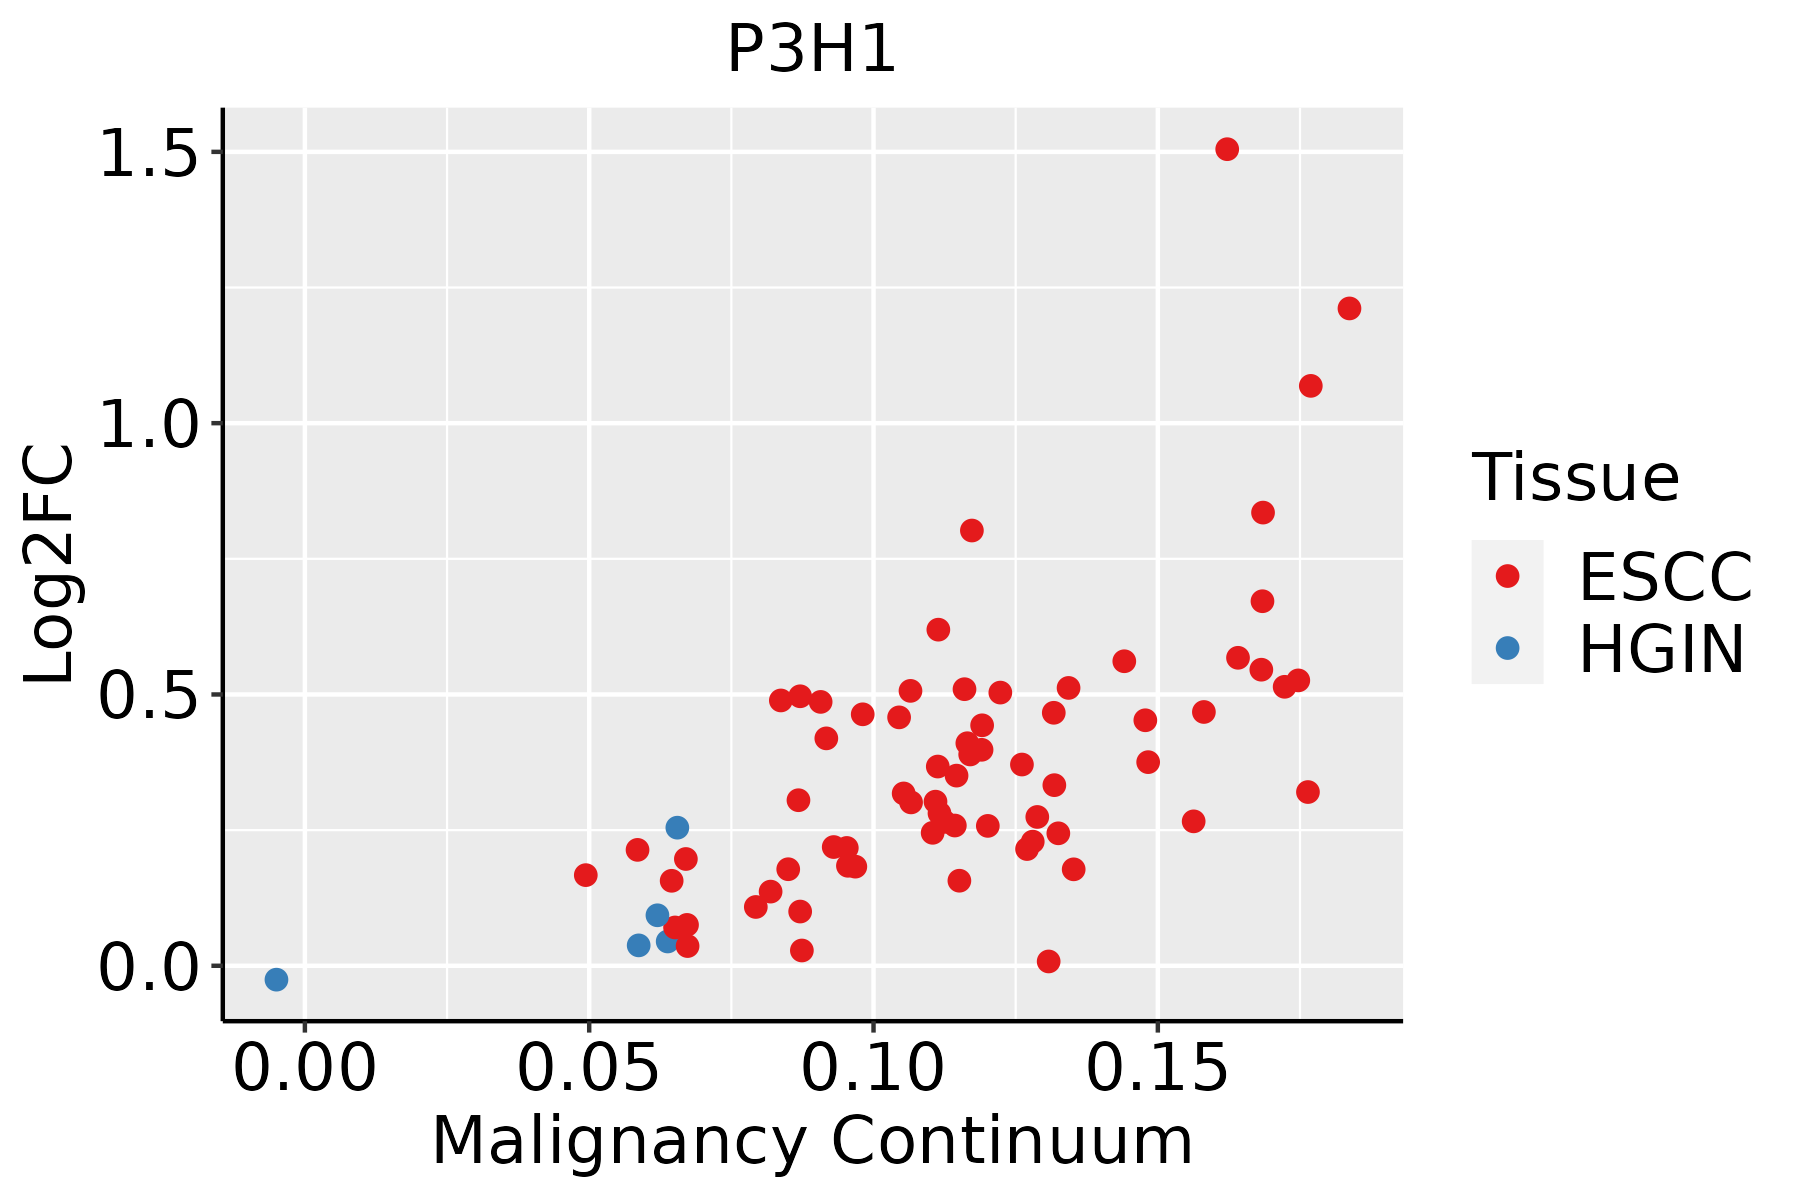
ESCC: Esophageal squamous cell carcinoma
HGIN: High-grade intraepithelial neoplasias
LGIN: Low-grade intraepithelial neoplasias
LiverThe image shows the transcriptomic changes along malignancy continuum.log2FC in expression of this searched gene in stem-like cells from each diseased tissue sample relative to stem-like cells in normal samples in each tissue plotted against the malignancy continuum. Samples are colored based on if they are from different disease stage.
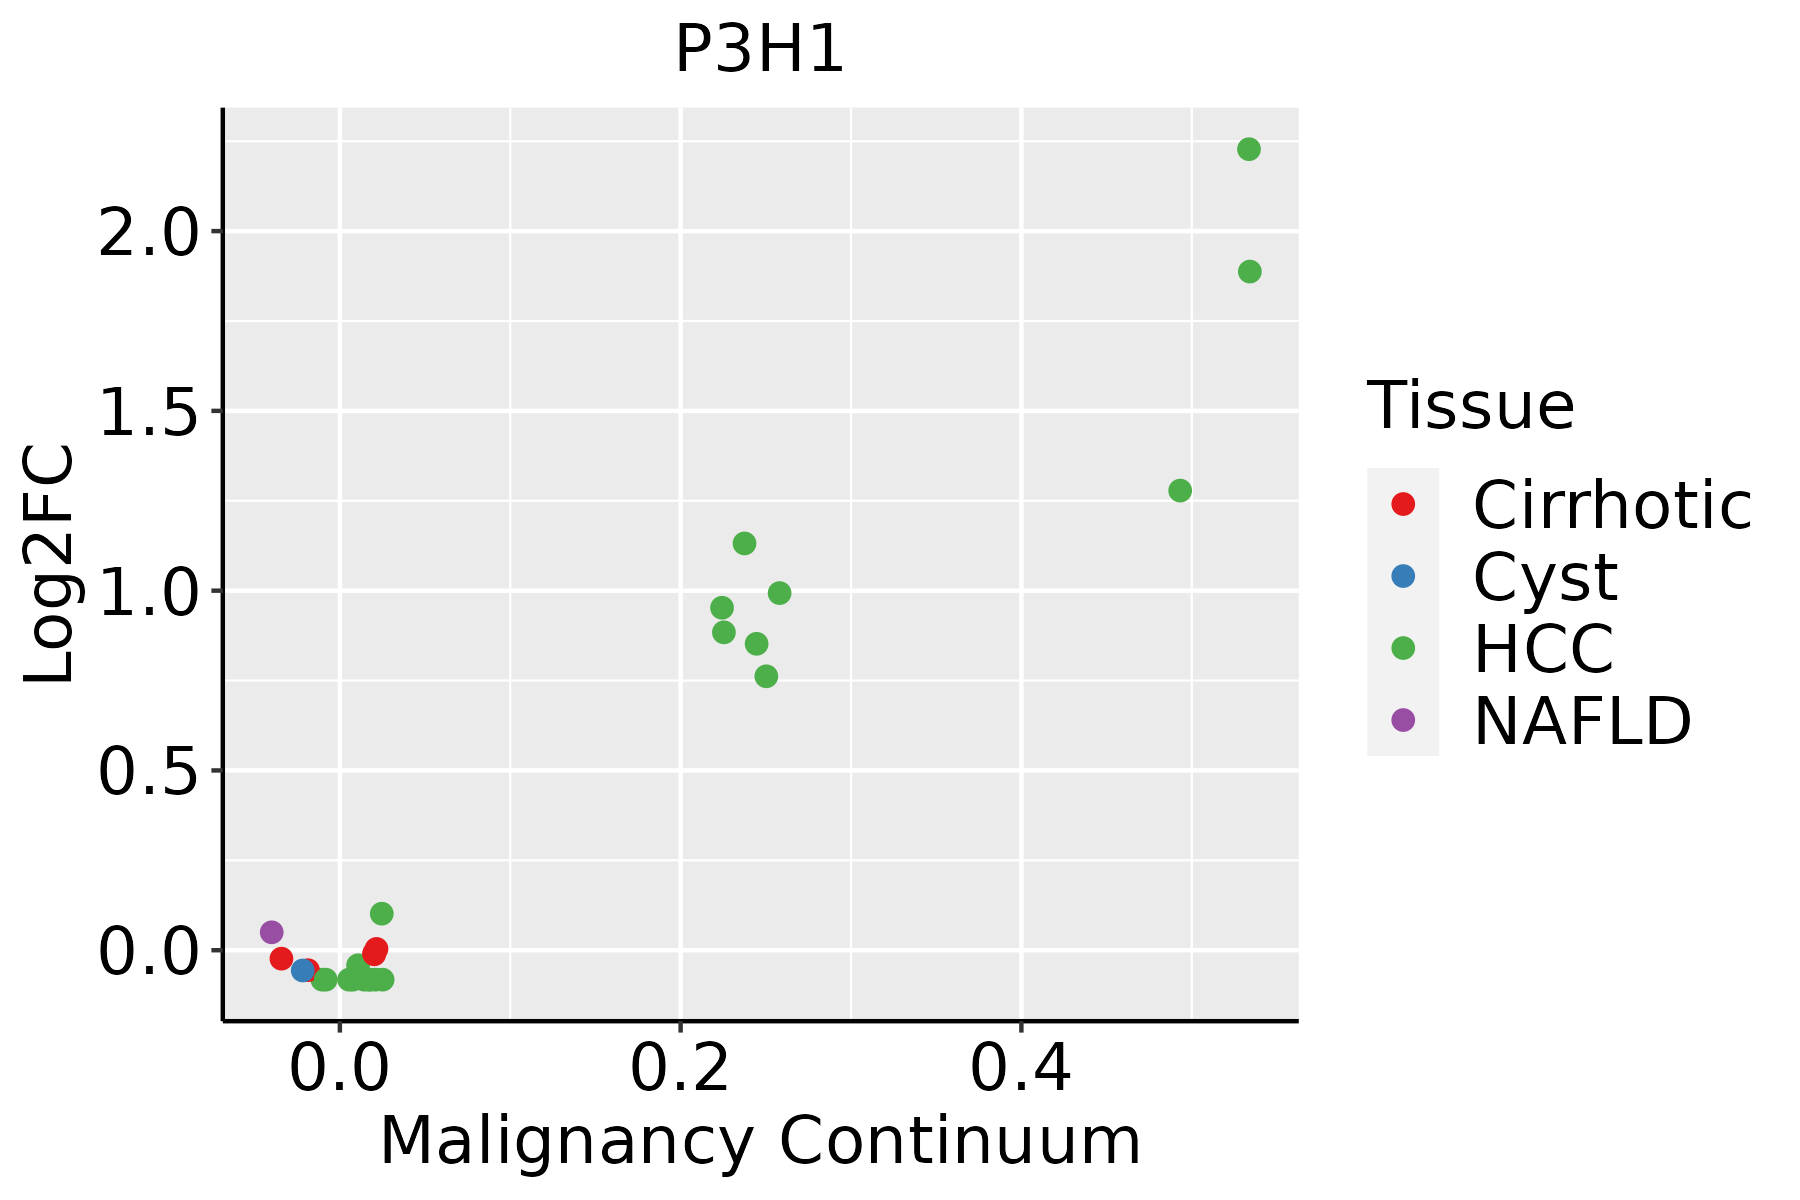
HCC: Hepatocellular carcinoma
NAFLD: Non-alcoholic fatty liver disease
Oral CavityThe image shows the transcriptomic changes along malignancy continuum.log2FC in expression of this searched gene in stem-like cells from each diseased tissue sample relative to stem-like cells in normal samples in each tissue plotted against the malignancy continuum. Samples are colored based on if they are from different disease stage.
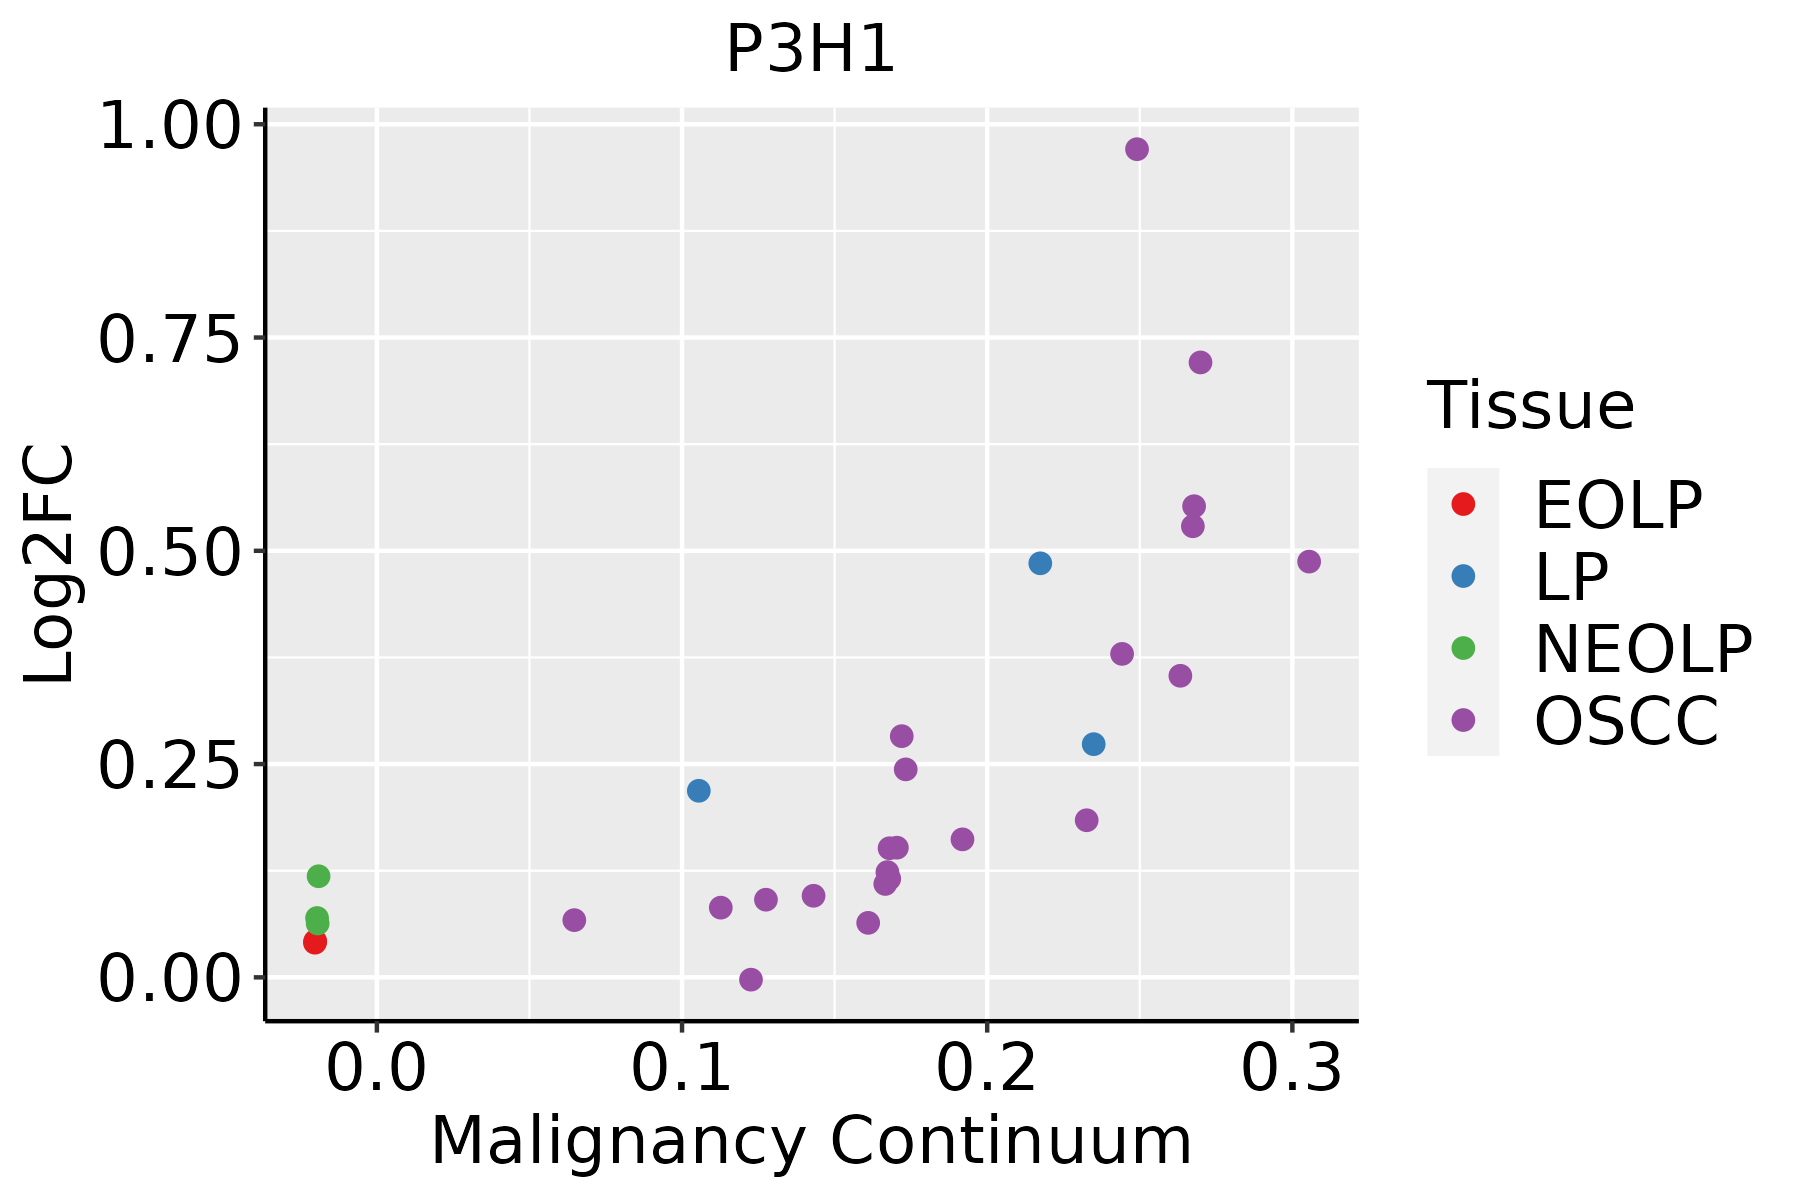
EOLP: Erosive Oral lichen planus
LP: leukoplakia
NEOLP: Non-erosive oral lichen planus
OSCC: Oral squamous cell carcinoma
ThyroidThe image shows the transcriptomic changes along malignancy continuum.log2FC in expression of this searched gene in stem-like cells from each diseased tissue sample relative to stem-like cells in normal samples in each tissue plotted against the malignancy continuum. Samples are colored based on if they are from different disease stage.ATC: Anaplastic thyroid cancer
HT: Hashimoto's thyroiditis
PTC: Papillary thyroid cancer
∗log2FC in expression of this searched gene in stem-like cells from each diseased tissue sample relative to stem-like cells in normal samples in each tissue plotted against the malignancy continuum. Samples are colored based on if they are from different disease stage.

Top

Malignant transformation related pathway analysis

check buttonFind out the enriched GO biological processes and KEGG pathways involved in transition from healthy to precancer to cancer
check button Figure of enriched GO biological processes.
TissueDisease StageEnriched GO biological Processes
ColorectumADGO analysis - Figure of enriched GO biological processes: Top 15 enriched GO BP terms are showed in the bar plot of each disease state in each tissue. Each row represents a significant GO biological process which is colored according to the -log10(p.adjust).
ColorectumSERGO analysis - Figure of enriched GO biological processes: Top 15 enriched GO BP terms are showed in the bar plot of each disease state in each tissue. Each row represents a significant GO biological process which is colored according to the -log10(p.adjust).
ColorectumMSSGO analysis - Figure of enriched GO biological processes: Top 15 enriched GO BP terms are showed in the bar plot of each disease state in each tissue. Each row represents a significant GO biological process which is colored according to the -log10(p.adjust).
ColorectumMSI-HGO analysis - Figure of enriched GO biological processes: Top 15 enriched GO BP terms are showed in the bar plot of each disease state in each tissue. Each row represents a significant GO biological process which is colored according to the -log10(p.adjust).
ColorectumFAPGO analysis - Figure of enriched GO biological processes: Top 15 enriched GO BP terms are showed in the bar plot of each disease state in each tissue. Each row represents a significant GO biological process which is colored according to the -log10(p.adjust).
∗Top 15 enriched GO BP terms are showed in the bar plot of each disease state in each tissue. Each row represents a significant GO biological process which is colored according to the -log10(p.adjust).
Page: 1 2 3 4 5 6 7 8 9 

check button Enriched GO biological processes.
GO IDTissueDisease StageDescriptionGene RatioBg Ratiopvaluep.adjustCount
GO:0031647111EsophagusESCCregulation of protein stability223/8552298/187235.76e-251.52e-22223
GO:0006457110EsophagusESCCprotein folding163/8552212/187231.13e-201.74e-18163
GO:0050821111EsophagusESCCprotein stabilization140/8552191/187236.50e-153.61e-13140
GO:0061077110EsophagusESCCchaperone-mediated protein folding56/855267/187231.52e-104.36e-0956
GO:001820816EsophagusESCCpeptidyl-proline modification46/855258/187231.59e-072.51e-0646
GO:003134616EsophagusESCCpositive regulation of cell projection organization201/8552353/187231.19e-051.11e-04201
GO:00181263EsophagusESCCprotein hydroxylation23/855227/187232.60e-052.19e-0423
GO:001097516EsophagusESCCregulation of neuron projection development240/8552445/187232.48e-041.53e-03240
GO:00195114EsophagusESCCpeptidyl-proline hydroxylation13/855215/187231.31e-036.26e-0313
GO:00603485EsophagusESCCbone development115/8552205/187231.67e-037.72e-03115
GO:00329631EsophagusESCCcollagen metabolic process62/8552104/187232.90e-031.22e-0262
GO:000930617EsophagusESCCprotein secretion190/8552359/187233.22e-031.34e-02190
GO:003559217EsophagusESCCestablishment of protein localization to extracellular region190/8552360/187233.77e-031.53e-02190
GO:007169210EsophagusESCCprotein localization to extracellular region193/8552368/187235.01e-031.92e-02193
GO:00109764EsophagusESCCpositive regulation of neuron projection development91/8552163/187235.72e-032.13e-0291
GO:005070810EsophagusESCCregulation of protein secretion142/8552268/187239.31e-033.24e-02142
GO:003164722LiverHCCregulation of protein stability211/7958298/187232.29e-235.01e-21211
GO:000645712LiverHCCprotein folding160/7958212/187231.07e-221.88e-20160
GO:005082122LiverHCCprotein stabilization139/7958191/187231.61e-171.71e-15139
GO:006107712LiverHCCchaperone-mediated protein folding56/795867/187234.86e-122.14e-1056
Page: 1 2 3 4 

check button Enriched KEGG pathways.
Pathway IDTissueDisease StageDescriptionGene RatioBg Ratiopvaluep.adjustqvalueCount
Page: 1 

Top

Cell-cell communication analysis

check buttonIdentification of potential cell-cell interactions between two cell types and their ligand-receptor pairs for different disease states
LigandReceptorLRpairPathwayTissueDisease Stage
Page: 1 

Top

Single-cell gene regulatory network inference analysis

check buttonFind out the significant the regulons (TFs) and the target genes of each regulon across cell types for different disease states
TFCell TypeTissueDisease StageTarget GeneRSSRegulon Activity
∗The dot plots of a searched regulon are shown for all cell subpopulations in each disease state of each tissue based on the regulon specific score inferred using pySCENIC and by calculating the average expression.
Page: 1 

Top

Somatic mutation of malignant transformation related genes

check buttonAnnotation of somatic variants for genes involved in malignant transformation
Hugo SymbolVariant ClassVariant ClassificationdbSNP RSHGVScHGVSpHGVSp ShortSWISSPROTBIOTYPESIFTPolyPhenTumor Sample BarcodeTissueHistologySexAgeStageTherapy TypesDrugsOutcome
P3H1SNVMissense_Mutationrs368488426c.2069N>Cp.Arg690Prop.R690PQ32P28protein_codingdeleterious_low_confidence(0.02)unknown(0)TCGA-A2-A1FV-01Breastbreast invasive carcinomaFemale>=65I/IIChemotherapycyclophosphamideSD
P3H1SNVMissense_Mutationrs746983037c.1363G>Ap.Glu455Lysp.E455KQ32P28protein_codingdeleterious(0.03)benign(0.02)TCGA-AC-A23H-01Breastbreast invasive carcinomaFemale>=65I/IIUnknownUnknownPD
P3H1SNVMissense_Mutationnovelc.1734N>Tp.Glu578Aspp.E578DQ32P28protein_codingtolerated(0.5)benign(0.001)TCGA-AR-A5QP-01Breastbreast invasive carcinomaFemale<65I/IIHormone TherapytamoxiphenSD
P3H1SNVMissense_Mutationc.1918N>Ap.Glu640Lysp.E640KQ32P28protein_codingtolerated(0.07)probably_damaging(0.917)TCGA-BH-A0HF-01Breastbreast invasive carcinomaFemale>=65I/IIHormone TherapyarimidexSD
P3H1SNVMissense_Mutationc.1313N>Gp.Glu438Glyp.E438GQ32P28protein_codingdeleterious(0.04)probably_damaging(0.91)TCGA-E9-A22G-01Breastbreast invasive carcinomaFemale<65I/IIChemotherapydoxorubicinSD
P3H1SNVMissense_Mutationrs201236270c.1625N>Tp.Thr542Metp.T542MQ32P28protein_codingdeleterious(0)probably_damaging(0.917)TCGA-EW-A1IZ-01Breastbreast invasive carcinomaFemale<65III/IVChemotherapytaxotereSD
P3H1SNVMissense_Mutationnovelc.1406N>Tp.Ser469Phep.S469FQ32P28protein_codingdeleterious(0)probably_damaging(0.999)TCGA-PE-A5DD-01Breastbreast invasive carcinomaFemale<65I/IIChemotherapyCR
P3H1insertionFrame_Shift_Insnovelc.1272_1273insTTCTGCAAGCTGCTGGGAAGGCCTACTGATTGTGGCTCTGCp.Met425PhefsTer15p.M425Ffs*15Q32P28protein_codingTCGA-A8-A09B-01Breastbreast invasive carcinomaFemale<65III/IVChemotherapy5-fluorouracilSD
P3H1insertionFrame_Shift_Insnovelc.501_502insTGTTGCTTGTCp.Thr168CysfsTer20p.T168Cfs*20Q32P28protein_codingTCGA-BH-A0BV-01Breastbreast invasive carcinomaFemale>=65I/IIChemotherapydoxorubicinSD
P3H1insertionIn_Frame_Insnovelc.499_500insCTCAGAGGTp.His167delinsProGlnArgTyrp.H167delinsPQRYQ32P28protein_codingTCGA-BH-A0BV-01Breastbreast invasive carcinomaFemale>=65I/IIChemotherapydoxorubicinSD
Page: 1 2 3 4 5 6 7 

Top

Related drugs of malignant transformation related genes

check buttonIdentification of chemicals and drugs interact with genes involved in malignant transfromation
(DGIdb 4.0)
Entrez IDSymbolCategoryInteraction TypesDrug Claim NameDrug NamePMIDs
Page: 1