
|
|||||
|
 | |
| |
| |
| |
| |
| |
|
Gene: P2RY6 |
Gene summary for P2RY6 |
| Gene information | Species | Human | Gene symbol | P2RY6 | Gene ID | 5031 |
| Gene name | pyrimidinergic receptor P2Y6 | |
| Gene Alias | P2Y6 | |
| Cytomap | 11q13.4 | |
| Gene Type | protein-coding | GO ID | GO:0000165 | UniProtAcc | A0A024R5I9 |
Top |
Malignant transformation analysis |
| Identification of the aberrant gene expression in precancerous and cancerous lesions by comparing the gene expression of stem-like cells in diseased tissues with normal stem cells |
| Entrez ID | Symbol | Replicates | Species | Organ | Tissue | Adj P-value | Log2FC | Malignancy |
| 5031 | P2RY6 | LZE22T | Human | Esophagus | ESCC | 1.57e-03 | 3.06e-01 | 0.068 |
| 5031 | P2RY6 | P5T-E | Human | Esophagus | ESCC | 3.75e-03 | 1.01e-01 | 0.1327 |
| 5031 | P2RY6 | P8T-E | Human | Esophagus | ESCC | 9.44e-07 | 1.77e-01 | 0.0889 |
| 5031 | P2RY6 | P9T-E | Human | Esophagus | ESCC | 5.22e-18 | 3.83e-01 | 0.1131 |
| 5031 | P2RY6 | P11T-E | Human | Esophagus | ESCC | 2.46e-02 | 2.49e-01 | 0.1426 |
| 5031 | P2RY6 | P23T-E | Human | Esophagus | ESCC | 2.89e-02 | 2.05e-01 | 0.108 |
| 5031 | P2RY6 | P49T-E | Human | Esophagus | ESCC | 2.95e-08 | 6.46e-01 | 0.1768 |
| 5031 | P2RY6 | P74T-E | Human | Esophagus | ESCC | 7.09e-07 | 2.07e-01 | 0.1479 |
| 5031 | P2RY6 | P75T-E | Human | Esophagus | ESCC | 7.31e-14 | 4.04e-01 | 0.1125 |
| 5031 | P2RY6 | P89T-E | Human | Esophagus | ESCC | 4.36e-04 | 4.13e-01 | 0.1752 |
| 5031 | P2RY6 | P130T-E | Human | Esophagus | ESCC | 5.57e-40 | 1.15e+00 | 0.1676 |
| 5031 | P2RY6 | C04 | Human | Oral cavity | OSCC | 1.12e-03 | 1.85e-01 | 0.2633 |
| 5031 | P2RY6 | C21 | Human | Oral cavity | OSCC | 2.98e-12 | 5.51e-01 | 0.2678 |
| 5031 | P2RY6 | C30 | Human | Oral cavity | OSCC | 1.59e-26 | 8.04e-01 | 0.3055 |
| 5031 | P2RY6 | C51 | Human | Oral cavity | OSCC | 4.98e-04 | 1.85e-01 | 0.2674 |
| 5031 | P2RY6 | LP15 | Human | Oral cavity | LP | 4.58e-04 | 9.27e-01 | 0.2174 |
| 5031 | P2RY6 | EOLP-1 | Human | Oral cavity | EOLP | 4.33e-08 | 2.66e-01 | -0.0202 |
| 5031 | P2RY6 | SYSMH3 | Human | Oral cavity | OSCC | 3.50e-02 | 1.19e-01 | 0.2442 |
| Page: 1 |
| Tissue | Expression Dynamics | Abbreviation |
| Esophagus | 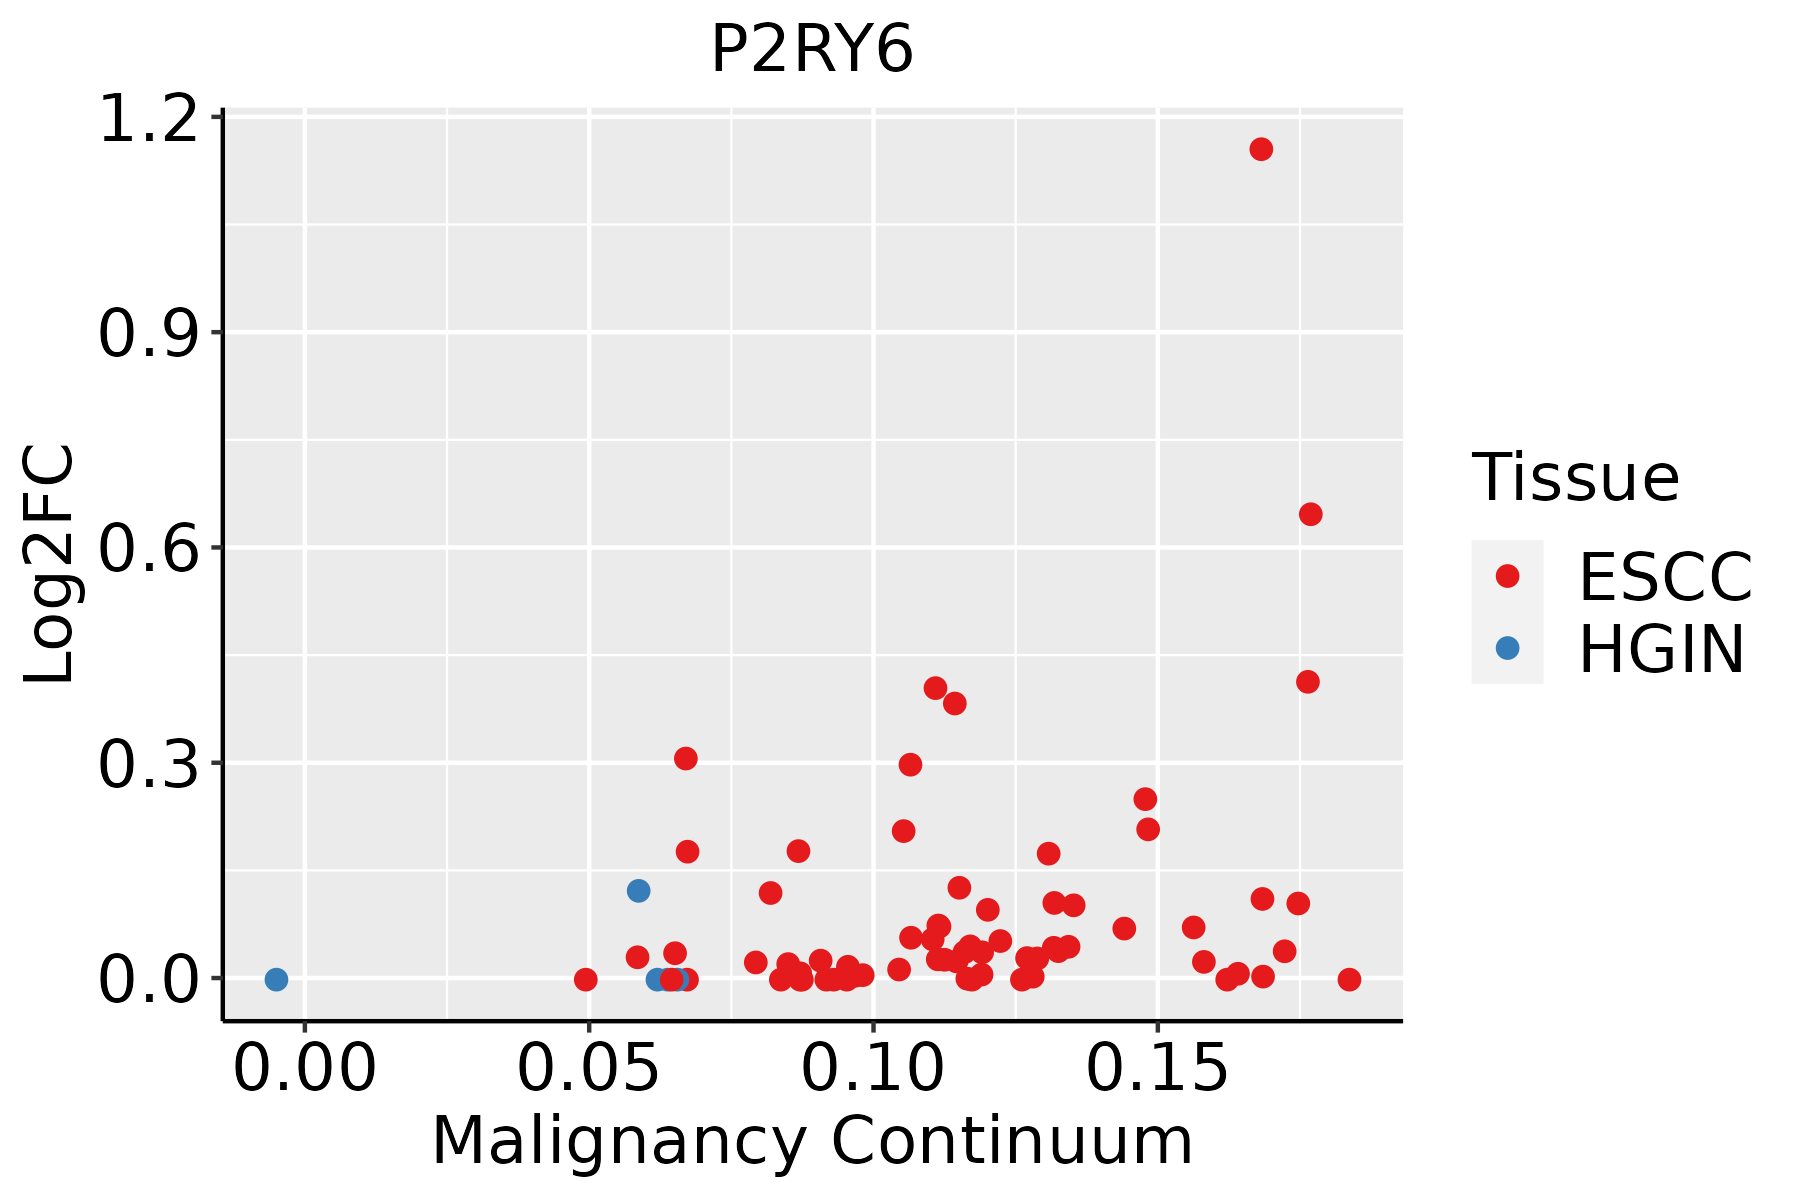 | ESCC: Esophageal squamous cell carcinoma |
| HGIN: High-grade intraepithelial neoplasias | ||
| LGIN: Low-grade intraepithelial neoplasias | ||
| Oral Cavity |  | EOLP: Erosive Oral lichen planus |
| LP: leukoplakia | ||
| NEOLP: Non-erosive oral lichen planus | ||
| OSCC: Oral squamous cell carcinoma |
| ∗log2FC in expression of this searched gene in stem-like cells from each diseased tissue sample relative to stem-like cells in normal samples in each tissue plotted against the malignancy continuum. Samples are colored based on if they are from different disease stage. |
Top |
Malignant transformation related pathway analysis |
| Find out the enriched GO biological processes and KEGG pathways involved in transition from healthy to precancer to cancer |
| Tissue | Disease Stage | Enriched GO biological Processes |
| Colorectum | AD |  |
| Colorectum | SER |  |
| Colorectum | MSS |  |
| Colorectum | MSI-H |  |
| Colorectum | FAP |  |
| ∗Top 15 enriched GO BP terms are showed in the bar plot of each disease state in each tissue. Each row represents a significant GO biological process which is colored according to the -log10(p.adjust). |
| Page: 1 2 3 4 5 6 7 8 9 |
| GO ID | Tissue | Disease Stage | Description | Gene Ratio | Bg Ratio | pvalue | p.adjust | Count |
| GO:0051235110 | Esophagus | ESCC | maintenance of location | 200/8552 | 327/18723 | 1.01e-08 | 2.02e-07 | 200 |
| GO:00060668 | Esophagus | ESCC | alcohol metabolic process | 202/8552 | 353/18723 | 7.32e-06 | 7.26e-05 | 202 |
| GO:1901654111 | Esophagus | ESCC | response to ketone | 118/8552 | 194/18723 | 1.45e-05 | 1.31e-04 | 118 |
| GO:0051651111 | Esophagus | ESCC | maintenance of location in cell | 126/8552 | 214/18723 | 6.57e-05 | 5.00e-04 | 126 |
| GO:00442626 | Esophagus | ESCC | cellular carbohydrate metabolic process | 160/8552 | 283/18723 | 1.43e-04 | 9.66e-04 | 160 |
| GO:00160514 | Esophagus | ESCC | carbohydrate biosynthetic process | 117/8552 | 202/18723 | 2.96e-04 | 1.79e-03 | 117 |
| GO:00620129 | Esophagus | ESCC | regulation of small molecule metabolic process | 184/8552 | 334/18723 | 3.11e-04 | 1.85e-03 | 184 |
| GO:00461653 | Esophagus | ESCC | alcohol biosynthetic process | 83/8552 | 140/18723 | 8.04e-04 | 4.16e-03 | 83 |
| GO:19016556 | Esophagus | ESCC | cellular response to ketone | 59/8552 | 96/18723 | 1.32e-03 | 6.30e-03 | 59 |
| GO:00061096 | Esophagus | ESCC | regulation of carbohydrate metabolic process | 101/8552 | 178/18723 | 1.89e-03 | 8.52e-03 | 101 |
| GO:0097305111 | Esophagus | ESCC | response to alcohol | 138/8552 | 253/18723 | 2.70e-03 | 1.14e-02 | 138 |
| GO:00486597 | Esophagus | ESCC | smooth muscle cell proliferation | 103/8552 | 184/18723 | 3.08e-03 | 1.28e-02 | 103 |
| GO:00106755 | Esophagus | ESCC | regulation of cellular carbohydrate metabolic process | 83/8552 | 146/18723 | 4.24e-03 | 1.69e-02 | 83 |
| GO:00486607 | Esophagus | ESCC | regulation of smooth muscle cell proliferation | 100/8552 | 180/18723 | 4.76e-03 | 1.85e-02 | 100 |
| GO:00330025 | Esophagus | ESCC | muscle cell proliferation | 134/8552 | 248/18723 | 4.80e-03 | 1.86e-02 | 134 |
| GO:00486615 | Esophagus | ESCC | positive regulation of smooth muscle cell proliferation | 61/8552 | 104/18723 | 5.22e-03 | 1.97e-02 | 61 |
| GO:19016174 | Esophagus | ESCC | organic hydroxy compound biosynthetic process | 128/8552 | 237/18723 | 5.86e-03 | 2.16e-02 | 128 |
| GO:005123518 | Oral cavity | OSCC | maintenance of location | 182/7305 | 327/18723 | 6.16e-10 | 1.58e-08 | 182 |
| GO:190165419 | Oral cavity | OSCC | response to ketone | 114/7305 | 194/18723 | 1.82e-08 | 3.60e-07 | 114 |
| GO:005165120 | Oral cavity | OSCC | maintenance of location in cell | 121/7305 | 214/18723 | 1.39e-07 | 2.32e-06 | 121 |
| Page: 1 2 3 |
| Pathway ID | Tissue | Disease Stage | Description | Gene Ratio | Bg Ratio | pvalue | p.adjust | qvalue | Count |
| Page: 1 |
Top |
Cell-cell communication analysis |
| Identification of potential cell-cell interactions between two cell types and their ligand-receptor pairs for different disease states |
| Ligand | Receptor | LRpair | Pathway | Tissue | Disease Stage |
| Page: 1 |
Top |
Single-cell gene regulatory network inference analysis |
| Find out the significant the regulons (TFs) and the target genes of each regulon across cell types for different disease states |
| TF | Cell Type | Tissue | Disease Stage | Target Gene | RSS | Regulon Activity |
| ∗The dot plots of a searched regulon are shown for all cell subpopulations in each disease state of each tissue based on the regulon specific score inferred using pySCENIC and by calculating the average expression. |
| Page: 1 |
Top |
Somatic mutation of malignant transformation related genes |
| Annotation of somatic variants for genes involved in malignant transformation |
| Hugo Symbol | Variant Class | Variant Classification | dbSNP RS | HGVSc | HGVSp | HGVSp Short | SWISSPROT | BIOTYPE | SIFT | PolyPhen | Tumor Sample Barcode | Tissue | Histology | Sex | Age | Stage | Therapy Types | Drugs | Outcome |
| P2RY6 | SNV | Missense_Mutation | c.619G>T | p.Ala207Ser | p.A207S | Q15077 | protein_coding | tolerated(0.08) | benign(0.185) | TCGA-A8-A07F-01 | Breast | breast invasive carcinoma | Female | >=65 | I/II | Hormone Therapy | tamoxiphen | SD | |
| P2RY6 | SNV | Missense_Mutation | rs779583331 | c.163N>T | p.Arg55Cys | p.R55C | Q15077 | protein_coding | tolerated(0.11) | probably_damaging(0.999) | TCGA-2W-A8YY-01 | Cervix | cervical & endocervical cancer | Female | <65 | I/II | Chemotherapy | cisplatin | CR |
| P2RY6 | SNV | Missense_Mutation | c.235C>A | p.Leu79Met | p.L79M | Q15077 | protein_coding | deleterious(0) | probably_damaging(0.999) | TCGA-AA-3710-01 | Colorectum | colon adenocarcinoma | Female | >=65 | I/II | Unknown | Unknown | SD | |
| P2RY6 | SNV | Missense_Mutation | rs193163379 | c.983N>A | p.Arg328His | p.R328H | Q15077 | protein_coding | tolerated_low_confidence(0.15) | benign(0) | TCGA-AZ-6598-01 | Colorectum | colon adenocarcinoma | Female | >=65 | I/II | Unknown | Unknown | SD |
| P2RY6 | SNV | Missense_Mutation | rs574690210 | c.298N>T | p.Arg100Cys | p.R100C | Q15077 | protein_coding | deleterious(0) | probably_damaging(0.971) | TCGA-AZ-6601-01 | Colorectum | colon adenocarcinoma | Male | >=65 | I/II | Unknown | Unknown | PD |
| P2RY6 | SNV | Missense_Mutation | novel | c.224N>G | p.Tyr75Cys | p.Y75C | Q15077 | protein_coding | deleterious(0) | probably_damaging(0.999) | TCGA-CA-6717-01 | Colorectum | colon adenocarcinoma | Male | <65 | I/II | Chemotherapy | oxaliplatin | CR |
| P2RY6 | SNV | Missense_Mutation | rs374484031 | c.451N>A | p.Val151Met | p.V151M | Q15077 | protein_coding | deleterious(0) | possibly_damaging(0.647) | TCGA-CM-5341-01 | Colorectum | colon adenocarcinoma | Female | >=65 | III/IV | Chemotherapy | fluorouracil | SD |
| P2RY6 | SNV | Missense_Mutation | rs773575254 | c.982C>T | p.Arg328Cys | p.R328C | Q15077 | protein_coding | deleterious_low_confidence(0) | benign(0) | TCGA-DM-A28E-01 | Colorectum | colon adenocarcinoma | Female | >=65 | I/II | Unknown | Unknown | SD |
| P2RY6 | insertion | In_Frame_Ins | novel | c.78_79insCTG | p.Leu29dup | p.L29dup | Q15077 | protein_coding | TCGA-A6-5665-01 | Colorectum | colon adenocarcinoma | Female | >=65 | I/II | Unknown | Unknown | PD | ||
| P2RY6 | SNV | Missense_Mutation | novel | c.841N>A | p.Ala281Thr | p.A281T | Q15077 | protein_coding | tolerated(0.09) | possibly_damaging(0.551) | TCGA-A5-A2K5-01 | Endometrium | uterine corpus endometrioid carcinoma | Female | >=65 | I/II | Unknown | Unknown | SD |
| Page: 1 2 3 4 5 |
Top |
Related drugs of malignant transformation related genes |
| Identification of chemicals and drugs interact with genes involved in malignant transfromation |
| (DGIdb 4.0) |
| Entrez ID | Symbol | Category | Interaction Types | Drug Claim Name | Drug Name | PMIDs |
| 5031 | P2RY6 | G PROTEIN COUPLED RECEPTOR, DRUGGABLE GENOME, ION CHANNEL | agonist | 135651589 | ||
| 5031 | P2RY6 | G PROTEIN COUPLED RECEPTOR, DRUGGABLE GENOME, ION CHANNEL | agonist | 135651403 | ||
| 5031 | P2RY6 | G PROTEIN COUPLED RECEPTOR, DRUGGABLE GENOME, ION CHANNEL | agonist | 135651408 | ||
| 5031 | P2RY6 | G PROTEIN COUPLED RECEPTOR, DRUGGABLE GENOME, ION CHANNEL | agonist | 135651592 | ||
| 5031 | P2RY6 | G PROTEIN COUPLED RECEPTOR, DRUGGABLE GENOME, ION CHANNEL | antagonist | 135650660 | ||
| 5031 | P2RY6 | G PROTEIN COUPLED RECEPTOR, DRUGGABLE GENOME, ION CHANNEL | MC-1 | |||
| 5031 | P2RY6 | G PROTEIN COUPLED RECEPTOR, DRUGGABLE GENOME, ION CHANNEL | agonist | 178102533 | ||
| 5031 | P2RY6 | G PROTEIN COUPLED RECEPTOR, DRUGGABLE GENOME, ION CHANNEL | agonist | 135651427 | ADENOSINE DIPHOSPHATE | |
| 5031 | P2RY6 | G PROTEIN COUPLED RECEPTOR, DRUGGABLE GENOME, ION CHANNEL | agonist | 135650401 | ||
| 5031 | P2RY6 | G PROTEIN COUPLED RECEPTOR, DRUGGABLE GENOME, ION CHANNEL | GC021109 |
| Page: 1 2 3 |

Copyright 2023-Present -The University of Texas Health Science Center at Houston |