
|
|||||
|
 | |
| |
| |
| |
| |
| |
|
Gene: P2RY1 |
Gene summary for P2RY1 |
| Gene information | Species | Human | Gene symbol | P2RY1 | Gene ID | 5028 |
| Gene name | purinergic receptor P2Y1 | |
| Gene Alias | P2Y1 | |
| Cytomap | 3q25.2 | |
| Gene Type | protein-coding | GO ID | GO:0000003 | UniProtAcc | P47900 |
Top |
Malignant transformation analysis |
| Identification of the aberrant gene expression in precancerous and cancerous lesions by comparing the gene expression of stem-like cells in diseased tissues with normal stem cells |
| Entrez ID | Symbol | Replicates | Species | Organ | Tissue | Adj P-value | Log2FC | Malignancy |
| 5028 | P2RY1 | LZE4T | Human | Esophagus | ESCC | 4.61e-10 | 1.86e-01 | 0.0811 |
| 5028 | P2RY1 | LZE20T | Human | Esophagus | ESCC | 2.88e-05 | 1.52e-01 | 0.0662 |
| 5028 | P2RY1 | LZE24T | Human | Esophagus | ESCC | 8.99e-05 | 9.39e-02 | 0.0596 |
| 5028 | P2RY1 | LZE21T | Human | Esophagus | ESCC | 6.39e-04 | 4.34e-01 | 0.0655 |
| 5028 | P2RY1 | P2T-E | Human | Esophagus | ESCC | 4.78e-04 | 1.02e-01 | 0.1177 |
| 5028 | P2RY1 | P4T-E | Human | Esophagus | ESCC | 4.34e-15 | 4.04e-01 | 0.1323 |
| 5028 | P2RY1 | P5T-E | Human | Esophagus | ESCC | 1.12e-16 | 3.15e-01 | 0.1327 |
| 5028 | P2RY1 | P9T-E | Human | Esophagus | ESCC | 1.57e-02 | 4.53e-02 | 0.1131 |
| 5028 | P2RY1 | P10T-E | Human | Esophagus | ESCC | 1.64e-21 | 2.59e-01 | 0.116 |
| 5028 | P2RY1 | P11T-E | Human | Esophagus | ESCC | 6.30e-03 | 2.10e-01 | 0.1426 |
| 5028 | P2RY1 | P12T-E | Human | Esophagus | ESCC | 1.08e-25 | 5.53e-01 | 0.1122 |
| 5028 | P2RY1 | P15T-E | Human | Esophagus | ESCC | 1.54e-11 | 2.18e-01 | 0.1149 |
| 5028 | P2RY1 | P16T-E | Human | Esophagus | ESCC | 2.70e-08 | 1.36e-01 | 0.1153 |
| 5028 | P2RY1 | P20T-E | Human | Esophagus | ESCC | 4.65e-18 | 4.08e-01 | 0.1124 |
| 5028 | P2RY1 | P22T-E | Human | Esophagus | ESCC | 1.62e-05 | 1.05e-01 | 0.1236 |
| 5028 | P2RY1 | P23T-E | Human | Esophagus | ESCC | 5.48e-16 | 3.70e-01 | 0.108 |
| 5028 | P2RY1 | P26T-E | Human | Esophagus | ESCC | 9.28e-21 | 4.52e-01 | 0.1276 |
| 5028 | P2RY1 | P27T-E | Human | Esophagus | ESCC | 3.37e-25 | 5.77e-01 | 0.1055 |
| 5028 | P2RY1 | P28T-E | Human | Esophagus | ESCC | 5.32e-08 | 1.15e-01 | 0.1149 |
| 5028 | P2RY1 | P30T-E | Human | Esophagus | ESCC | 6.37e-41 | 1.39e+00 | 0.137 |
| Page: 1 2 3 |
| Tissue | Expression Dynamics | Abbreviation |
| Esophagus | 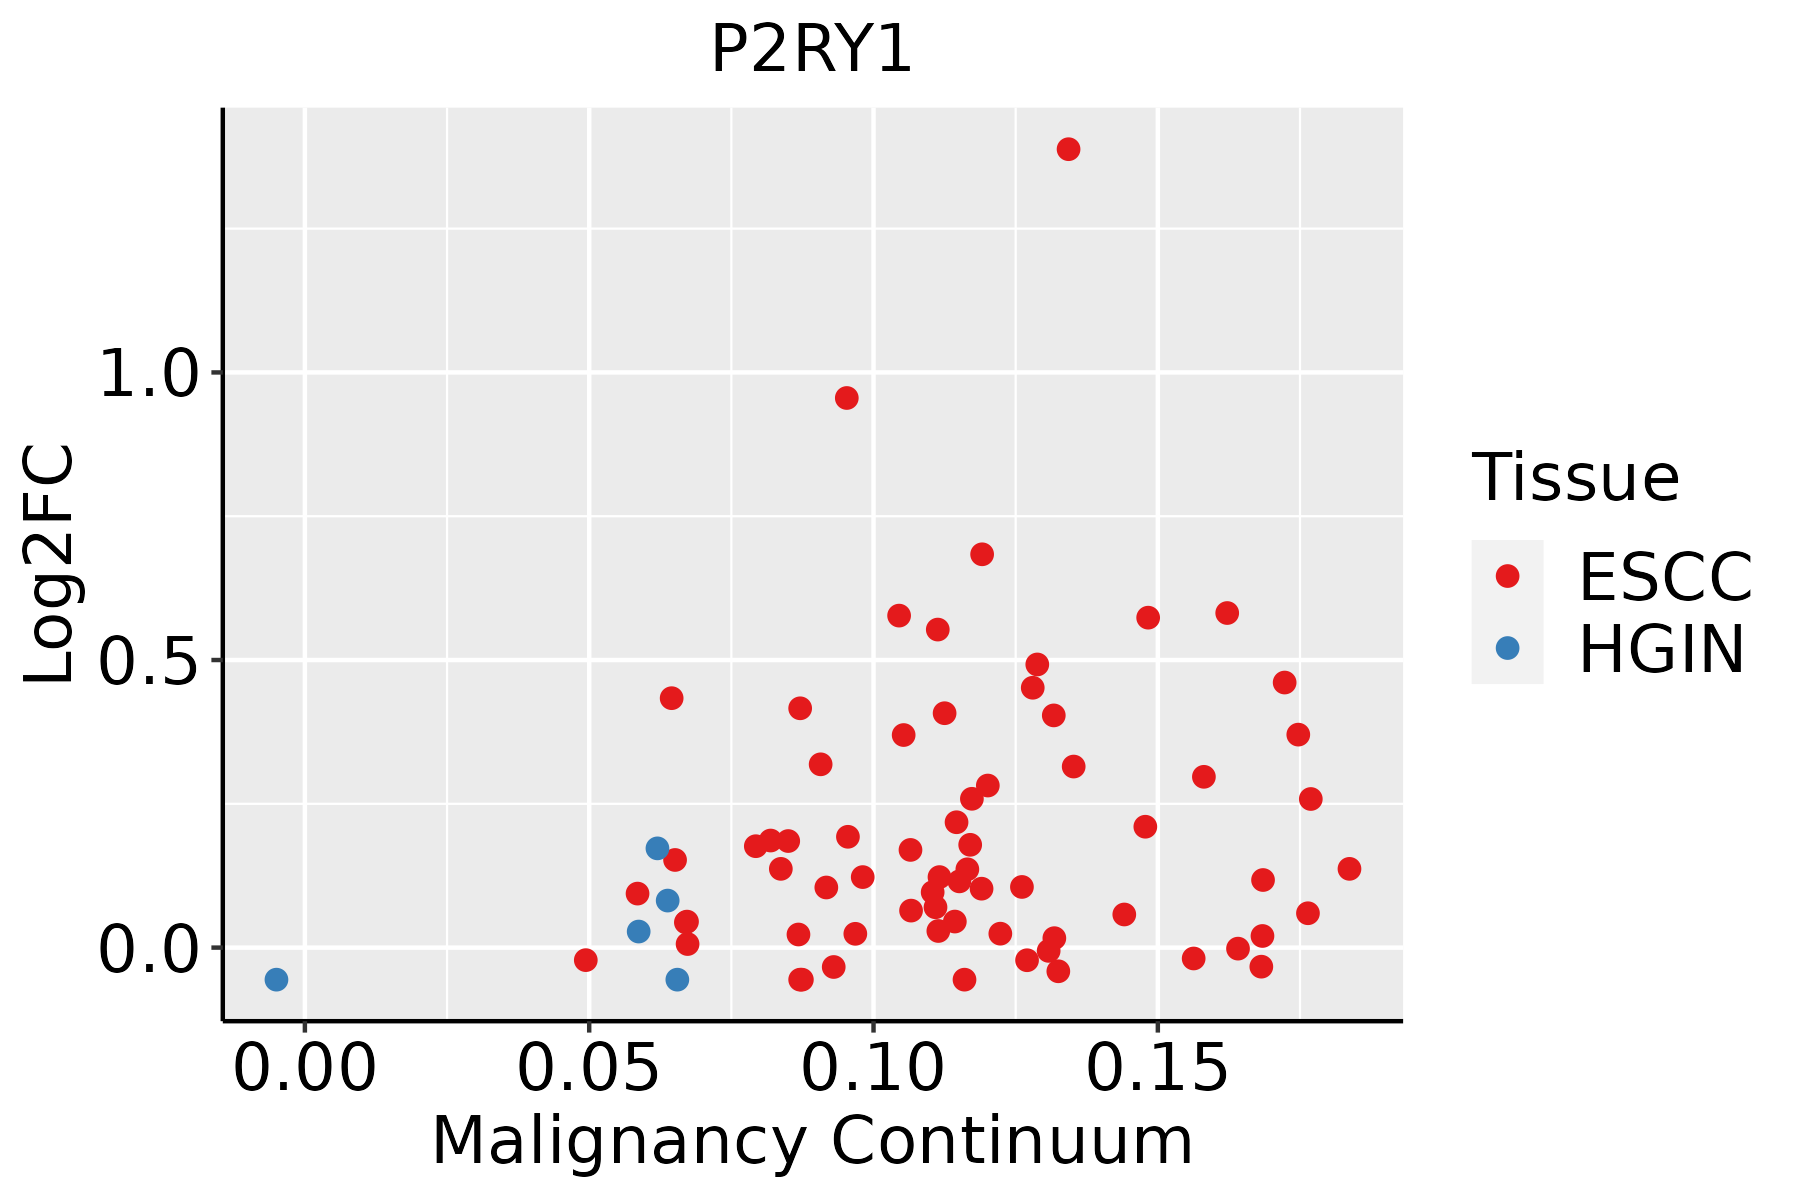 | ESCC: Esophageal squamous cell carcinoma |
| HGIN: High-grade intraepithelial neoplasias | ||
| LGIN: Low-grade intraepithelial neoplasias | ||
| Oral Cavity | 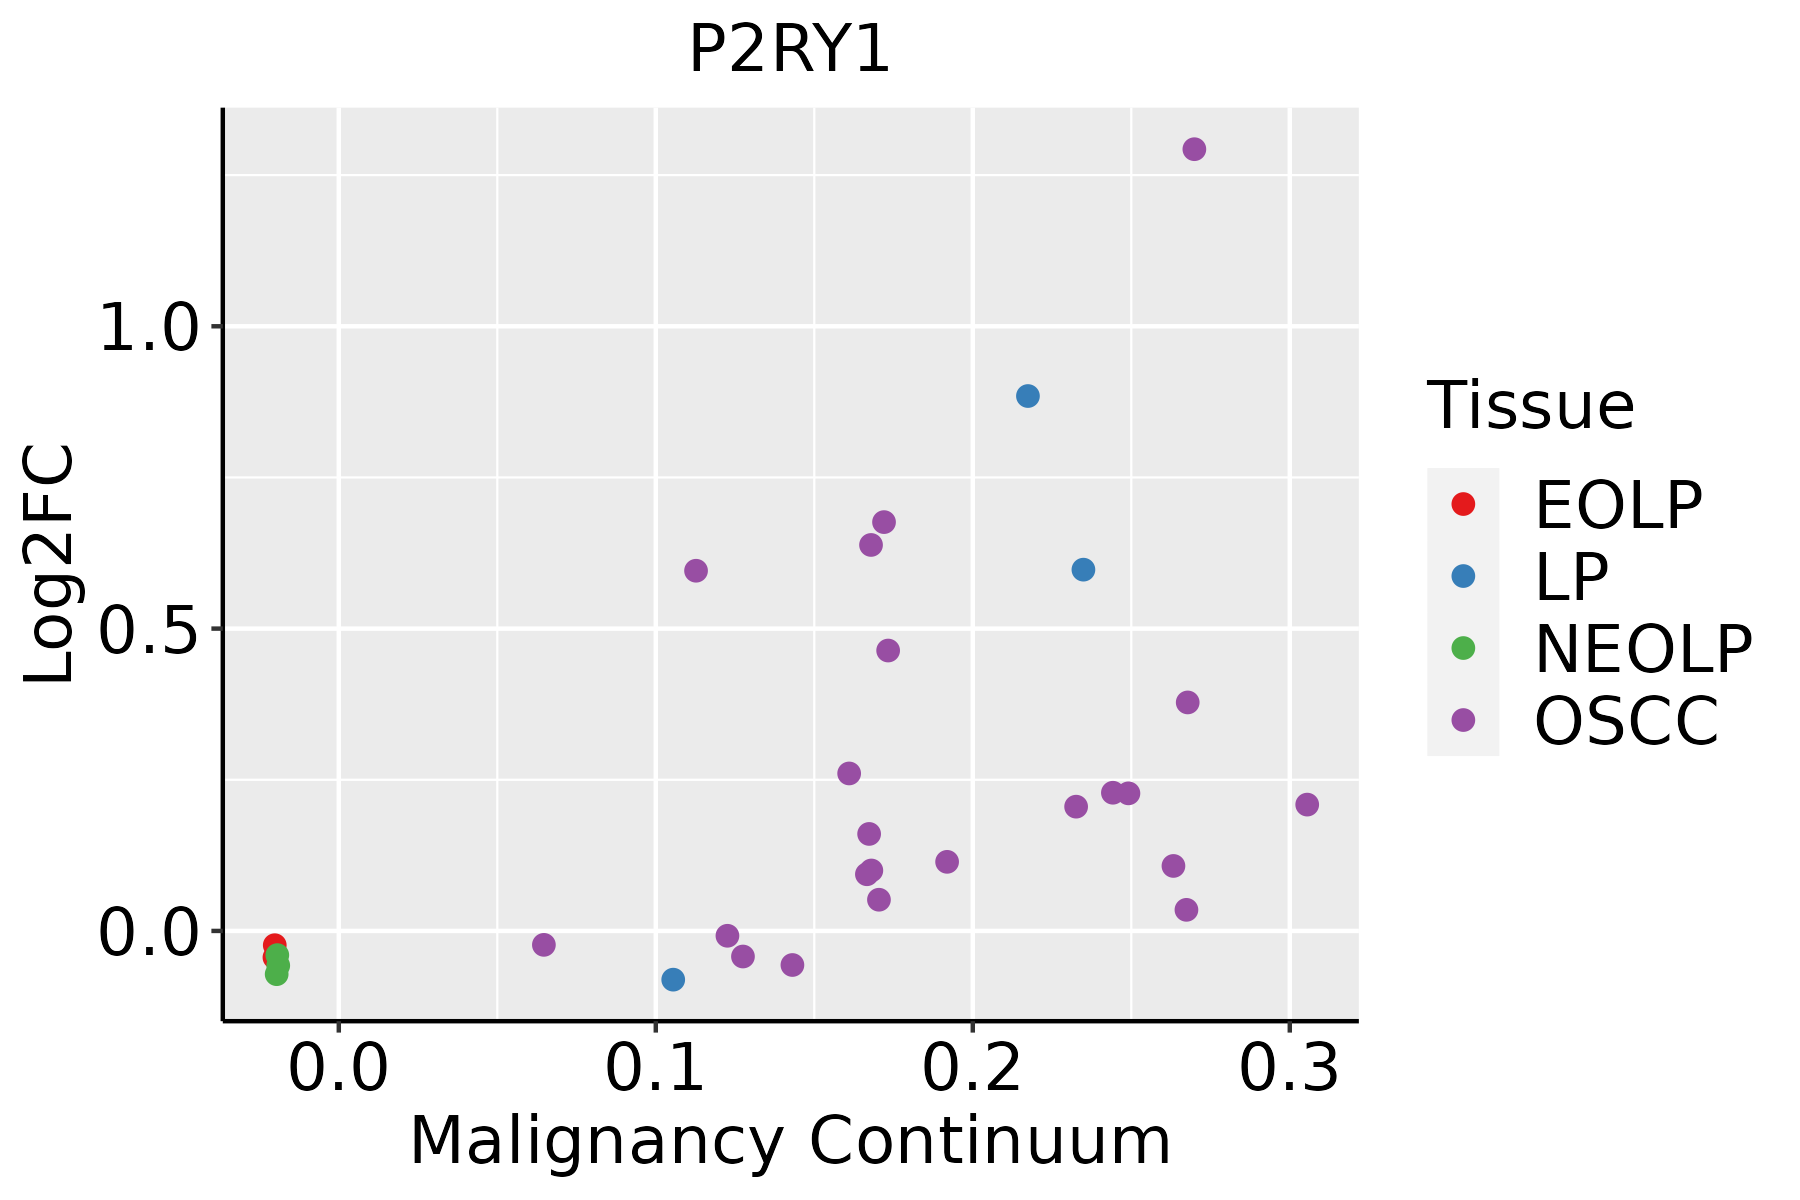 | EOLP: Erosive Oral lichen planus |
| LP: leukoplakia | ||
| NEOLP: Non-erosive oral lichen planus | ||
| OSCC: Oral squamous cell carcinoma |
| ∗log2FC in expression of this searched gene in stem-like cells from each diseased tissue sample relative to stem-like cells in normal samples in each tissue plotted against the malignancy continuum. Samples are colored based on if they are from different disease stage. |
Top |
Malignant transformation related pathway analysis |
| Find out the enriched GO biological processes and KEGG pathways involved in transition from healthy to precancer to cancer |
| Tissue | Disease Stage | Enriched GO biological Processes |
| Colorectum | AD |  |
| Colorectum | SER |  |
| Colorectum | MSS |  |
| Colorectum | MSI-H |  |
| Colorectum | FAP |  |
| ∗Top 15 enriched GO BP terms are showed in the bar plot of each disease state in each tissue. Each row represents a significant GO biological process which is colored according to the -log10(p.adjust). |
| Page: 1 2 3 4 5 6 7 8 9 |
| GO ID | Tissue | Disease Stage | Description | Gene Ratio | Bg Ratio | pvalue | p.adjust | Count |
| GO:0051098111 | Esophagus | ESCC | regulation of binding | 251/8552 | 363/18723 | 6.73e-20 | 8.46e-18 | 251 |
| GO:0072659110 | Esophagus | ESCC | protein localization to plasma membrane | 193/8552 | 284/18723 | 1.95e-14 | 1.03e-12 | 193 |
| GO:199077819 | Esophagus | ESCC | protein localization to cell periphery | 217/8552 | 333/18723 | 4.08e-13 | 1.88e-11 | 217 |
| GO:0051100111 | Esophagus | ESCC | negative regulation of binding | 109/8552 | 162/18723 | 2.10e-08 | 4.03e-07 | 109 |
| GO:000756820 | Esophagus | ESCC | aging | 201/8552 | 339/18723 | 2.64e-07 | 3.94e-06 | 201 |
| GO:004206027 | Esophagus | ESCC | wound healing | 243/8552 | 422/18723 | 4.62e-07 | 6.25e-06 | 243 |
| GO:002260420 | Esophagus | ESCC | regulation of cell morphogenesis | 180/8552 | 309/18723 | 5.19e-06 | 5.45e-05 | 180 |
| GO:00060668 | Esophagus | ESCC | alcohol metabolic process | 202/8552 | 353/18723 | 7.32e-06 | 7.26e-05 | 202 |
| GO:00420636 | Esophagus | ESCC | gliogenesis | 172/8552 | 301/18723 | 3.75e-05 | 3.04e-04 | 172 |
| GO:00442626 | Esophagus | ESCC | cellular carbohydrate metabolic process | 160/8552 | 283/18723 | 1.43e-04 | 9.66e-04 | 160 |
| GO:00160514 | Esophagus | ESCC | carbohydrate biosynthetic process | 117/8552 | 202/18723 | 2.96e-04 | 1.79e-03 | 117 |
| GO:000836018 | Esophagus | ESCC | regulation of cell shape | 92/8552 | 154/18723 | 3.00e-04 | 1.81e-03 | 92 |
| GO:00620129 | Esophagus | ESCC | regulation of small molecule metabolic process | 184/8552 | 334/18723 | 3.11e-04 | 1.85e-03 | 184 |
| GO:000961216 | Esophagus | ESCC | response to mechanical stimulus | 124/8552 | 216/18723 | 3.30e-04 | 1.94e-03 | 124 |
| GO:00461653 | Esophagus | ESCC | alcohol biosynthetic process | 83/8552 | 140/18723 | 8.04e-04 | 4.16e-03 | 83 |
| GO:00061096 | Esophagus | ESCC | regulation of carbohydrate metabolic process | 101/8552 | 178/18723 | 1.89e-03 | 8.52e-03 | 101 |
| GO:00106755 | Esophagus | ESCC | regulation of cellular carbohydrate metabolic process | 83/8552 | 146/18723 | 4.24e-03 | 1.69e-02 | 83 |
| GO:19016174 | Esophagus | ESCC | organic hydroxy compound biosynthetic process | 128/8552 | 237/18723 | 5.86e-03 | 2.16e-02 | 128 |
| GO:005109820 | Oral cavity | OSCC | regulation of binding | 212/7305 | 363/18723 | 3.88e-14 | 2.15e-12 | 212 |
| GO:004206020 | Oral cavity | OSCC | wound healing | 237/7305 | 422/18723 | 4.51e-13 | 2.18e-11 | 237 |
| Page: 1 2 3 |
| Pathway ID | Tissue | Disease Stage | Description | Gene Ratio | Bg Ratio | pvalue | p.adjust | qvalue | Count |
| hsa0401518 | Oral cavity | OSCC | Rap1 signaling pathway | 107/3704 | 210/8465 | 2.01e-02 | 4.34e-02 | 2.21e-02 | 107 |
| hsa0401519 | Oral cavity | OSCC | Rap1 signaling pathway | 107/3704 | 210/8465 | 2.01e-02 | 4.34e-02 | 2.21e-02 | 107 |
| Page: 1 |
Top |
Cell-cell communication analysis |
| Identification of potential cell-cell interactions between two cell types and their ligand-receptor pairs for different disease states |
| Ligand | Receptor | LRpair | Pathway | Tissue | Disease Stage |
| Page: 1 |
Top |
Single-cell gene regulatory network inference analysis |
| Find out the significant the regulons (TFs) and the target genes of each regulon across cell types for different disease states |
| TF | Cell Type | Tissue | Disease Stage | Target Gene | RSS | Regulon Activity |
| ∗The dot plots of a searched regulon are shown for all cell subpopulations in each disease state of each tissue based on the regulon specific score inferred using pySCENIC and by calculating the average expression. |
| Page: 1 |
Top |
Somatic mutation of malignant transformation related genes |
| Annotation of somatic variants for genes involved in malignant transformation |
| Hugo Symbol | Variant Class | Variant Classification | dbSNP RS | HGVSc | HGVSp | HGVSp Short | SWISSPROT | BIOTYPE | SIFT | PolyPhen | Tumor Sample Barcode | Tissue | Histology | Sex | Age | Stage | Therapy Types | Drugs | Outcome |
| P2RY1 | SNV | Missense_Mutation | c.773N>T | p.Ser258Leu | p.S258L | P47900 | protein_coding | deleterious(0) | probably_damaging(0.936) | TCGA-AR-A250-01 | Breast | breast invasive carcinoma | Female | <65 | I/II | Chemotherapy | doxorubicin | SD | |
| P2RY1 | SNV | Missense_Mutation | c.635N>A | p.Arg212Gln | p.R212Q | P47900 | protein_coding | tolerated(0.18) | possibly_damaging(0.687) | TCGA-B6-A0RO-01 | Breast | breast invasive carcinoma | Female | >=65 | III/IV | Unknown | Unknown | SD | |
| P2RY1 | SNV | Missense_Mutation | c.646N>T | p.Ile216Phe | p.I216F | P47900 | protein_coding | tolerated(0.7) | benign(0.23) | TCGA-BH-A0DK-01 | Breast | breast invasive carcinoma | Female | <65 | I/II | Hormone Therapy | tamoxiphen | SD | |
| P2RY1 | SNV | Missense_Mutation | c.779N>G | p.Tyr260Cys | p.Y260C | P47900 | protein_coding | deleterious(0) | possibly_damaging(0.873) | TCGA-BH-A18G-01 | Breast | breast invasive carcinoma | Female | >=65 | I/II | Unknown | Unknown | SD | |
| P2RY1 | SNV | Missense_Mutation | rs777279402 | c.1104N>G | p.Asn368Lys | p.N368K | P47900 | protein_coding | deleterious(0.01) | probably_damaging(0.968) | TCGA-C5-A1BI-01 | Cervix | cervical & endocervical cancer | Female | <65 | III/IV | Chemotherapy | cisplatin | SD |
| P2RY1 | SNV | Missense_Mutation | c.495N>C | p.Lys165Asn | p.K165N | P47900 | protein_coding | tolerated(0.59) | possibly_damaging(0.697) | TCGA-EK-A3GK-01 | Cervix | cervical & endocervical cancer | Female | <65 | I/II | Unknown | Unknown | SD | |
| P2RY1 | SNV | Missense_Mutation | c.662N>T | p.Thr221Met | p.T221M | P47900 | protein_coding | tolerated(0.59) | possibly_damaging(0.561) | TCGA-AA-3864-01 | Colorectum | colon adenocarcinoma | Male | >=65 | I/II | Unknown | Unknown | SD | |
| P2RY1 | SNV | Missense_Mutation | novel | c.427N>G | p.Thr143Ala | p.T143A | P47900 | protein_coding | tolerated(0.05) | benign(0.03) | TCGA-AA-3947-01 | Colorectum | colon adenocarcinoma | Female | <65 | I/II | Unknown | Unknown | SD |
| P2RY1 | SNV | Missense_Mutation | c.1066N>A | p.Asp356Asn | p.D356N | P47900 | protein_coding | tolerated(0.21) | benign(0.077) | TCGA-AZ-6601-01 | Colorectum | colon adenocarcinoma | Male | >=65 | I/II | Unknown | Unknown | PD | |
| P2RY1 | SNV | Missense_Mutation | c.797N>C | p.Leu266Pro | p.L266P | P47900 | protein_coding | deleterious(0) | probably_damaging(0.999) | TCGA-AG-3592-01 | Colorectum | rectum adenocarcinoma | Male | >=65 | I/II | Unknown | Unknown | SD |
| Page: 1 2 3 4 5 |
Top |
Related drugs of malignant transformation related genes |
| Identification of chemicals and drugs interact with genes involved in malignant transfromation |
| (DGIdb 4.0) |
| Entrez ID | Symbol | Category | Interaction Types | Drug Claim Name | Drug Name | PMIDs |
| 5028 | P2RY1 | DRUGGABLE GENOME, G PROTEIN COUPLED RECEPTOR, CELL SURFACE | antagonist | 135649697 | ||
| 5028 | P2RY1 | DRUGGABLE GENOME, G PROTEIN COUPLED RECEPTOR, CELL SURFACE | agonist | 252166657 | ||
| 5028 | P2RY1 | DRUGGABLE GENOME, G PROTEIN COUPLED RECEPTOR, CELL SURFACE | agonist | 135651401 | ||
| 5028 | P2RY1 | DRUGGABLE GENOME, G PROTEIN COUPLED RECEPTOR, CELL SURFACE | aspirin | ASPIRIN | 17559347,22940005,15757620 | |
| 5028 | P2RY1 | DRUGGABLE GENOME, G PROTEIN COUPLED RECEPTOR, CELL SURFACE | agonist | 135651428 | ||
| 5028 | P2RY1 | DRUGGABLE GENOME, G PROTEIN COUPLED RECEPTOR, CELL SURFACE | agonist | 135651389 | ||
| 5028 | P2RY1 | DRUGGABLE GENOME, G PROTEIN COUPLED RECEPTOR, CELL SURFACE | antagonist | 135651122 | ||
| 5028 | P2RY1 | DRUGGABLE GENOME, G PROTEIN COUPLED RECEPTOR, CELL SURFACE | antagonist | 178102429 | ||
| 5028 | P2RY1 | DRUGGABLE GENOME, G PROTEIN COUPLED RECEPTOR, CELL SURFACE | antagonist | 135650656 | ||
| 5028 | P2RY1 | DRUGGABLE GENOME, G PROTEIN COUPLED RECEPTOR, CELL SURFACE | agonist | 135651125 |
| Page: 1 2 3 4 |

Copyright 2023-Present -The University of Texas Health Science Center at Houston |