
|
|||||
|
 | |
| |
| |
| |
| |
| |
|
Gene: P2RX4 |
Gene summary for P2RX4 |
| Gene information | Species | Human | Gene symbol | P2RX4 | Gene ID | 5025 |
| Gene name | purinergic receptor P2X 4 | |
| Gene Alias | P2X4 | |
| Cytomap | 12q24.31 | |
| Gene Type | protein-coding | GO ID | GO:0001508 | UniProtAcc | Q99571 |
Top |
Malignant transformation analysis |
| Identification of the aberrant gene expression in precancerous and cancerous lesions by comparing the gene expression of stem-like cells in diseased tissues with normal stem cells |
| Entrez ID | Symbol | Replicates | Species | Organ | Tissue | Adj P-value | Log2FC | Malignancy |
| 5025 | P2RX4 | HTA11_347_2000001011 | Human | Colorectum | AD | 2.37e-05 | 4.13e-01 | -0.1954 |
| 5025 | P2RX4 | HTA11_696_2000001011 | Human | Colorectum | AD | 1.77e-03 | 3.64e-01 | -0.1464 |
| 5025 | P2RX4 | HTA11_866_2000001011 | Human | Colorectum | AD | 2.45e-05 | 4.15e-01 | -0.1001 |
| 5025 | P2RX4 | A015-C-203 | Human | Colorectum | FAP | 1.84e-02 | -3.08e-02 | -0.1294 |
| 5025 | P2RX4 | A002-C-205 | Human | Colorectum | FAP | 7.78e-03 | -2.84e-02 | -0.1236 |
| 5025 | P2RX4 | A015-C-006 | Human | Colorectum | FAP | 9.21e-03 | -1.82e-01 | -0.0994 |
| 5025 | P2RX4 | A002-C-114 | Human | Colorectum | FAP | 2.16e-03 | -1.61e-01 | -0.1561 |
| 5025 | P2RX4 | A015-C-104 | Human | Colorectum | FAP | 5.49e-04 | -6.73e-02 | -0.1899 |
| 5025 | P2RX4 | A002-C-016 | Human | Colorectum | FAP | 1.70e-05 | -1.83e-01 | 0.0521 |
| 5025 | P2RX4 | A002-C-116 | Human | Colorectum | FAP | 2.20e-05 | -1.66e-01 | -0.0452 |
| 5025 | P2RX4 | A018-E-020 | Human | Colorectum | FAP | 7.06e-03 | -1.26e-01 | -0.2034 |
| 5025 | P2RX4 | F034 | Human | Colorectum | FAP | 7.83e-04 | -1.72e-01 | -0.0665 |
| 5025 | P2RX4 | LZE4T | Human | Esophagus | ESCC | 9.03e-07 | 2.28e-01 | 0.0811 |
| 5025 | P2RX4 | LZE7T | Human | Esophagus | ESCC | 1.24e-02 | 1.98e-01 | 0.0667 |
| 5025 | P2RX4 | LZE24T | Human | Esophagus | ESCC | 1.76e-09 | 1.86e-01 | 0.0596 |
| 5025 | P2RX4 | LZE21T | Human | Esophagus | ESCC | 8.24e-04 | 1.97e-01 | 0.0655 |
| 5025 | P2RX4 | LZE6T | Human | Esophagus | ESCC | 7.11e-03 | 1.87e-01 | 0.0845 |
| 5025 | P2RX4 | P2T-E | Human | Esophagus | ESCC | 9.13e-52 | 7.03e-01 | 0.1177 |
| 5025 | P2RX4 | P4T-E | Human | Esophagus | ESCC | 2.33e-16 | 3.13e-01 | 0.1323 |
| 5025 | P2RX4 | P5T-E | Human | Esophagus | ESCC | 1.78e-10 | 1.61e-01 | 0.1327 |
| Page: 1 2 3 4 5 6 |
| Tissue | Expression Dynamics | Abbreviation |
| Colorectum (GSE201348) |  | FAP: Familial adenomatous polyposis |
| CRC: Colorectal cancer | ||
| Colorectum (HTA11) |  | AD: Adenomas |
| SER: Sessile serrated lesions | ||
| MSI-H: Microsatellite-high colorectal cancer | ||
| MSS: Microsatellite stable colorectal cancer | ||
| Esophagus | 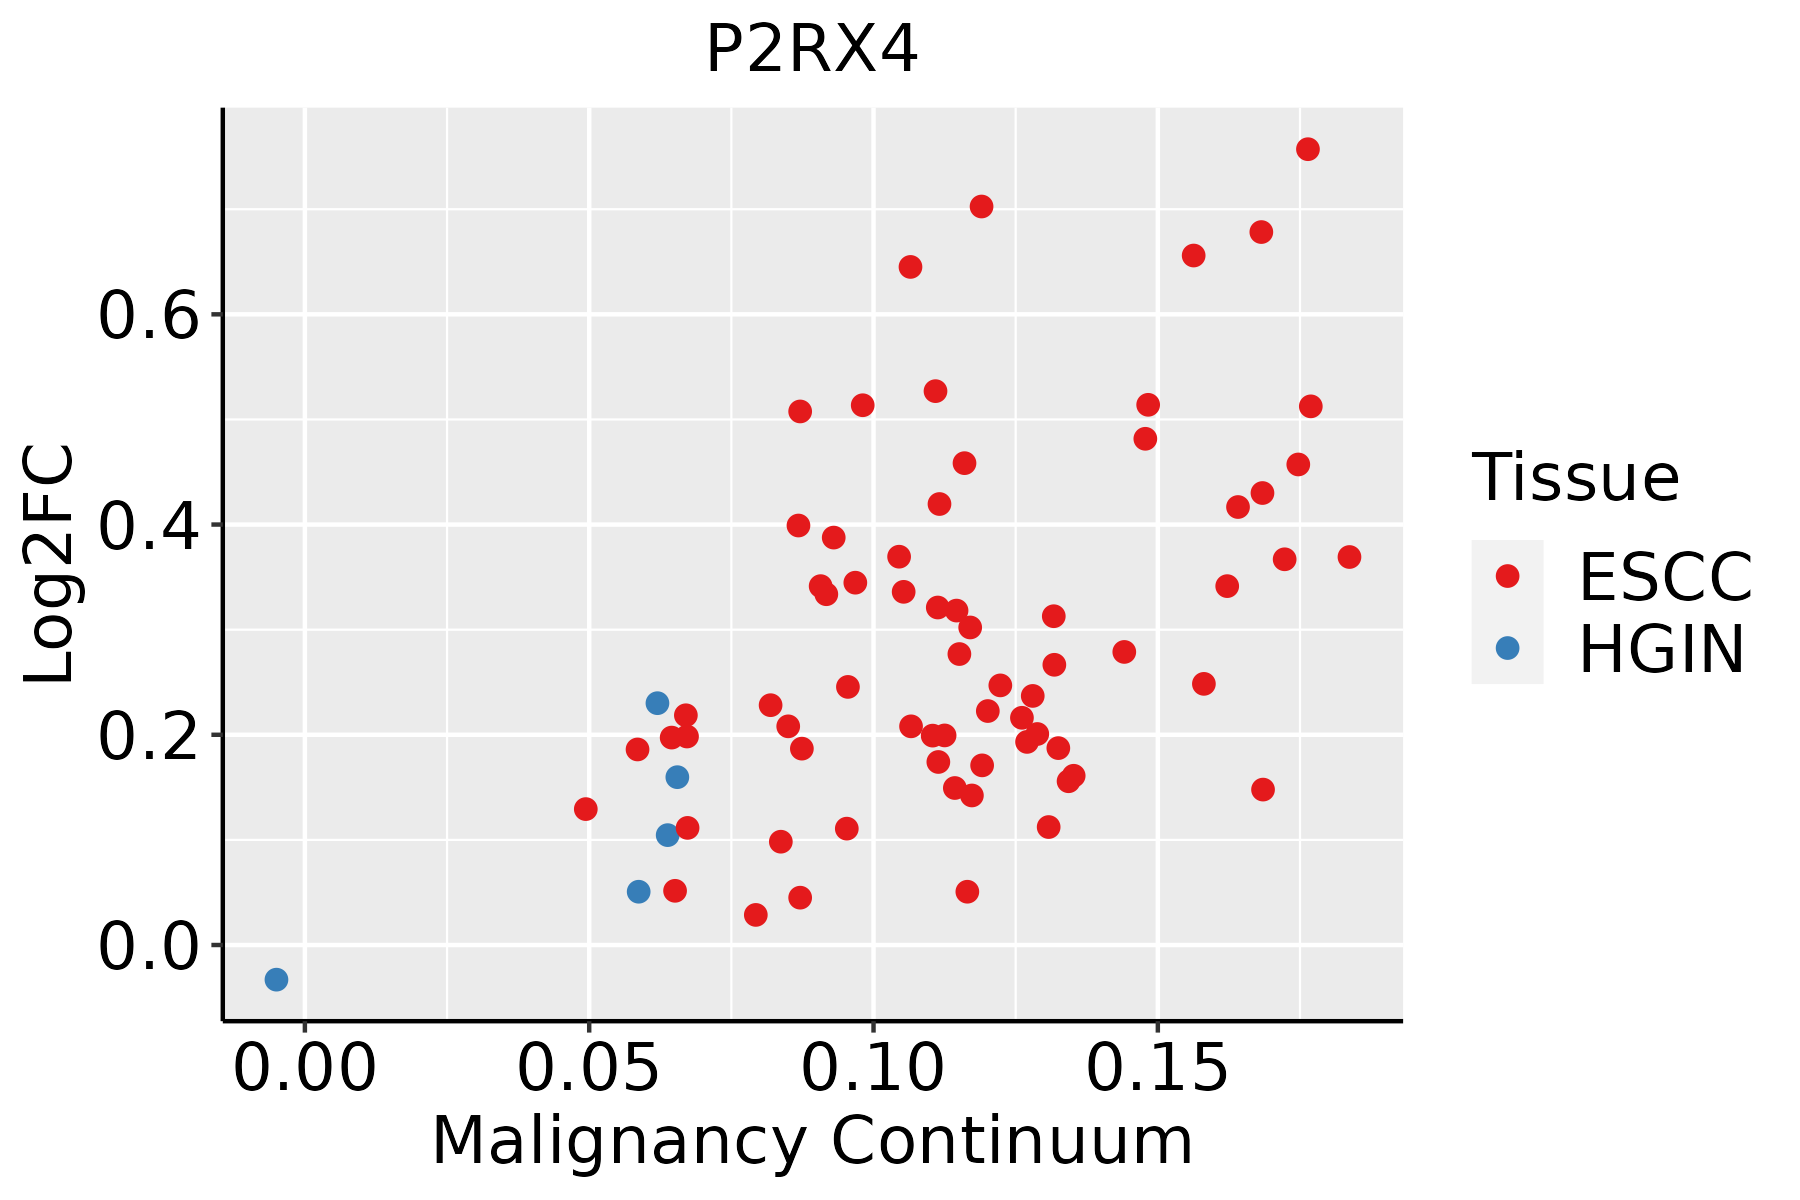 | ESCC: Esophageal squamous cell carcinoma |
| HGIN: High-grade intraepithelial neoplasias | ||
| LGIN: Low-grade intraepithelial neoplasias | ||
| Liver |  | HCC: Hepatocellular carcinoma |
| NAFLD: Non-alcoholic fatty liver disease | ||
| Oral Cavity |  | EOLP: Erosive Oral lichen planus |
| LP: leukoplakia | ||
| NEOLP: Non-erosive oral lichen planus | ||
| OSCC: Oral squamous cell carcinoma | ||
| Thyroid | 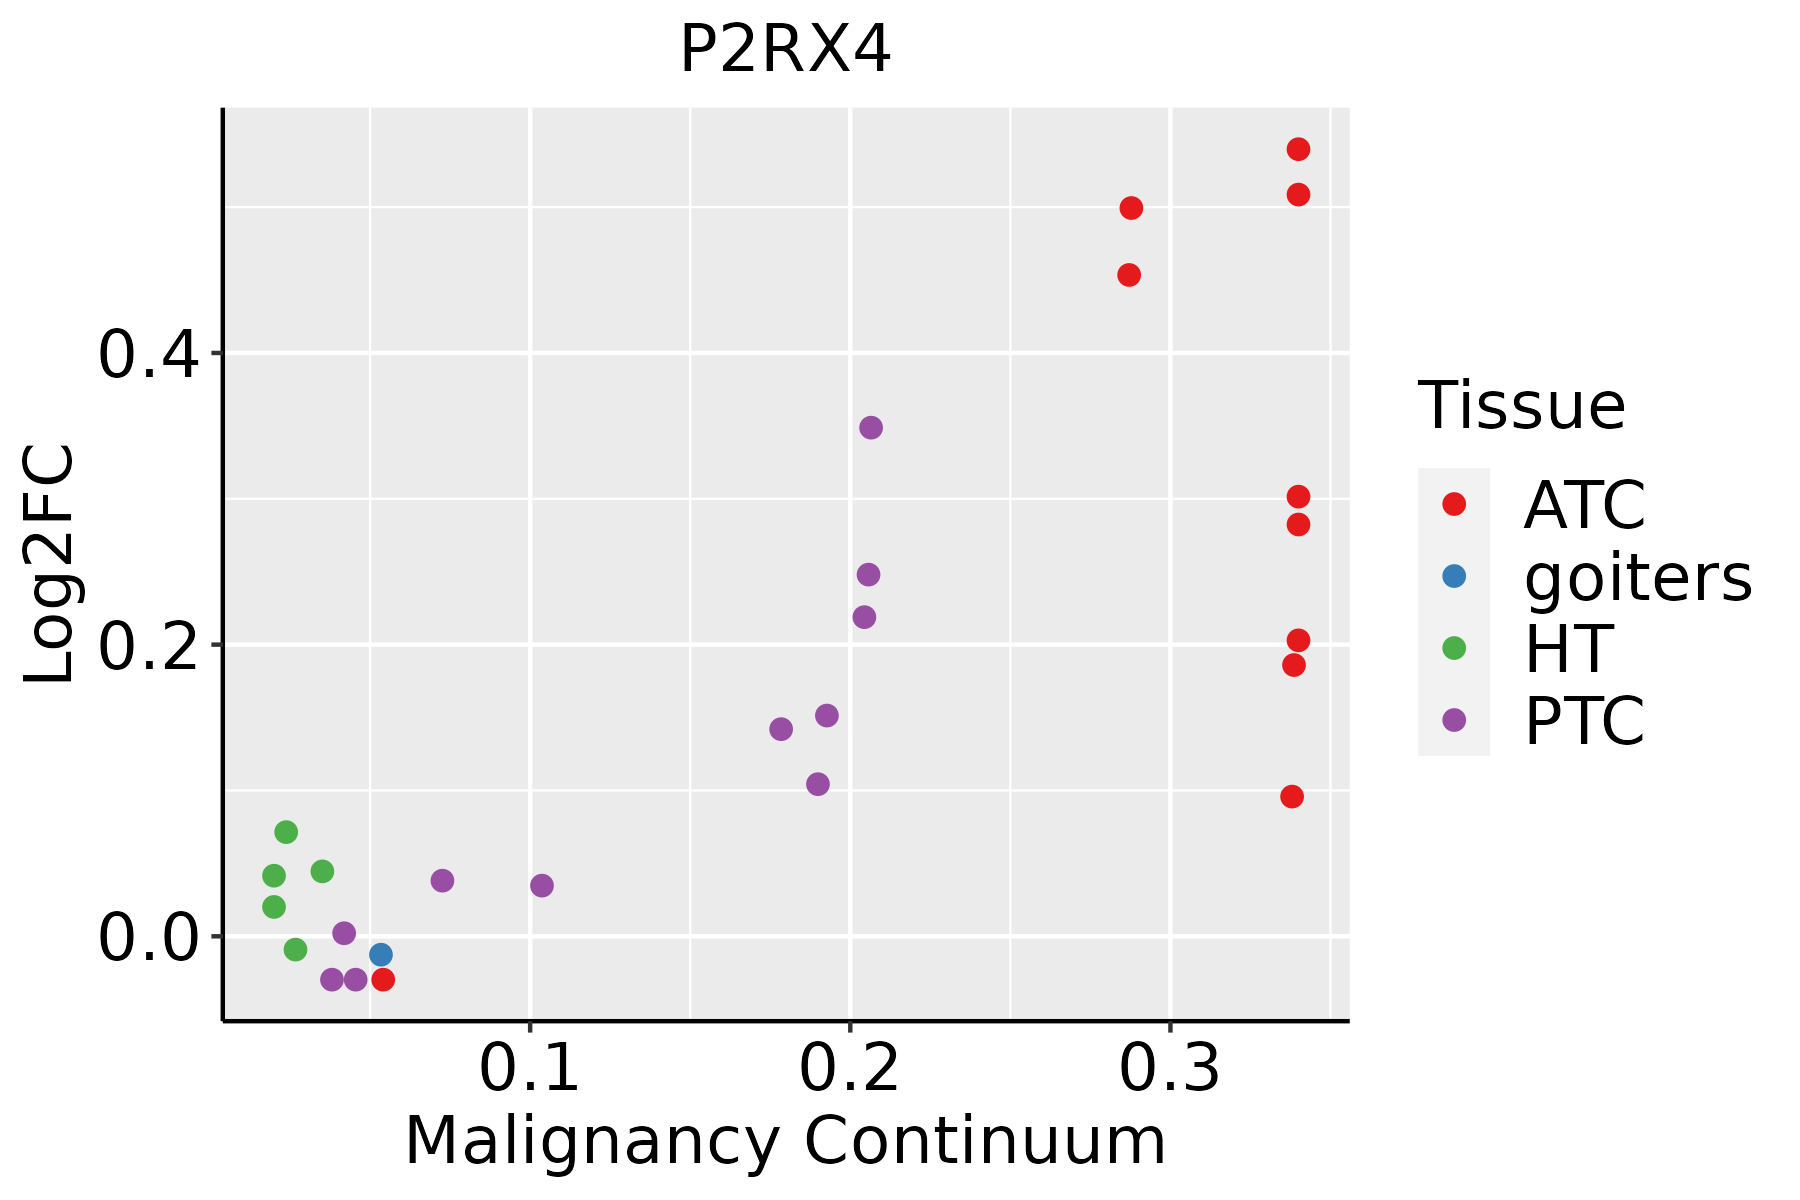 | ATC: Anaplastic thyroid cancer |
| HT: Hashimoto's thyroiditis | ||
| PTC: Papillary thyroid cancer |
| ∗log2FC in expression of this searched gene in stem-like cells from each diseased tissue sample relative to stem-like cells in normal samples in each tissue plotted against the malignancy continuum. Samples are colored based on if they are from different disease stage. |
Top |
Malignant transformation related pathway analysis |
| Find out the enriched GO biological processes and KEGG pathways involved in transition from healthy to precancer to cancer |
| Tissue | Disease Stage | Enriched GO biological Processes |
| Colorectum | AD |  |
| Colorectum | SER |  |
| Colorectum | MSS |  |
| Colorectum | MSI-H |  |
| Colorectum | FAP |  |
| ∗Top 15 enriched GO BP terms are showed in the bar plot of each disease state in each tissue. Each row represents a significant GO biological process which is colored according to the -log10(p.adjust). |
| Page: 1 2 3 4 5 6 7 8 9 |
| GO ID | Tissue | Disease Stage | Description | Gene Ratio | Bg Ratio | pvalue | p.adjust | Count |
| GO:0001667 | Colorectum | AD | ameboidal-type cell migration | 137/3918 | 475/18723 | 2.17e-05 | 4.33e-04 | 137 |
| GO:0002028 | Colorectum | AD | regulation of sodium ion transport | 36/3918 | 90/18723 | 2.89e-05 | 5.37e-04 | 36 |
| GO:0060249 | Colorectum | AD | anatomical structure homeostasis | 94/3918 | 314/18723 | 9.37e-05 | 1.42e-03 | 94 |
| GO:0090132 | Colorectum | AD | epithelium migration | 105/3918 | 360/18723 | 1.18e-04 | 1.73e-03 | 105 |
| GO:0010632 | Colorectum | AD | regulation of epithelial cell migration | 88/3918 | 292/18723 | 1.19e-04 | 1.75e-03 | 88 |
| GO:0010631 | Colorectum | AD | epithelial cell migration | 104/3918 | 357/18723 | 1.33e-04 | 1.90e-03 | 104 |
| GO:0006809 | Colorectum | AD | nitric oxide biosynthetic process | 30/3918 | 76/18723 | 1.72e-04 | 2.33e-03 | 30 |
| GO:0001894 | Colorectum | AD | tissue homeostasis | 81/3918 | 268/18723 | 1.96e-04 | 2.62e-03 | 81 |
| GO:0090130 | Colorectum | AD | tissue migration | 105/3918 | 365/18723 | 2.10e-04 | 2.77e-03 | 105 |
| GO:0046209 | Colorectum | AD | nitric oxide metabolic process | 31/3918 | 81/18723 | 2.61e-04 | 3.25e-03 | 31 |
| GO:0010038 | Colorectum | AD | response to metal ion | 106/3918 | 373/18723 | 3.22e-04 | 3.83e-03 | 106 |
| GO:2001057 | Colorectum | AD | reactive nitrogen species metabolic process | 31/3918 | 82/18723 | 3.37e-04 | 3.94e-03 | 31 |
| GO:0051047 | Colorectum | AD | positive regulation of secretion | 90/3918 | 310/18723 | 4.11e-04 | 4.66e-03 | 90 |
| GO:0010634 | Colorectum | AD | positive regulation of epithelial cell migration | 56/3918 | 176/18723 | 4.51e-04 | 5.03e-03 | 56 |
| GO:0071248 | Colorectum | AD | cellular response to metal ion | 61/3918 | 197/18723 | 5.74e-04 | 6.09e-03 | 61 |
| GO:1903532 | Colorectum | AD | positive regulation of secretion by cell | 82/3918 | 282/18723 | 6.85e-04 | 7.00e-03 | 82 |
| GO:0071241 | Colorectum | AD | cellular response to inorganic substance | 68/3918 | 226/18723 | 6.98e-04 | 7.10e-03 | 68 |
| GO:0015732 | Colorectum | AD | prostaglandin transport | 10/3918 | 18/18723 | 1.31e-03 | 1.15e-02 | 10 |
| GO:0090257 | Colorectum | AD | regulation of muscle system process | 73/3918 | 252/18723 | 1.46e-03 | 1.24e-02 | 73 |
| GO:0010876 | Colorectum | AD | lipid localization | 120/3918 | 448/18723 | 1.59e-03 | 1.33e-02 | 120 |
| Page: 1 2 3 4 5 6 7 8 9 10 11 12 |
| Pathway ID | Tissue | Disease Stage | Description | Gene Ratio | Bg Ratio | pvalue | p.adjust | qvalue | Count |
| Page: 1 |
Top |
Cell-cell communication analysis |
| Identification of potential cell-cell interactions between two cell types and their ligand-receptor pairs for different disease states |
| Ligand | Receptor | LRpair | Pathway | Tissue | Disease Stage |
| Page: 1 |
Top |
Single-cell gene regulatory network inference analysis |
| Find out the significant the regulons (TFs) and the target genes of each regulon across cell types for different disease states |
| TF | Cell Type | Tissue | Disease Stage | Target Gene | RSS | Regulon Activity |
| ∗The dot plots of a searched regulon are shown for all cell subpopulations in each disease state of each tissue based on the regulon specific score inferred using pySCENIC and by calculating the average expression. |
| Page: 1 |
Top |
Somatic mutation of malignant transformation related genes |
| Annotation of somatic variants for genes involved in malignant transformation |
| Hugo Symbol | Variant Class | Variant Classification | dbSNP RS | HGVSc | HGVSp | HGVSp Short | SWISSPROT | BIOTYPE | SIFT | PolyPhen | Tumor Sample Barcode | Tissue | Histology | Sex | Age | Stage | Therapy Types | Drugs | Outcome |
| P2RX4 | SNV | Missense_Mutation | rs372429881 | c.967N>A | p.Glu323Lys | p.E323K | Q99571 | protein_coding | deleterious(0.03) | possibly_damaging(0.647) | TCGA-A8-A09G-01 | Breast | breast invasive carcinoma | Female | >=65 | III/IV | Unknown | Unknown | SD |
| P2RX4 | SNV | Missense_Mutation | rs759963161 | c.186G>T | p.Trp62Cys | p.W62C | Q99571 | protein_coding | deleterious(0) | probably_damaging(0.992) | TCGA-D8-A1XQ-01 | Breast | breast invasive carcinoma | Female | >=65 | I/II | Unknown | Unknown | SD |
| P2RX4 | insertion | Frame_Shift_Ins | novel | c.308_309insCGTCTCTACTAAAAATACAAAATTAGCCAGGCGTGTT | p.Asp104ValfsTer52 | p.D104Vfs*52 | Q99571 | protein_coding | TCGA-B6-A0IK-01 | Breast | breast invasive carcinoma | Female | <65 | III/IV | Unknown | Unknown | PD | ||
| P2RX4 | SNV | Missense_Mutation | rs772182699 | c.1151N>A | p.Arg384Gln | p.R384Q | Q99571 | protein_coding | deleterious(0.04) | benign(0.336) | TCGA-2W-A8YY-01 | Cervix | cervical & endocervical cancer | Female | <65 | I/II | Chemotherapy | cisplatin | CR |
| P2RX4 | SNV | Missense_Mutation | novel | c.1139N>A | p.Arg380Lys | p.R380K | Q99571 | protein_coding | tolerated(0.25) | benign(0) | TCGA-VS-A9UR-01 | Cervix | cervical & endocervical cancer | Female | <65 | I/II | Chemotherapy | cisplatin | PD |
| P2RX4 | SNV | Missense_Mutation | novel | c.943N>C | p.Tyr315His | p.Y315H | Q99571 | protein_coding | tolerated(0.1) | benign(0.399) | TCGA-AA-3815-01 | Colorectum | colon adenocarcinoma | Female | >=65 | I/II | Unknown | Unknown | SD |
| P2RX4 | SNV | Missense_Mutation | rs368547621 | c.1183N>A | p.Glu395Lys | p.E395K | Q99571 | protein_coding | tolerated(0.12) | benign(0.314) | TCGA-AA-3864-01 | Colorectum | colon adenocarcinoma | Male | >=65 | I/II | Unknown | Unknown | SD |
| P2RX4 | SNV | Missense_Mutation | c.715N>G | p.Thr239Ala | p.T239A | Q99571 | protein_coding | tolerated(0.1) | probably_damaging(0.915) | TCGA-AA-A010-01 | Colorectum | colon adenocarcinoma | Female | <65 | I/II | Chemotherapy | folinic | CR | |
| P2RX4 | SNV | Missense_Mutation | c.368T>C | p.Leu123Pro | p.L123P | Q99571 | protein_coding | deleterious(0.03) | possibly_damaging(0.723) | TCGA-AM-5821-01 | Colorectum | colon adenocarcinoma | Female | >=65 | I/II | Unknown | Unknown | SD | |
| P2RX4 | SNV | Missense_Mutation | rs566926483 | c.977N>T | p.Thr326Met | p.T326M | Q99571 | protein_coding | deleterious(0.01) | probably_damaging(0.992) | TCGA-WS-AB45-01 | Colorectum | colon adenocarcinoma | Female | <65 | I/II | Unknown | Unknown | SD |
| Page: 1 2 3 4 |
Top |
Related drugs of malignant transformation related genes |
| Identification of chemicals and drugs interact with genes involved in malignant transfromation |
| (DGIdb 4.0) |
| Entrez ID | Symbol | Category | Interaction Types | Drug Claim Name | Drug Name | PMIDs |
| 5025 | P2RX4 | ION CHANNEL, DRUGGABLE GENOME | P2X4 inhibitora | |||
| 5025 | P2RX4 | ION CHANNEL, DRUGGABLE GENOME | antagonist | 336446929 | ||
| 5025 | P2RX4 | ION CHANNEL, DRUGGABLE GENOME | antagonist | 336446927 | ||
| 5025 | P2RX4 | ION CHANNEL, DRUGGABLE GENOME | antagonist | 336446928 | ||
| 5025 | P2RX4 | ION CHANNEL, DRUGGABLE GENOME | antagonist | 178101492 | PAROXETINE | |
| 5025 | P2RX4 | ION CHANNEL, DRUGGABLE GENOME | agonist | 135651446 | ADENOSINE TRIPHOSPHATE | |
| 5025 | P2RX4 | ION CHANNEL, DRUGGABLE GENOME | agonist | 178100916 | ||
| 5025 | P2RX4 | ION CHANNEL, DRUGGABLE GENOME | antagonist | 135650843 |
| Page: 1 |

Copyright 2023-Present -The University of Texas Health Science Center at Houston |