
|
|||||
|
 | |
| |
| |
| |
| |
| |
|
Gene: OXTR |
Gene summary for OXTR |
| Gene information | Species | Human | Gene symbol | OXTR | Gene ID | 5021 |
| Gene name | oxytocin receptor | |
| Gene Alias | OT-R | |
| Cytomap | 3p25.3 | |
| Gene Type | protein-coding | GO ID | GO:0000003 | UniProtAcc | B2R9L7 |
Top |
Malignant transformation analysis |
| Identification of the aberrant gene expression in precancerous and cancerous lesions by comparing the gene expression of stem-like cells in diseased tissues with normal stem cells |
| Entrez ID | Symbol | Replicates | Species | Organ | Tissue | Adj P-value | Log2FC | Malignancy |
| 5021 | OXTR | ATC2 | Human | Thyroid | ATC | 3.34e-11 | 9.52e-01 | 0.34 |
| Page: 1 |
| Tissue | Expression Dynamics | Abbreviation |
| Thyroid | 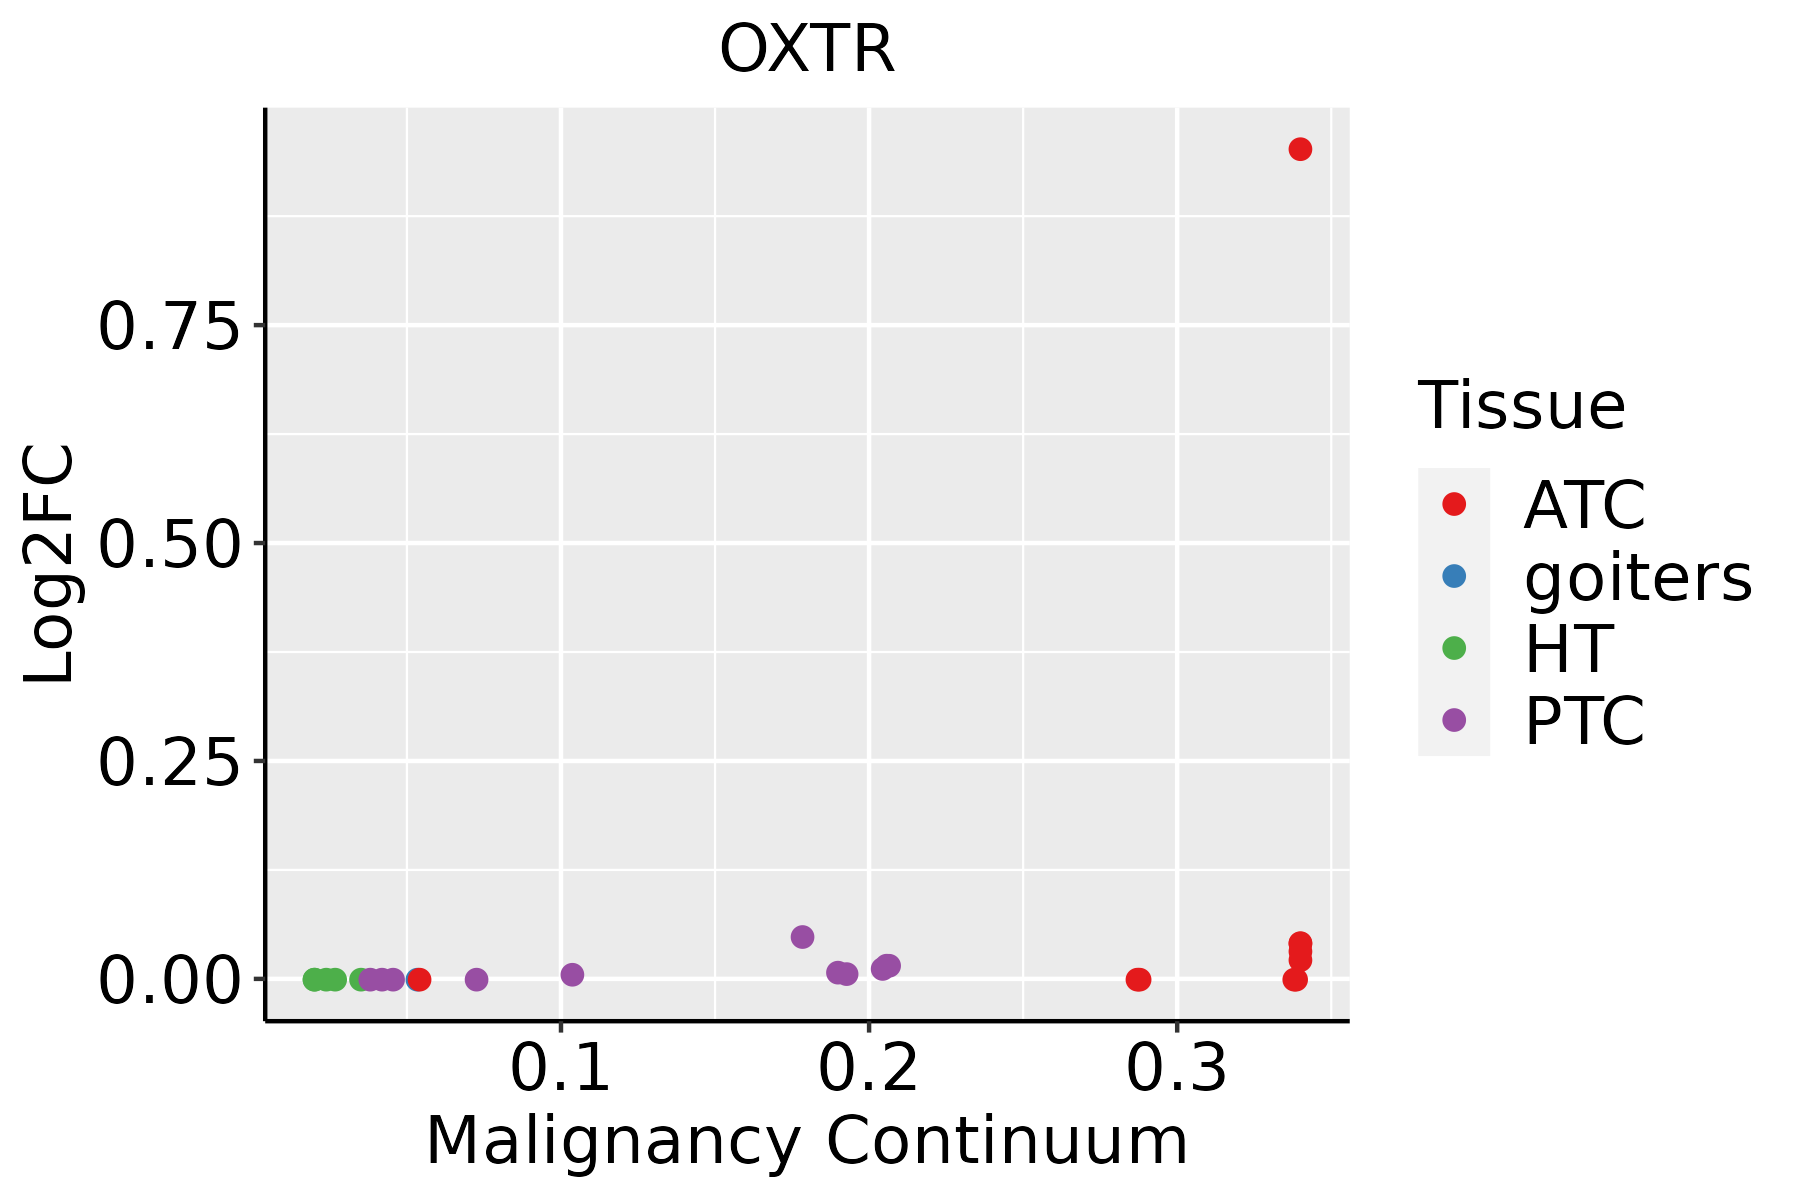 | ATC: Anaplastic thyroid cancer |
| HT: Hashimoto's thyroiditis | ||
| PTC: Papillary thyroid cancer |
| ∗log2FC in expression of this searched gene in stem-like cells from each diseased tissue sample relative to stem-like cells in normal samples in each tissue plotted against the malignancy continuum. Samples are colored based on if they are from different disease stage. |
Top |
Malignant transformation related pathway analysis |
| Find out the enriched GO biological processes and KEGG pathways involved in transition from healthy to precancer to cancer |
| Tissue | Disease Stage | Enriched GO biological Processes |
| Colorectum | AD |  |
| Colorectum | SER |  |
| Colorectum | MSS |  |
| Colorectum | MSI-H |  |
| Colorectum | FAP |  |
| ∗Top 15 enriched GO BP terms are showed in the bar plot of each disease state in each tissue. Each row represents a significant GO biological process which is colored according to the -log10(p.adjust). |
| Page: 1 2 3 4 5 6 7 8 9 |
| GO ID | Tissue | Disease Stage | Description | Gene Ratio | Bg Ratio | pvalue | p.adjust | Count |
| GO:007048228 | Thyroid | ATC | response to oxygen levels | 193/6293 | 347/18723 | 1.83e-17 | 1.93e-15 | 193 |
| GO:003629328 | Thyroid | ATC | response to decreased oxygen levels | 177/6293 | 322/18723 | 1.81e-15 | 1.32e-13 | 177 |
| GO:004873233 | Thyroid | ATC | gland development | 210/6293 | 436/18723 | 1.50e-10 | 4.59e-09 | 210 |
| GO:0048545210 | Thyroid | ATC | response to steroid hormone | 168/6293 | 339/18723 | 7.21e-10 | 1.88e-08 | 168 |
| GO:190165427 | Thyroid | ATC | response to ketone | 105/6293 | 194/18723 | 2.96e-09 | 6.96e-08 | 105 |
| GO:004343428 | Thyroid | ATC | response to peptide hormone | 192/6293 | 414/18723 | 3.63e-08 | 6.70e-07 | 192 |
| GO:004851124 | Thyroid | ATC | rhythmic process | 141/6293 | 298/18723 | 5.58e-07 | 7.93e-06 | 141 |
| GO:003432924 | Thyroid | ATC | cell junction assembly | 187/6293 | 420/18723 | 1.71e-06 | 2.08e-05 | 187 |
| GO:005196014 | Thyroid | ATC | regulation of nervous system development | 195/6293 | 443/18723 | 2.62e-06 | 3.06e-05 | 195 |
| GO:005196221 | Thyroid | ATC | positive regulation of nervous system development | 126/6293 | 272/18723 | 8.17e-06 | 8.27e-05 | 126 |
| GO:003235519 | Thyroid | ATC | response to estradiol | 72/6293 | 141/18723 | 1.35e-05 | 1.29e-04 | 72 |
| GO:003257018 | Thyroid | ATC | response to progesterone | 25/6293 | 37/18723 | 2.50e-05 | 2.16e-04 | 25 |
| GO:003090015 | Thyroid | ATC | forebrain development | 164/6293 | 379/18723 | 4.85e-05 | 3.87e-04 | 164 |
| GO:002153712 | Thyroid | ATC | telencephalon development | 113/6293 | 248/18723 | 5.61e-05 | 4.32e-04 | 113 |
| GO:190188818 | Thyroid | ATC | regulation of cell junction assembly | 94/6293 | 204/18723 | 1.38e-04 | 9.65e-04 | 94 |
| GO:010610621 | Thyroid | ATC | cold-induced thermogenesis | 68/6293 | 144/18723 | 4.70e-04 | 2.76e-03 | 68 |
| GO:012016121 | Thyroid | ATC | regulation of cold-induced thermogenesis | 68/6293 | 144/18723 | 4.70e-04 | 2.76e-03 | 68 |
| GO:199084521 | Thyroid | ATC | adaptive thermogenesis | 71/6293 | 157/18723 | 1.59e-03 | 7.99e-03 | 71 |
| GO:000941027 | Thyroid | ATC | response to xenobiotic stimulus | 184/6293 | 462/18723 | 2.70e-03 | 1.23e-02 | 184 |
| GO:003087917 | Thyroid | ATC | mammary gland development | 62/6293 | 137/18723 | 2.96e-03 | 1.34e-02 | 62 |
| Page: 1 2 |
| Pathway ID | Tissue | Disease Stage | Description | Gene Ratio | Bg Ratio | pvalue | p.adjust | qvalue | Count |
| Page: 1 |
Top |
Cell-cell communication analysis |
| Identification of potential cell-cell interactions between two cell types and their ligand-receptor pairs for different disease states |
| Ligand | Receptor | LRpair | Pathway | Tissue | Disease Stage |
| Page: 1 |
Top |
Single-cell gene regulatory network inference analysis |
| Find out the significant the regulons (TFs) and the target genes of each regulon across cell types for different disease states |
| TF | Cell Type | Tissue | Disease Stage | Target Gene | RSS | Regulon Activity |
| ∗The dot plots of a searched regulon are shown for all cell subpopulations in each disease state of each tissue based on the regulon specific score inferred using pySCENIC and by calculating the average expression. |
| Page: 1 |
Top |
Somatic mutation of malignant transformation related genes |
| Annotation of somatic variants for genes involved in malignant transformation |
| Hugo Symbol | Variant Class | Variant Classification | dbSNP RS | HGVSc | HGVSp | HGVSp Short | SWISSPROT | BIOTYPE | SIFT | PolyPhen | Tumor Sample Barcode | Tissue | Histology | Sex | Age | Stage | Therapy Types | Drugs | Outcome |
| OXTR | insertion | Frame_Shift_Ins | novel | c.749_750insA | p.Asp251ArgfsTer158 | p.D251Rfs*158 | P30559 | protein_coding | TCGA-AN-A04C-01 | Breast | breast invasive carcinoma | Female | <65 | I/II | Unknown | Unknown | SD | ||
| OXTR | insertion | Frame_Shift_Ins | novel | c.747_748insAGGGAGGAGAGCGCCCA | p.Gly250ArgfsTer33 | p.G250Rfs*33 | P30559 | protein_coding | TCGA-AN-A04C-01 | Breast | breast invasive carcinoma | Female | <65 | I/II | Unknown | Unknown | SD | ||
| OXTR | SNV | Missense_Mutation | novel | c.656N>A | p.Cys219Tyr | p.C219Y | P30559 | protein_coding | deleterious(0) | probably_damaging(0.993) | TCGA-C5-A2LZ-01 | Cervix | cervical & endocervical cancer | Female | >=65 | III/IV | Unknown | Unknown | PD |
| OXTR | SNV | Missense_Mutation | c.946N>T | p.Leu316Phe | p.L316F | P30559 | protein_coding | deleterious(0) | probably_damaging(0.996) | TCGA-FU-A3HZ-01 | Cervix | cervical & endocervical cancer | Female | <65 | I/II | Chemotherapy | cisplatin | CR | |
| OXTR | SNV | Missense_Mutation | rs769146293 | c.1127G>A | p.Arg376His | p.R376H | P30559 | protein_coding | tolerated(0.23) | benign(0) | TCGA-4N-A93T-01 | Colorectum | colon adenocarcinoma | Male | >=65 | III/IV | Chemotherapy | xeloda | SD |
| OXTR | SNV | Missense_Mutation | c.655N>G | p.Cys219Gly | p.C219G | P30559 | protein_coding | deleterious(0) | probably_damaging(0.995) | TCGA-AA-A01R-01 | Colorectum | colon adenocarcinoma | Male | <65 | III/IV | Chemotherapy | 5-fluorouracil | PD | |
| OXTR | SNV | Missense_Mutation | c.814N>T | p.Arg272Cys | p.R272C | P30559 | protein_coding | deleterious(0) | probably_damaging(0.999) | TCGA-AG-A002-01 | Colorectum | rectum adenocarcinoma | Male | <65 | I/II | Unknown | Unknown | SD | |
| OXTR | SNV | Missense_Mutation | novel | c.945N>T | p.Met315Ile | p.M315I | P30559 | protein_coding | deleterious(0.01) | possibly_damaging(0.719) | TCGA-AJ-A2QO-01 | Endometrium | uterine corpus endometrioid carcinoma | Female | >=65 | I/II | Unknown | Unknown | SD |
| OXTR | SNV | Missense_Mutation | novel | c.400N>C | p.Ser134Pro | p.S134P | P30559 | protein_coding | deleterious(0) | probably_damaging(0.985) | TCGA-AJ-A5DW-01 | Endometrium | uterine corpus endometrioid carcinoma | Female | <65 | I/II | Unknown | Unknown | SD |
| OXTR | SNV | Missense_Mutation | c.911N>T | p.Ala304Val | p.A304V | P30559 | protein_coding | tolerated(0.12) | possibly_damaging(0.745) | TCGA-AP-A051-01 | Endometrium | uterine corpus endometrioid carcinoma | Female | >=65 | I/II | Unknown | Unknown | SD |
| Page: 1 2 3 4 |
Top |
Related drugs of malignant transformation related genes |
| Identification of chemicals and drugs interact with genes involved in malignant transfromation |
| (DGIdb 4.0) |
| Entrez ID | Symbol | Category | Interaction Types | Drug Claim Name | Drug Name | PMIDs |
| 5021 | OXTR | DRUGGABLE GENOME, G PROTEIN COUPLED RECEPTOR | antagonist | 135650471 | ||
| 5021 | OXTR | DRUGGABLE GENOME, G PROTEIN COUPLED RECEPTOR | PROGESTERONE | PROGESTERONE | 12061859 | |
| 5021 | OXTR | DRUGGABLE GENOME, G PROTEIN COUPLED RECEPTOR | antagonist | 135650468 | ||
| 5021 | OXTR | DRUGGABLE GENOME, G PROTEIN COUPLED RECEPTOR | antagonist | 135650469 | ||
| 5021 | OXTR | DRUGGABLE GENOME, G PROTEIN COUPLED RECEPTOR | antagonist | 135650473 | ||
| 5021 | OXTR | DRUGGABLE GENOME, G PROTEIN COUPLED RECEPTOR | 178100609 | |||
| 5021 | OXTR | DRUGGABLE GENOME, G PROTEIN COUPLED RECEPTOR | agonist | CHEMBL3545167 | FE 202767 | |
| 5021 | OXTR | DRUGGABLE GENOME, G PROTEIN COUPLED RECEPTOR | Triazole derivative 6 | |||
| 5021 | OXTR | DRUGGABLE GENOME, G PROTEIN COUPLED RECEPTOR | OESTRADIOL | ESTRADIOL | 3033233 | |
| 5021 | OXTR | DRUGGABLE GENOME, G PROTEIN COUPLED RECEPTOR | antagonist | 135652101 |
| Page: 1 2 3 4 5 6 7 8 9 |

Copyright 2023-Present -The University of Texas Health Science Center at Houston |