
|
|||||
|
 | |
| |
| |
| |
| |
| |
|
Gene: OXNAD1 |
Gene summary for OXNAD1 |
| Gene information | Species | Human | Gene symbol | OXNAD1 | Gene ID | 92106 |
| Gene name | oxidoreductase NAD binding domain containing 1 | |
| Gene Alias | OXNAD1 | |
| Cytomap | 3p25.1-p24.3 | |
| Gene Type | protein-coding | GO ID | GO:0008150 | UniProtAcc | C9JLB7 |
Top |
Malignant transformation analysis |
| Identification of the aberrant gene expression in precancerous and cancerous lesions by comparing the gene expression of stem-like cells in diseased tissues with normal stem cells |
| Entrez ID | Symbol | Replicates | Species | Organ | Tissue | Adj P-value | Log2FC | Malignancy |
| 92106 | OXNAD1 | HTA11_3410_2000001011 | Human | Colorectum | AD | 9.56e-09 | -4.01e-01 | 0.0155 |
| 92106 | OXNAD1 | HTA11_2112_2000001011 | Human | Colorectum | SER | 3.38e-02 | -5.39e-01 | -0.2196 |
| 92106 | OXNAD1 | HTA11_696_2000001011 | Human | Colorectum | AD | 1.14e-04 | -3.04e-01 | -0.1464 |
| 92106 | OXNAD1 | HTA11_866_2000001011 | Human | Colorectum | AD | 3.91e-05 | -3.35e-01 | -0.1001 |
| 92106 | OXNAD1 | HTA11_546_2000001011 | Human | Colorectum | AD | 1.92e-04 | -5.04e-01 | -0.0842 |
| 92106 | OXNAD1 | HTA11_866_3004761011 | Human | Colorectum | AD | 9.36e-08 | -4.21e-01 | 0.096 |
| 92106 | OXNAD1 | HTA11_10711_2000001011 | Human | Colorectum | AD | 4.56e-03 | -3.95e-01 | 0.0338 |
| 92106 | OXNAD1 | HTA11_7696_3000711011 | Human | Colorectum | AD | 3.08e-10 | -4.14e-01 | 0.0674 |
| 92106 | OXNAD1 | HTA11_99999970781_79442 | Human | Colorectum | MSS | 2.13e-02 | -2.80e-01 | 0.294 |
| 92106 | OXNAD1 | HTA11_99999971662_82457 | Human | Colorectum | MSS | 2.43e-02 | -2.71e-01 | 0.3859 |
| 92106 | OXNAD1 | HTA11_99999973899_84307 | Human | Colorectum | MSS | 1.08e-02 | -4.44e-01 | 0.2585 |
| 92106 | OXNAD1 | HTA11_99999974143_84620 | Human | Colorectum | MSS | 3.73e-18 | -4.90e-01 | 0.3005 |
| 92106 | OXNAD1 | A001-C-207 | Human | Colorectum | FAP | 8.55e-04 | -2.43e-01 | 0.1278 |
| 92106 | OXNAD1 | A015-C-203 | Human | Colorectum | FAP | 7.78e-19 | -3.20e-01 | -0.1294 |
| 92106 | OXNAD1 | A015-C-204 | Human | Colorectum | FAP | 4.45e-08 | -3.44e-01 | -0.0228 |
| 92106 | OXNAD1 | A014-C-040 | Human | Colorectum | FAP | 3.60e-02 | -2.09e-01 | -0.1184 |
| 92106 | OXNAD1 | A002-C-201 | Human | Colorectum | FAP | 1.29e-13 | -3.17e-01 | 0.0324 |
| 92106 | OXNAD1 | A002-C-203 | Human | Colorectum | FAP | 1.85e-04 | -1.20e-01 | 0.2786 |
| 92106 | OXNAD1 | A001-C-119 | Human | Colorectum | FAP | 3.19e-08 | -4.14e-01 | -0.1557 |
| 92106 | OXNAD1 | A001-C-108 | Human | Colorectum | FAP | 7.08e-12 | -2.78e-01 | -0.0272 |
| Page: 1 2 |
| Tissue | Expression Dynamics | Abbreviation |
| Colorectum (GSE201348) |  | FAP: Familial adenomatous polyposis |
| CRC: Colorectal cancer | ||
| Colorectum (HTA11) | 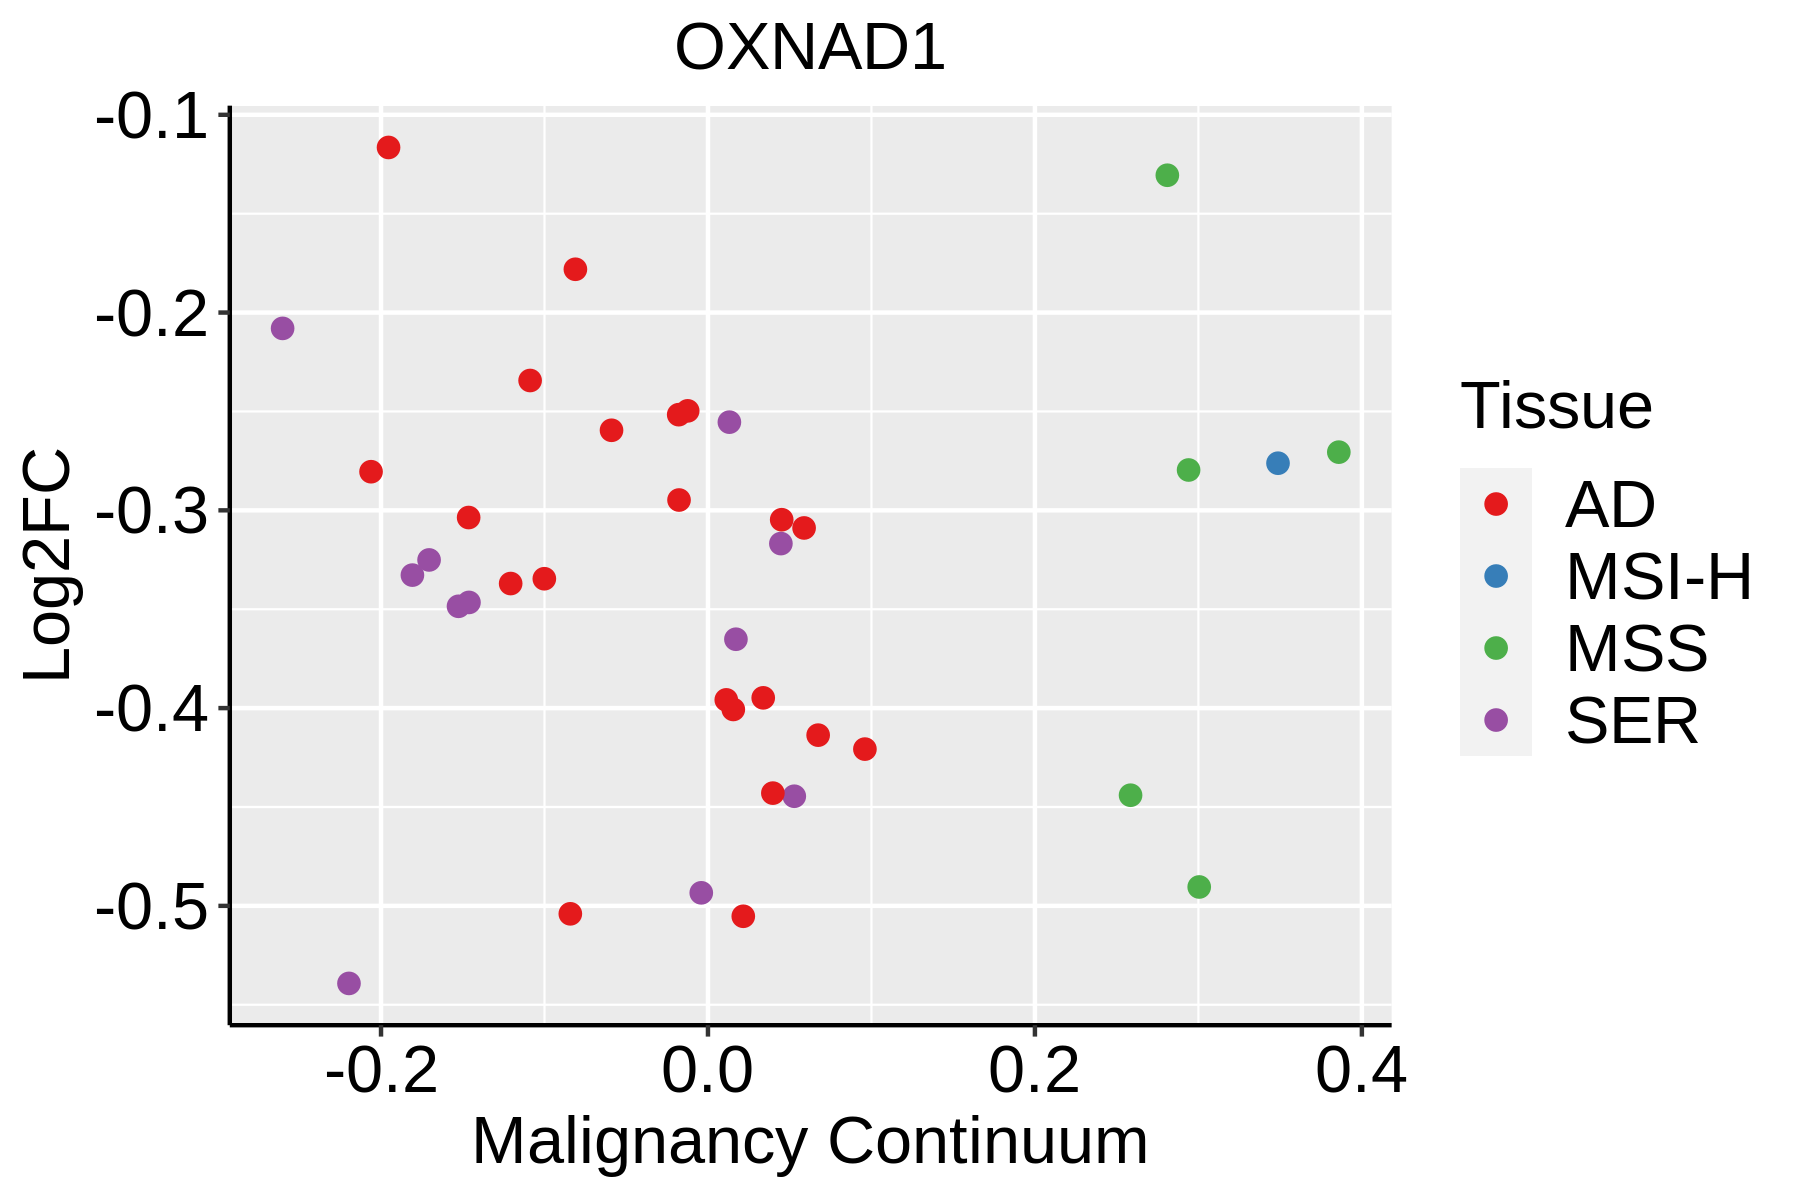 | AD: Adenomas |
| SER: Sessile serrated lesions | ||
| MSI-H: Microsatellite-high colorectal cancer | ||
| MSS: Microsatellite stable colorectal cancer | ||
| Liver | 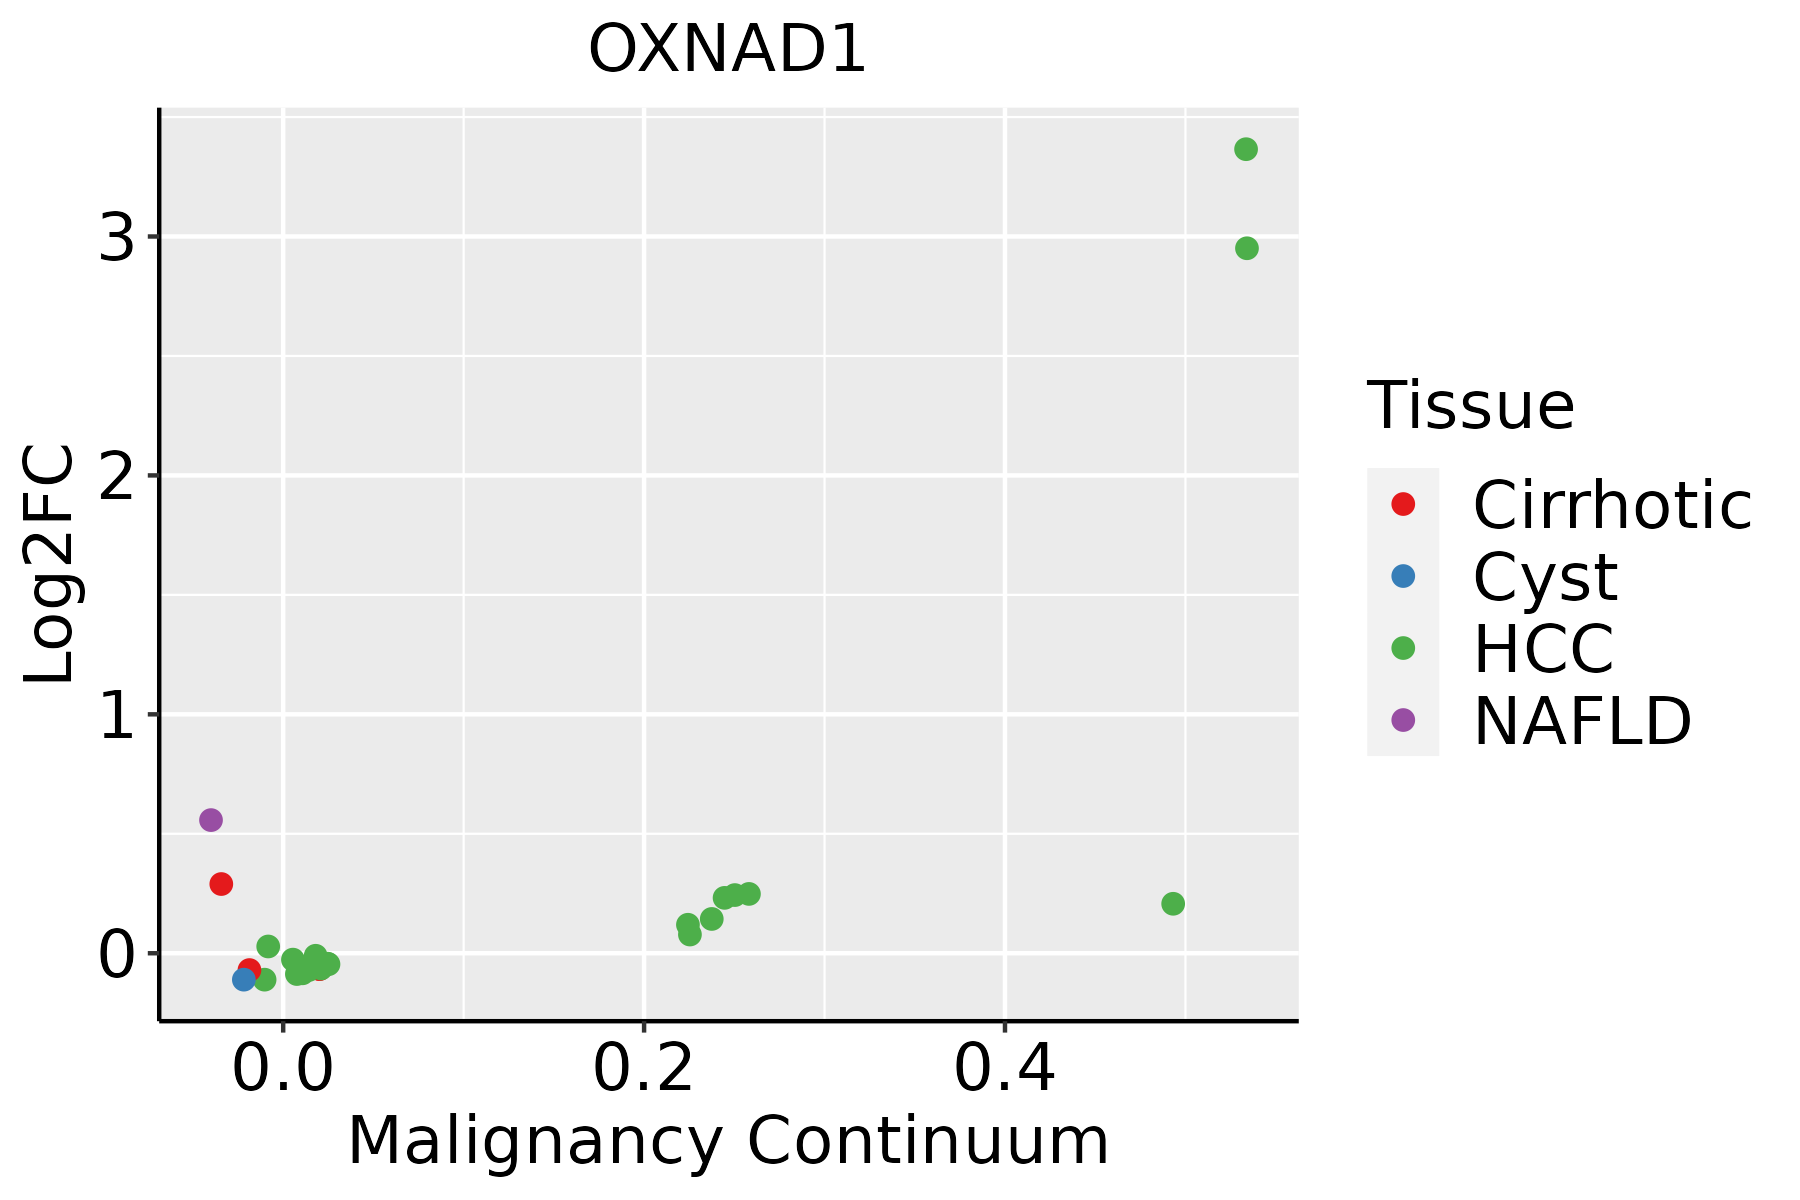 | HCC: Hepatocellular carcinoma |
| NAFLD: Non-alcoholic fatty liver disease |
| ∗log2FC in expression of this searched gene in stem-like cells from each diseased tissue sample relative to stem-like cells in normal samples in each tissue plotted against the malignancy continuum. Samples are colored based on if they are from different disease stage. |
Top |
Malignant transformation related pathway analysis |
| Find out the enriched GO biological processes and KEGG pathways involved in transition from healthy to precancer to cancer |
| Tissue | Disease Stage | Enriched GO biological Processes |
| Colorectum | AD |  |
| Colorectum | SER |  |
| Colorectum | MSS |  |
| Colorectum | MSI-H |  |
| Colorectum | FAP |  |
| ∗Top 15 enriched GO BP terms are showed in the bar plot of each disease state in each tissue. Each row represents a significant GO biological process which is colored according to the -log10(p.adjust). |
| Page: 1 2 3 4 5 6 7 8 9 |
| GO ID | Tissue | Disease Stage | Description | Gene Ratio | Bg Ratio | pvalue | p.adjust | Count |
| Page: 1 |
| Pathway ID | Tissue | Disease Stage | Description | Gene Ratio | Bg Ratio | pvalue | p.adjust | qvalue | Count |
| Page: 1 |
Top |
Cell-cell communication analysis |
| Identification of potential cell-cell interactions between two cell types and their ligand-receptor pairs for different disease states |
| Ligand | Receptor | LRpair | Pathway | Tissue | Disease Stage |
| Page: 1 |
Top |
Single-cell gene regulatory network inference analysis |
| Find out the significant the regulons (TFs) and the target genes of each regulon across cell types for different disease states |
| TF | Cell Type | Tissue | Disease Stage | Target Gene | RSS | Regulon Activity |
| ∗The dot plots of a searched regulon are shown for all cell subpopulations in each disease state of each tissue based on the regulon specific score inferred using pySCENIC and by calculating the average expression. |
| Page: 1 |
Top |
Somatic mutation of malignant transformation related genes |
| Annotation of somatic variants for genes involved in malignant transformation |
| Hugo Symbol | Variant Class | Variant Classification | dbSNP RS | HGVSc | HGVSp | HGVSp Short | SWISSPROT | BIOTYPE | SIFT | PolyPhen | Tumor Sample Barcode | Tissue | Histology | Sex | Age | Stage | Therapy Types | Drugs | Outcome |
| OXNAD1 | SNV | Missense_Mutation | c.616N>A | p.Glu206Lys | p.E206K | Q96HP4 | protein_coding | tolerated(0.88) | benign(0.003) | TCGA-AN-A0FV-01 | Breast | breast invasive carcinoma | Female | <65 | I/II | Unknown | Unknown | SD | |
| OXNAD1 | SNV | Missense_Mutation | rs539458658 | c.566G>A | p.Arg189Gln | p.R189Q | Q96HP4 | protein_coding | tolerated(0.18) | benign(0.013) | TCGA-2W-A8YY-01 | Cervix | cervical & endocervical cancer | Female | <65 | I/II | Chemotherapy | cisplatin | CR |
| OXNAD1 | SNV | Missense_Mutation | c.927N>T | p.Glu309Asp | p.E309D | Q96HP4 | protein_coding | deleterious(0) | probably_damaging(0.991) | TCGA-C5-A1M6-01 | Cervix | cervical & endocervical cancer | Female | <65 | I/II | Chemotherapy | cisplatin | PD | |
| OXNAD1 | SNV | Missense_Mutation | novel | c.131N>T | p.Ser44Phe | p.S44F | Q96HP4 | protein_coding | deleterious(0) | possibly_damaging(0.873) | TCGA-C5-A1MN-01 | Cervix | cervical & endocervical cancer | Female | <65 | III/IV | Chemotherapy | cisplatin | SD |
| OXNAD1 | SNV | Missense_Mutation | rs369133759 | c.178C>T | p.Arg60Trp | p.R60W | Q96HP4 | protein_coding | deleterious(0.03) | benign(0.425) | TCGA-AA-3950-01 | Colorectum | colon adenocarcinoma | Female | >=65 | I/II | Unknown | Unknown | SD |
| OXNAD1 | SNV | Missense_Mutation | novel | c.605N>T | p.Arg202Ile | p.R202I | Q96HP4 | protein_coding | deleterious(0.01) | benign(0.003) | TCGA-AA-3984-01 | Colorectum | colon adenocarcinoma | Female | <65 | I/II | Unknown | Unknown | SD |
| OXNAD1 | SNV | Missense_Mutation | c.661N>A | p.Glu221Lys | p.E221K | Q96HP4 | protein_coding | deleterious(0) | probably_damaging(0.999) | TCGA-AA-A00N-01 | Colorectum | colon adenocarcinoma | Male | >=65 | I/II | Unknown | Unknown | PD | |
| OXNAD1 | SNV | Missense_Mutation | c.334N>C | p.Ser112Pro | p.S112P | Q96HP4 | protein_coding | deleterious(0) | probably_damaging(0.973) | TCGA-AA-A01P-01 | Colorectum | colon adenocarcinoma | Female | >=65 | III/IV | Unknown | Unknown | PD | |
| OXNAD1 | SNV | Missense_Mutation | c.193N>A | p.Ala65Thr | p.A65T | Q96HP4 | protein_coding | tolerated(0.34) | benign(0) | TCGA-AD-6964-01 | Colorectum | colon adenocarcinoma | Male | <65 | III/IV | Chemotherapy | folfox | PD | |
| OXNAD1 | SNV | Missense_Mutation | c.661N>A | p.Glu221Lys | p.E221K | Q96HP4 | protein_coding | deleterious(0) | probably_damaging(0.999) | TCGA-CA-6717-01 | Colorectum | colon adenocarcinoma | Male | <65 | I/II | Chemotherapy | oxaliplatin | CR |
| Page: 1 2 3 4 5 |
Top |
Related drugs of malignant transformation related genes |
| Identification of chemicals and drugs interact with genes involved in malignant transfromation |
| (DGIdb 4.0) |
| Entrez ID | Symbol | Category | Interaction Types | Drug Claim Name | Drug Name | PMIDs |
| Page: 1 |

Copyright 2023-Present -The University of Texas Health Science Center at Houston |