
|
|||||
|
 | |
| |
| |
| |
| |
| |
|
Gene: OVCA2 |
Gene summary for OVCA2 |
| Gene information | Species | Human | Gene symbol | OVCA2 | Gene ID | 124641 |
| Gene name | OVCA2 serine hydrolase domain containing | |
| Gene Alias | OVCA2 | |
| Cytomap | 17p13.3 | |
| Gene Type | protein-coding | GO ID | GO:0008150 | UniProtAcc | Q8WZ82 |
Top |
Malignant transformation analysis |
| Identification of the aberrant gene expression in precancerous and cancerous lesions by comparing the gene expression of stem-like cells in diseased tissues with normal stem cells |
| Entrez ID | Symbol | Replicates | Species | Organ | Tissue | Adj P-value | Log2FC | Malignancy |
| 124641 | OVCA2 | LZE4T | Human | Esophagus | ESCC | 6.19e-10 | 2.52e-01 | 0.0811 |
| 124641 | OVCA2 | LZE7T | Human | Esophagus | ESCC | 1.02e-03 | 2.13e-01 | 0.0667 |
| 124641 | OVCA2 | LZE22T | Human | Esophagus | ESCC | 1.15e-08 | 4.66e-01 | 0.068 |
| 124641 | OVCA2 | LZE24T | Human | Esophagus | ESCC | 6.43e-22 | 5.12e-01 | 0.0596 |
| 124641 | OVCA2 | P1T-E | Human | Esophagus | ESCC | 1.97e-23 | 7.63e-01 | 0.0875 |
| 124641 | OVCA2 | P2T-E | Human | Esophagus | ESCC | 1.75e-25 | 4.01e-01 | 0.1177 |
| 124641 | OVCA2 | P4T-E | Human | Esophagus | ESCC | 1.31e-36 | 7.10e-01 | 0.1323 |
| 124641 | OVCA2 | P5T-E | Human | Esophagus | ESCC | 3.28e-14 | 2.67e-01 | 0.1327 |
| 124641 | OVCA2 | P8T-E | Human | Esophagus | ESCC | 1.02e-31 | 5.57e-01 | 0.0889 |
| 124641 | OVCA2 | P9T-E | Human | Esophagus | ESCC | 4.90e-17 | 4.30e-01 | 0.1131 |
| 124641 | OVCA2 | P10T-E | Human | Esophagus | ESCC | 4.24e-18 | 3.19e-01 | 0.116 |
| 124641 | OVCA2 | P11T-E | Human | Esophagus | ESCC | 2.96e-18 | 4.90e-01 | 0.1426 |
| 124641 | OVCA2 | P12T-E | Human | Esophagus | ESCC | 1.05e-38 | 6.70e-01 | 0.1122 |
| 124641 | OVCA2 | P15T-E | Human | Esophagus | ESCC | 7.88e-24 | 4.29e-01 | 0.1149 |
| 124641 | OVCA2 | P16T-E | Human | Esophagus | ESCC | 9.86e-34 | 5.31e-01 | 0.1153 |
| 124641 | OVCA2 | P17T-E | Human | Esophagus | ESCC | 1.45e-12 | 4.01e-01 | 0.1278 |
| 124641 | OVCA2 | P19T-E | Human | Esophagus | ESCC | 3.28e-15 | 1.18e+00 | 0.1662 |
| 124641 | OVCA2 | P20T-E | Human | Esophagus | ESCC | 2.43e-32 | 6.49e-01 | 0.1124 |
| 124641 | OVCA2 | P21T-E | Human | Esophagus | ESCC | 3.22e-45 | 8.06e-01 | 0.1617 |
| 124641 | OVCA2 | P22T-E | Human | Esophagus | ESCC | 8.96e-45 | 6.67e-01 | 0.1236 |
| Page: 1 2 3 4 |
| Tissue | Expression Dynamics | Abbreviation |
| Esophagus | 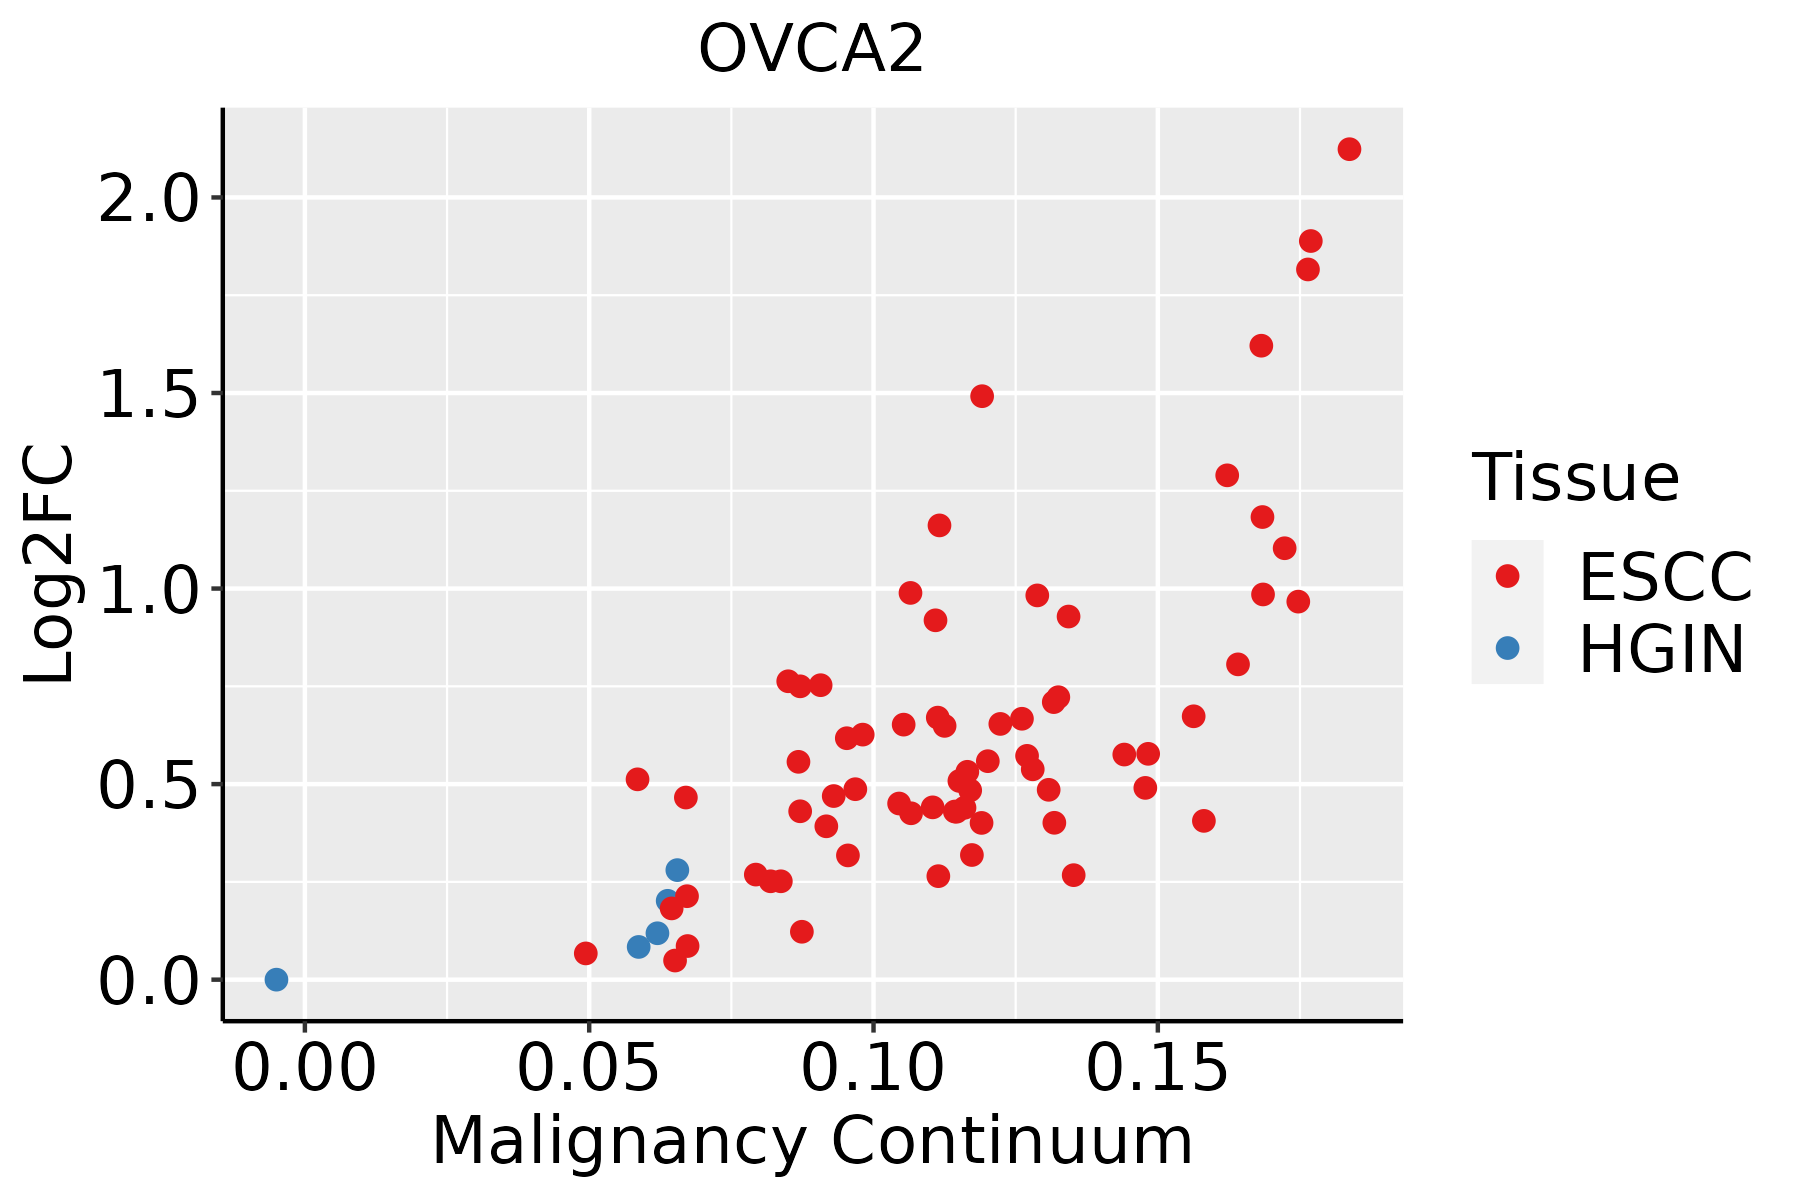 | ESCC: Esophageal squamous cell carcinoma |
| HGIN: High-grade intraepithelial neoplasias | ||
| LGIN: Low-grade intraepithelial neoplasias |
| ∗log2FC in expression of this searched gene in stem-like cells from each diseased tissue sample relative to stem-like cells in normal samples in each tissue plotted against the malignancy continuum. Samples are colored based on if they are from different disease stage. |
Top |
Malignant transformation related pathway analysis |
| Find out the enriched GO biological processes and KEGG pathways involved in transition from healthy to precancer to cancer |
| Tissue | Disease Stage | Enriched GO biological Processes |
| Colorectum | AD |  |
| Colorectum | SER |  |
| Colorectum | MSS |  |
| Colorectum | MSI-H |  |
| Colorectum | FAP |  |
| ∗Top 15 enriched GO BP terms are showed in the bar plot of each disease state in each tissue. Each row represents a significant GO biological process which is colored according to the -log10(p.adjust). |
| Page: 1 2 3 4 5 6 7 8 9 |
| GO ID | Tissue | Disease Stage | Description | Gene Ratio | Bg Ratio | pvalue | p.adjust | Count |
| GO:00325261 | Esophagus | ESCC | response to retinoic acid | 63/8552 | 107/18723 | 4.05e-03 | 1.62e-02 | 63 |
| Page: 1 |
| Pathway ID | Tissue | Disease Stage | Description | Gene Ratio | Bg Ratio | pvalue | p.adjust | qvalue | Count |
| Page: 1 |
Top |
Cell-cell communication analysis |
| Identification of potential cell-cell interactions between two cell types and their ligand-receptor pairs for different disease states |
| Ligand | Receptor | LRpair | Pathway | Tissue | Disease Stage |
| Page: 1 |
Top |
Single-cell gene regulatory network inference analysis |
| Find out the significant the regulons (TFs) and the target genes of each regulon across cell types for different disease states |
| TF | Cell Type | Tissue | Disease Stage | Target Gene | RSS | Regulon Activity |
| ∗The dot plots of a searched regulon are shown for all cell subpopulations in each disease state of each tissue based on the regulon specific score inferred using pySCENIC and by calculating the average expression. |
| Page: 1 |
Top |
Somatic mutation of malignant transformation related genes |
| Annotation of somatic variants for genes involved in malignant transformation |
| Hugo Symbol | Variant Class | Variant Classification | dbSNP RS | HGVSc | HGVSp | HGVSp Short | SWISSPROT | BIOTYPE | SIFT | PolyPhen | Tumor Sample Barcode | Tissue | Histology | Sex | Age | Stage | Therapy Types | Drugs | Outcome |
| OVCA2 | SNV | Missense_Mutation | rs373760635 | c.601N>C | p.Thr201Pro | p.T201P | Q8WZ82 | protein_coding | tolerated(0.08) | possibly_damaging(0.596) | TCGA-AC-A3W5-01 | Breast | breast invasive carcinoma | Female | >=65 | I/II | Chemotherapy | docetaxel | CR |
| OVCA2 | SNV | Missense_Mutation | c.632C>G | p.Ala211Gly | p.A211G | Q8WZ82 | protein_coding | deleterious(0.01) | benign(0.015) | TCGA-BH-A0B4-01 | Breast | breast invasive carcinoma | Male | >=65 | III/IV | Hormone Therapy | tamoxiphen | SD | |
| OVCA2 | SNV | Missense_Mutation | c.423N>T | p.Leu141Phe | p.L141F | Q8WZ82 | protein_coding | tolerated(0.79) | benign(0.018) | TCGA-AA-A029-01 | Colorectum | colon adenocarcinoma | Male | >=65 | I/II | Unknown | Unknown | SD | |
| OVCA2 | SNV | Missense_Mutation | c.533C>T | p.Thr178Ile | p.T178I | Q8WZ82 | protein_coding | deleterious(0.01) | possibly_damaging(0.697) | TCGA-D5-6540-01 | Colorectum | colon adenocarcinoma | Male | >=65 | I/II | Unknown | Unknown | SD | |
| OVCA2 | SNV | Missense_Mutation | novel | c.214N>T | p.Gly72Cys | p.G72C | Q8WZ82 | protein_coding | deleterious(0) | probably_damaging(0.979) | TCGA-A5-A0G1-01 | Endometrium | uterine corpus endometrioid carcinoma | Female | >=65 | I/II | Unknown | Unknown | SD |
| OVCA2 | SNV | Missense_Mutation | c.268G>A | p.Ala90Thr | p.A90T | Q8WZ82 | protein_coding | tolerated(0.67) | benign(0) | TCGA-AJ-A2QO-01 | Endometrium | uterine corpus endometrioid carcinoma | Female | >=65 | I/II | Unknown | Unknown | SD | |
| OVCA2 | SNV | Missense_Mutation | c.644G>A | p.Arg215His | p.R215H | Q8WZ82 | protein_coding | deleterious(0) | probably_damaging(0.995) | TCGA-AP-A0LM-01 | Endometrium | uterine corpus endometrioid carcinoma | Female | <65 | III/IV | Chemotherapy | cisplatin | SD | |
| OVCA2 | SNV | Missense_Mutation | c.659N>C | p.Lys220Thr | p.K220T | Q8WZ82 | protein_coding | tolerated(0.2) | benign(0.04) | TCGA-BS-A0UF-01 | Endometrium | uterine corpus endometrioid carcinoma | Female | >=65 | I/II | Unknown | Unknown | SD | |
| OVCA2 | SNV | Missense_Mutation | novel | c.586N>A | p.Gly196Arg | p.G196R | Q8WZ82 | protein_coding | tolerated(0.06) | possibly_damaging(0.781) | TCGA-DF-A2KN-01 | Endometrium | uterine corpus endometrioid carcinoma | Female | Unknown | I/II | Unknown | Unknown | SD |
| OVCA2 | SNV | Missense_Mutation | novel | c.313N>T | p.Ala105Ser | p.A105S | Q8WZ82 | protein_coding | deleterious(0.01) | probably_damaging(0.999) | TCGA-E6-A1LX-01 | Endometrium | uterine corpus endometrioid carcinoma | Female | <65 | I/II | Unknown | Unknown | SD |
| Page: 1 2 |
Top |
Related drugs of malignant transformation related genes |
| Identification of chemicals and drugs interact with genes involved in malignant transfromation |
| (DGIdb 4.0) |
| Entrez ID | Symbol | Category | Interaction Types | Drug Claim Name | Drug Name | PMIDs |
| Page: 1 |

Copyright 2023-Present -The University of Texas Health Science Center at Houston |