
|
|||||
|
 | |
| |
| |
| |
| |
| |
|
Gene: OTULIN |
Gene summary for OTULIN |
| Gene information | Species | Human | Gene symbol | OTULIN | Gene ID | 90268 |
| Gene name | OTU deubiquitinase with linear linkage specificity | |
| Gene Alias | AIPDS | |
| Cytomap | 5p15.2 | |
| Gene Type | protein-coding | GO ID | GO:0001525 | UniProtAcc | Q96BN8 |
Top |
Malignant transformation analysis |
| Identification of the aberrant gene expression in precancerous and cancerous lesions by comparing the gene expression of stem-like cells in diseased tissues with normal stem cells |
| Entrez ID | Symbol | Replicates | Species | Organ | Tissue | Adj P-value | Log2FC | Malignancy |
| 90268 | OTULIN | LZE4T | Human | Esophagus | ESCC | 4.69e-04 | 4.45e-02 | 0.0811 |
| 90268 | OTULIN | LZE20T | Human | Esophagus | ESCC | 6.29e-03 | 6.57e-02 | 0.0662 |
| 90268 | OTULIN | LZE24T | Human | Esophagus | ESCC | 7.66e-05 | 1.54e-02 | 0.0596 |
| 90268 | OTULIN | P1T-E | Human | Esophagus | ESCC | 2.12e-03 | 1.83e-01 | 0.0875 |
| 90268 | OTULIN | P2T-E | Human | Esophagus | ESCC | 8.45e-19 | 4.20e-01 | 0.1177 |
| 90268 | OTULIN | P4T-E | Human | Esophagus | ESCC | 2.94e-23 | 4.05e-01 | 0.1323 |
| 90268 | OTULIN | P5T-E | Human | Esophagus | ESCC | 6.49e-19 | 4.06e-01 | 0.1327 |
| 90268 | OTULIN | P8T-E | Human | Esophagus | ESCC | 7.27e-12 | 2.01e-01 | 0.0889 |
| 90268 | OTULIN | P9T-E | Human | Esophagus | ESCC | 1.38e-17 | 2.02e-01 | 0.1131 |
| 90268 | OTULIN | P10T-E | Human | Esophagus | ESCC | 2.74e-14 | 2.42e-01 | 0.116 |
| 90268 | OTULIN | P11T-E | Human | Esophagus | ESCC | 4.79e-06 | 2.46e-01 | 0.1426 |
| 90268 | OTULIN | P12T-E | Human | Esophagus | ESCC | 1.08e-03 | 1.49e-01 | 0.1122 |
| 90268 | OTULIN | P15T-E | Human | Esophagus | ESCC | 1.95e-04 | 8.15e-02 | 0.1149 |
| 90268 | OTULIN | P16T-E | Human | Esophagus | ESCC | 5.96e-06 | 1.62e-02 | 0.1153 |
| 90268 | OTULIN | P17T-E | Human | Esophagus | ESCC | 9.93e-06 | 1.14e-01 | 0.1278 |
| 90268 | OTULIN | P20T-E | Human | Esophagus | ESCC | 1.88e-05 | 5.74e-02 | 0.1124 |
| 90268 | OTULIN | P21T-E | Human | Esophagus | ESCC | 6.38e-11 | 9.94e-02 | 0.1617 |
| 90268 | OTULIN | P22T-E | Human | Esophagus | ESCC | 6.61e-12 | 1.01e-01 | 0.1236 |
| 90268 | OTULIN | P23T-E | Human | Esophagus | ESCC | 9.13e-06 | 1.45e-01 | 0.108 |
| 90268 | OTULIN | P24T-E | Human | Esophagus | ESCC | 6.66e-04 | 2.11e-03 | 0.1287 |
| Page: 1 2 3 4 5 |
| Tissue | Expression Dynamics | Abbreviation |
| Esophagus | 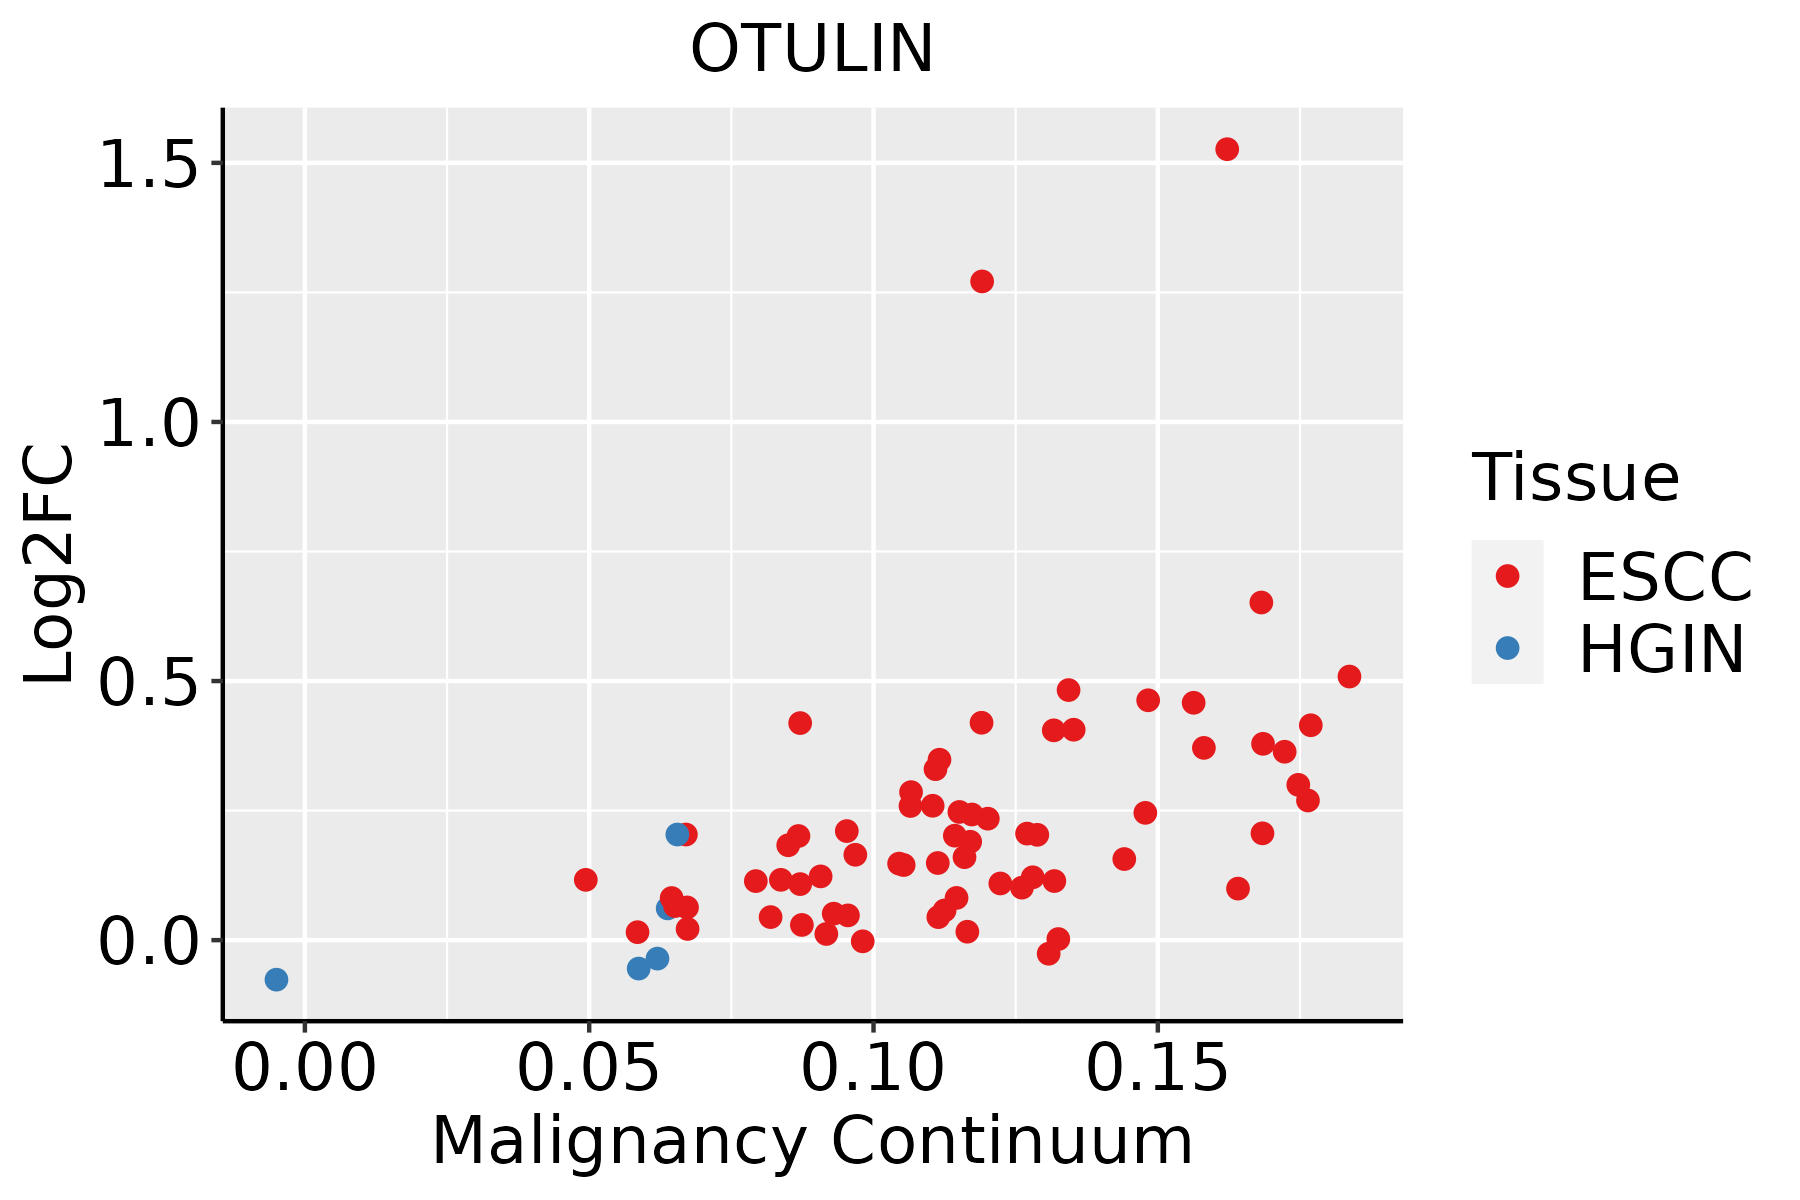 | ESCC: Esophageal squamous cell carcinoma |
| HGIN: High-grade intraepithelial neoplasias | ||
| LGIN: Low-grade intraepithelial neoplasias | ||
| Liver | 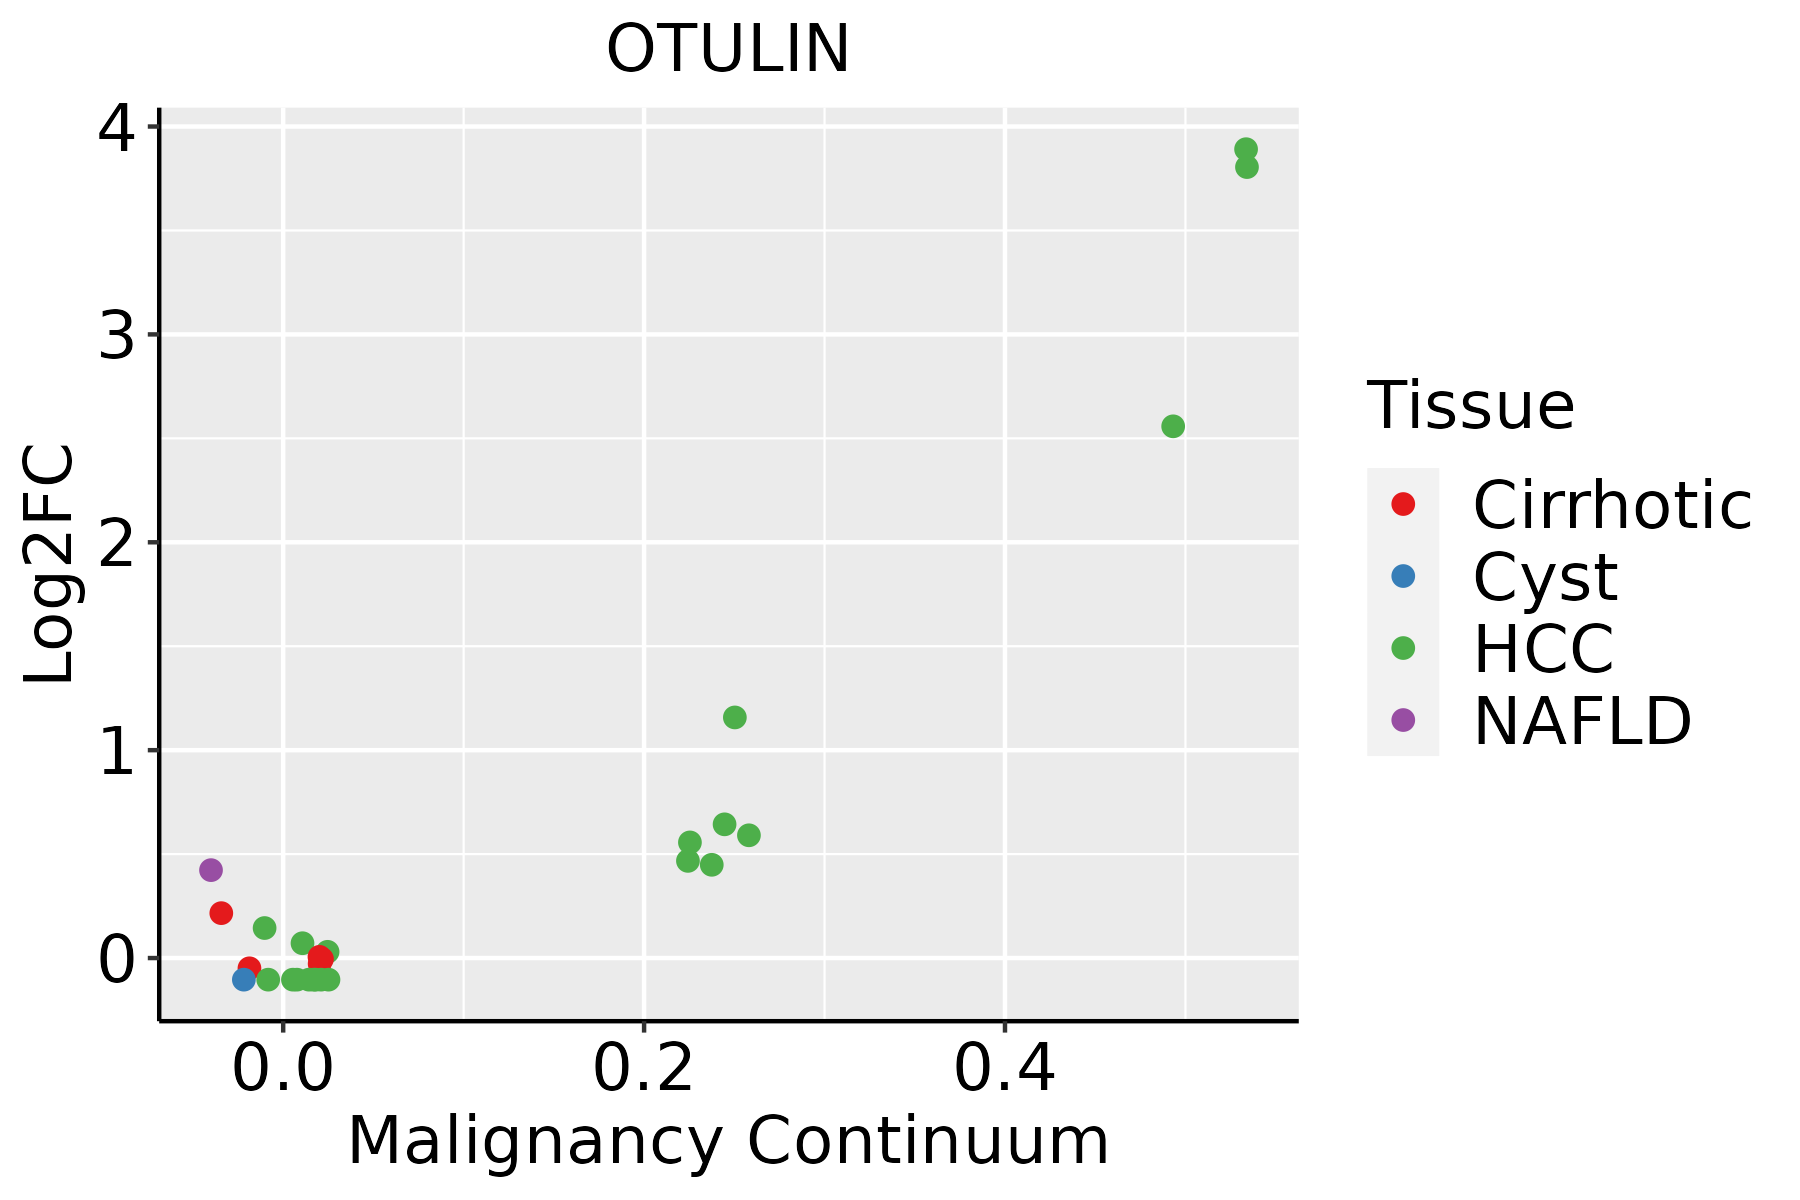 | HCC: Hepatocellular carcinoma |
| NAFLD: Non-alcoholic fatty liver disease | ||
| Oral Cavity | 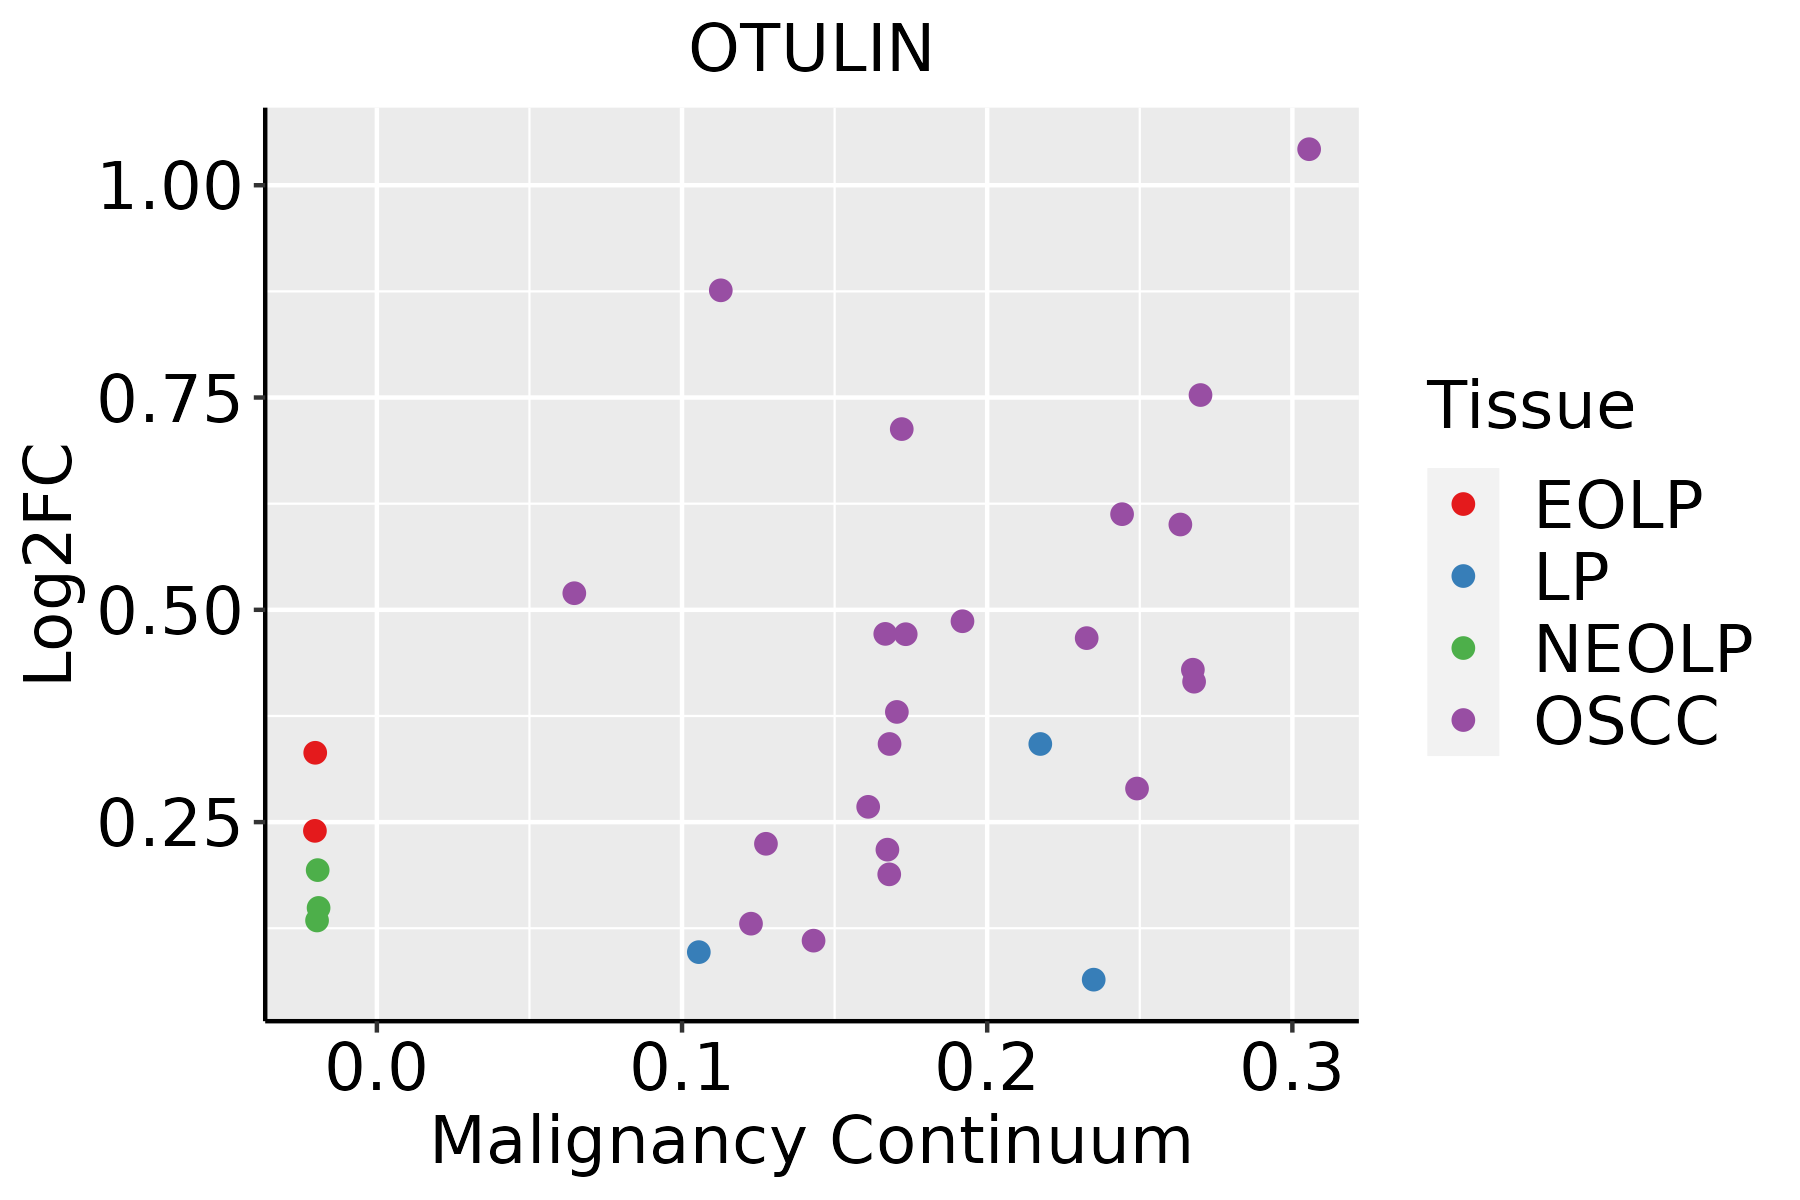 | EOLP: Erosive Oral lichen planus |
| LP: leukoplakia | ||
| NEOLP: Non-erosive oral lichen planus | ||
| OSCC: Oral squamous cell carcinoma | ||
| Thyroid | 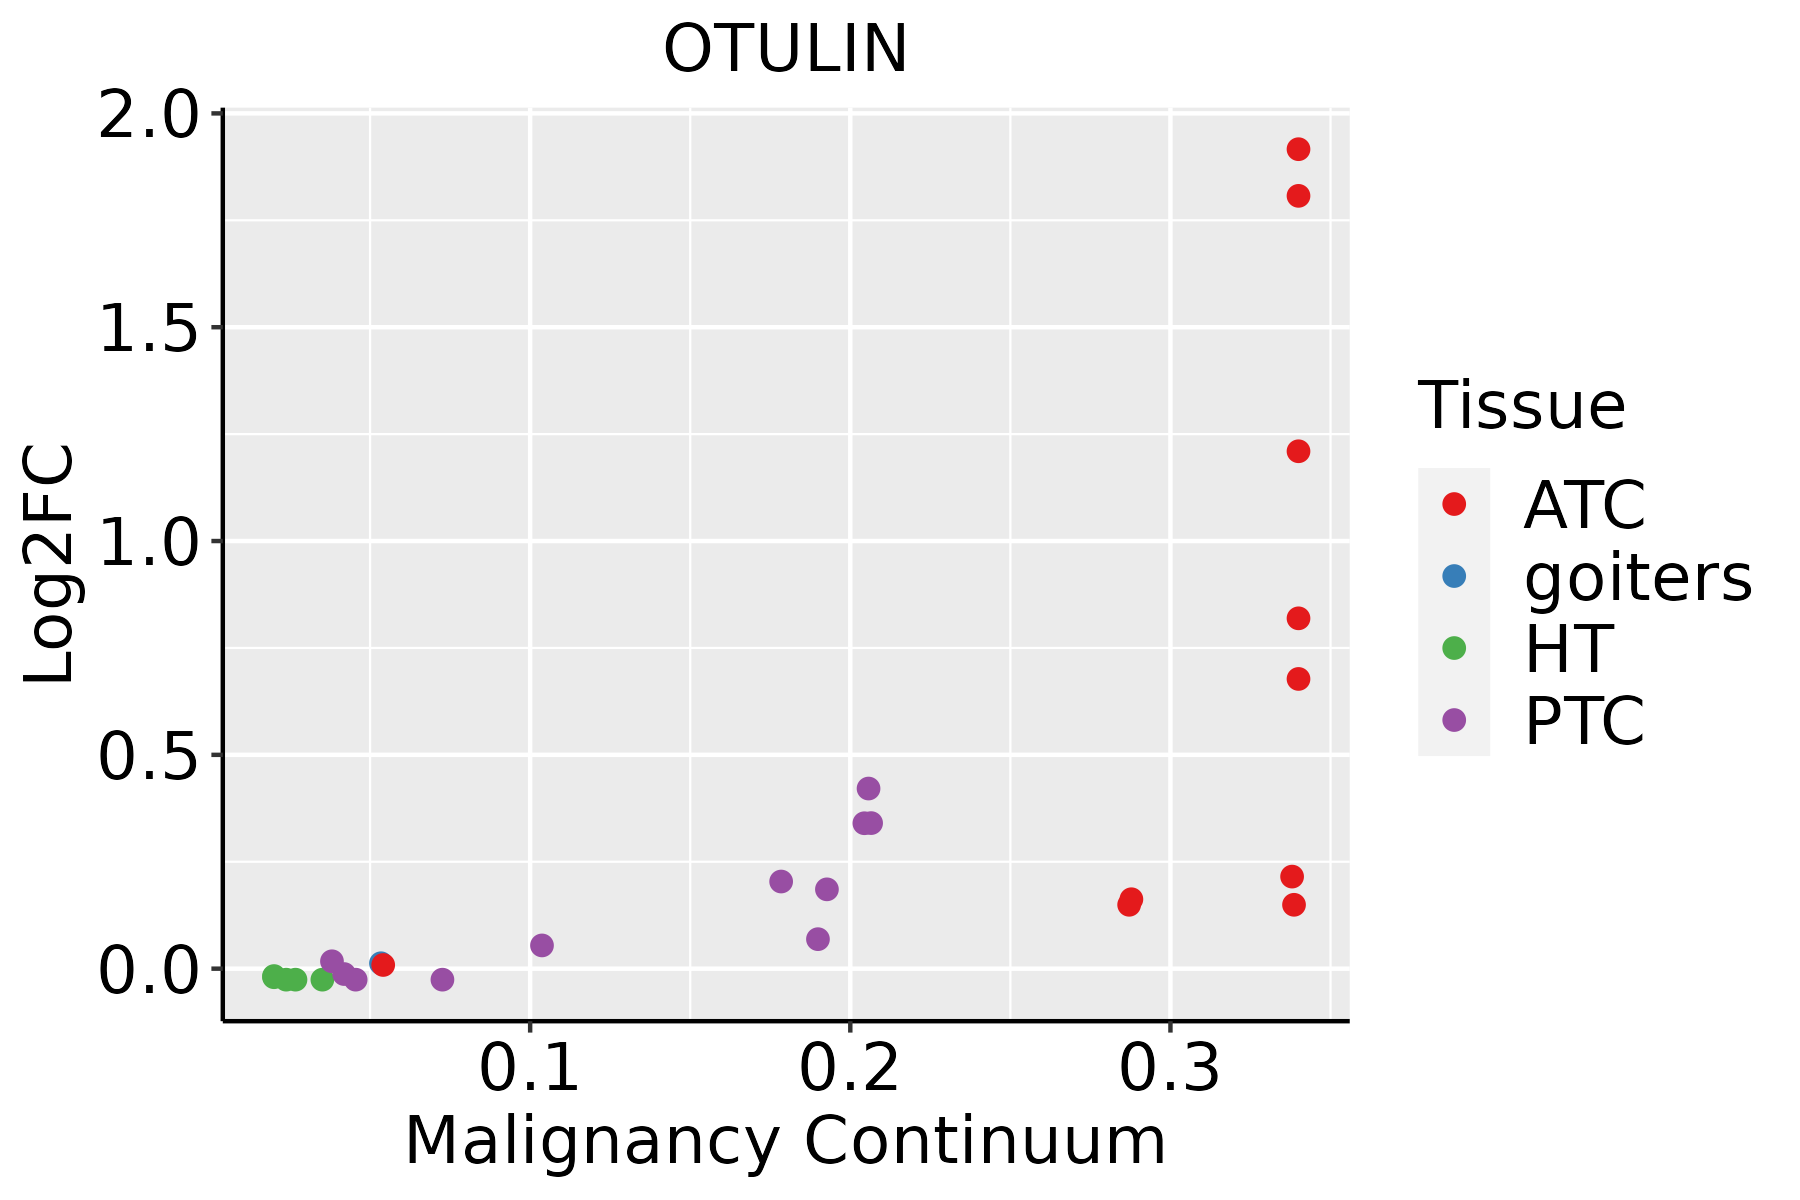 | ATC: Anaplastic thyroid cancer |
| HT: Hashimoto's thyroiditis | ||
| PTC: Papillary thyroid cancer |
| ∗log2FC in expression of this searched gene in stem-like cells from each diseased tissue sample relative to stem-like cells in normal samples in each tissue plotted against the malignancy continuum. Samples are colored based on if they are from different disease stage. |
Top |
Malignant transformation related pathway analysis |
| Find out the enriched GO biological processes and KEGG pathways involved in transition from healthy to precancer to cancer |
| Tissue | Disease Stage | Enriched GO biological Processes |
| Colorectum | AD |  |
| Colorectum | SER |  |
| Colorectum | MSS |  |
| Colorectum | MSI-H |  |
| Colorectum | FAP |  |
| ∗Top 15 enriched GO BP terms are showed in the bar plot of each disease state in each tissue. Each row represents a significant GO biological process which is colored according to the -log10(p.adjust). |
| Page: 1 2 3 4 5 6 7 8 9 |
| GO ID | Tissue | Disease Stage | Description | Gene Ratio | Bg Ratio | pvalue | p.adjust | Count |
| GO:001605517 | Esophagus | ESCC | Wnt signaling pathway | 268/8552 | 444/18723 | 2.32e-10 | 6.58e-09 | 268 |
| GO:019873817 | Esophagus | ESCC | cell-cell signaling by wnt | 269/8552 | 446/18723 | 2.41e-10 | 6.79e-09 | 269 |
| GO:0030522110 | Esophagus | ESCC | intracellular receptor signaling pathway | 170/8552 | 265/18723 | 8.58e-10 | 2.09e-08 | 170 |
| GO:00510908 | Esophagus | ESCC | regulation of DNA-binding transcription factor activity | 252/8552 | 440/18723 | 5.22e-07 | 6.97e-06 | 252 |
| GO:003011117 | Esophagus | ESCC | regulation of Wnt signaling pathway | 194/8552 | 328/18723 | 5.39e-07 | 7.14e-06 | 194 |
| GO:006007016 | Esophagus | ESCC | canonical Wnt signaling pathway | 180/8552 | 303/18723 | 9.15e-07 | 1.17e-05 | 180 |
| GO:006082817 | Esophagus | ESCC | regulation of canonical Wnt signaling pathway | 153/8552 | 253/18723 | 1.38e-06 | 1.67e-05 | 153 |
| GO:00607595 | Esophagus | ESCC | regulation of response to cytokine stimulus | 103/8552 | 162/18723 | 3.14e-06 | 3.53e-05 | 103 |
| GO:003320914 | Esophagus | ESCC | tumor necrosis factor-mediated signaling pathway | 67/8552 | 99/18723 | 7.87e-06 | 7.72e-05 | 67 |
| GO:00019595 | Esophagus | ESCC | regulation of cytokine-mediated signaling pathway | 95/8552 | 150/18723 | 9.48e-06 | 9.04e-05 | 95 |
| GO:003461220 | Esophagus | ESCC | response to tumor necrosis factor | 149/8552 | 253/18723 | 1.47e-05 | 1.33e-04 | 149 |
| GO:007064612 | Esophagus | ESCC | protein modification by small protein removal | 95/8552 | 157/18723 | 1.25e-04 | 8.56e-04 | 95 |
| GO:007135620 | Esophagus | ESCC | cellular response to tumor necrosis factor | 132/8552 | 229/18723 | 1.69e-04 | 1.11e-03 | 132 |
| GO:000275313 | Esophagus | ESCC | cytoplasmic pattern recognition receptor signaling pathway | 41/8552 | 60/18723 | 3.25e-04 | 1.91e-03 | 41 |
| GO:00434332 | Esophagus | ESCC | negative regulation of DNA-binding transcription factor activity | 103/8552 | 185/18723 | 3.86e-03 | 1.57e-02 | 103 |
| GO:00108033 | Esophagus | ESCC | regulation of tumor necrosis factor-mediated signaling pathway | 31/8552 | 47/18723 | 4.01e-03 | 1.62e-02 | 31 |
| GO:00165793 | Esophagus | ESCC | protein deubiquitination | 79/8552 | 139/18723 | 5.23e-03 | 1.97e-02 | 79 |
| GO:00320882 | Esophagus | ESCC | negative regulation of NF-kappaB transcription factor activity | 54/8552 | 93/18723 | 1.08e-02 | 3.67e-02 | 54 |
| GO:003052222 | Liver | HCC | intracellular receptor signaling pathway | 171/7958 | 265/18723 | 3.00e-13 | 1.61e-11 | 171 |
| GO:019873821 | Liver | HCC | cell-cell signaling by wnt | 247/7958 | 446/18723 | 2.11e-08 | 4.96e-07 | 247 |
| Page: 1 2 3 4 5 6 |
| Pathway ID | Tissue | Disease Stage | Description | Gene Ratio | Bg Ratio | pvalue | p.adjust | qvalue | Count |
| Page: 1 |
Top |
Cell-cell communication analysis |
| Identification of potential cell-cell interactions between two cell types and their ligand-receptor pairs for different disease states |
| Ligand | Receptor | LRpair | Pathway | Tissue | Disease Stage |
| Page: 1 |
Top |
Single-cell gene regulatory network inference analysis |
| Find out the significant the regulons (TFs) and the target genes of each regulon across cell types for different disease states |
| TF | Cell Type | Tissue | Disease Stage | Target Gene | RSS | Regulon Activity |
| ∗The dot plots of a searched regulon are shown for all cell subpopulations in each disease state of each tissue based on the regulon specific score inferred using pySCENIC and by calculating the average expression. |
| Page: 1 |
Top |
Somatic mutation of malignant transformation related genes |
| Annotation of somatic variants for genes involved in malignant transformation |
| Hugo Symbol | Variant Class | Variant Classification | dbSNP RS | HGVSc | HGVSp | HGVSp Short | SWISSPROT | BIOTYPE | SIFT | PolyPhen | Tumor Sample Barcode | Tissue | Histology | Sex | Age | Stage | Therapy Types | Drugs | Outcome |
| OTULIN | deletion | Frame_Shift_Del | novel | c.718delN | p.Ala240ProfsTer34 | p.A240Pfs*34 | Q96BN8 | protein_coding | TCGA-D8-A27V-01 | Breast | breast invasive carcinoma | Female | <65 | I/II | Hormone Therapy | tamoxiphen | SD | ||
| OTULIN | SNV | Missense_Mutation | novel | c.680G>T | p.Ser227Ile | p.S227I | Q96BN8 | protein_coding | tolerated(0.1) | benign(0.116) | TCGA-2W-A8YY-01 | Cervix | cervical & endocervical cancer | Female | <65 | I/II | Chemotherapy | cisplatin | CR |
| OTULIN | SNV | Missense_Mutation | novel | c.1013G>A | p.Arg338Gln | p.R338Q | Q96BN8 | protein_coding | deleterious(0.01) | probably_damaging(0.997) | TCGA-2W-A8YY-01 | Cervix | cervical & endocervical cancer | Female | <65 | I/II | Chemotherapy | cisplatin | CR |
| OTULIN | SNV | Missense_Mutation | novel | c.488N>T | p.Ser163Ile | p.S163I | Q96BN8 | protein_coding | tolerated(0.35) | benign(0.347) | TCGA-VS-A9V3-01 | Cervix | cervical & endocervical cancer | Female | <65 | I/II | Chemotherapy | cisplatin | PD |
| OTULIN | SNV | Missense_Mutation | c.962C>G | p.Thr321Ser | p.T321S | Q96BN8 | protein_coding | tolerated(0.08) | benign(0.003) | TCGA-AA-3681-01 | Colorectum | colon adenocarcinoma | Female | >=65 | III/IV | Unknown | Unknown | SD | |
| OTULIN | SNV | Missense_Mutation | c.916C>T | p.Arg306Trp | p.R306W | Q96BN8 | protein_coding | deleterious(0) | probably_damaging(0.999) | TCGA-CK-4951-01 | Colorectum | colon adenocarcinoma | Female | >=65 | I/II | Unknown | Unknown | PD | |
| OTULIN | SNV | Missense_Mutation | c.398C>T | p.Ala133Val | p.A133V | Q96BN8 | protein_coding | deleterious(0) | probably_damaging(0.998) | TCGA-D5-6540-01 | Colorectum | colon adenocarcinoma | Male | >=65 | I/II | Unknown | Unknown | SD | |
| OTULIN | SNV | Missense_Mutation | c.550N>A | p.Leu184Met | p.L184M | Q96BN8 | protein_coding | tolerated(0.06) | probably_damaging(0.976) | TCGA-F5-6464-01 | Colorectum | rectum adenocarcinoma | Female | >=65 | III/IV | Unknown | Unknown | SD | |
| OTULIN | insertion | Nonsense_Mutation | novel | c.570_571insATAAAGAAGTGTTAACAT | p.Glu190_Ser191insIleLysLysCysTerHis | p.E190_S191insIKKC*H | Q96BN8 | protein_coding | TCGA-AM-5820-01 | Colorectum | colon adenocarcinoma | Female | <65 | I/II | Unknown | Unknown | SD | ||
| OTULIN | SNV | Missense_Mutation | novel | c.536N>A | p.Gly179Glu | p.G179E | Q96BN8 | protein_coding | deleterious(0.03) | benign(0.015) | TCGA-A5-A0G1-01 | Endometrium | uterine corpus endometrioid carcinoma | Female | >=65 | I/II | Unknown | Unknown | SD |
| Page: 1 2 3 4 5 |
Top |
Related drugs of malignant transformation related genes |
| Identification of chemicals and drugs interact with genes involved in malignant transfromation |
| (DGIdb 4.0) |
| Entrez ID | Symbol | Category | Interaction Types | Drug Claim Name | Drug Name | PMIDs |
| Page: 1 |

Copyright 2023-Present -The University of Texas Health Science Center at Houston |