| Tissue | Expression Dynamics | Abbreviation |
| Cervix | 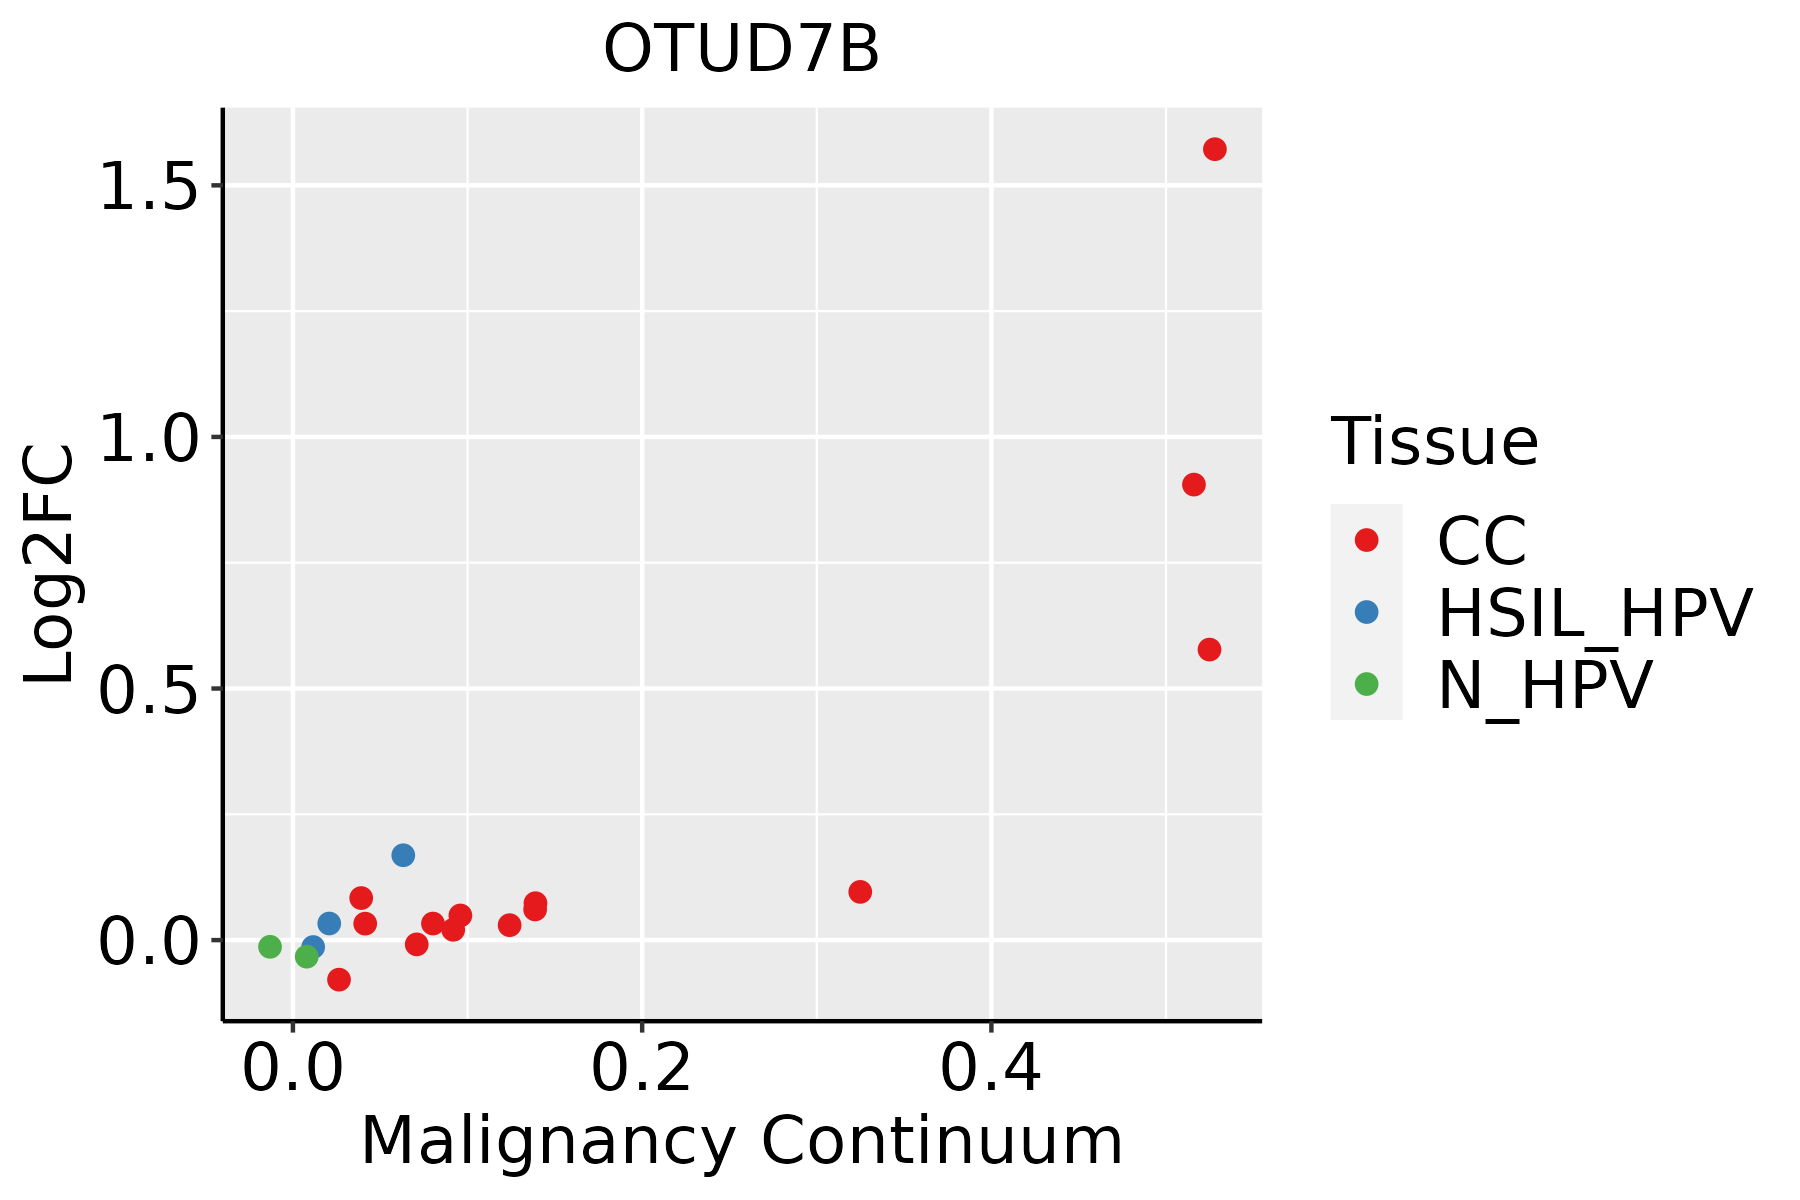 | CC: Cervix cancer |
| HSIL_HPV: HPV-infected high-grade squamous intraepithelial lesions |
| N_HPV: HPV-infected normal cervix |
| Esophagus | 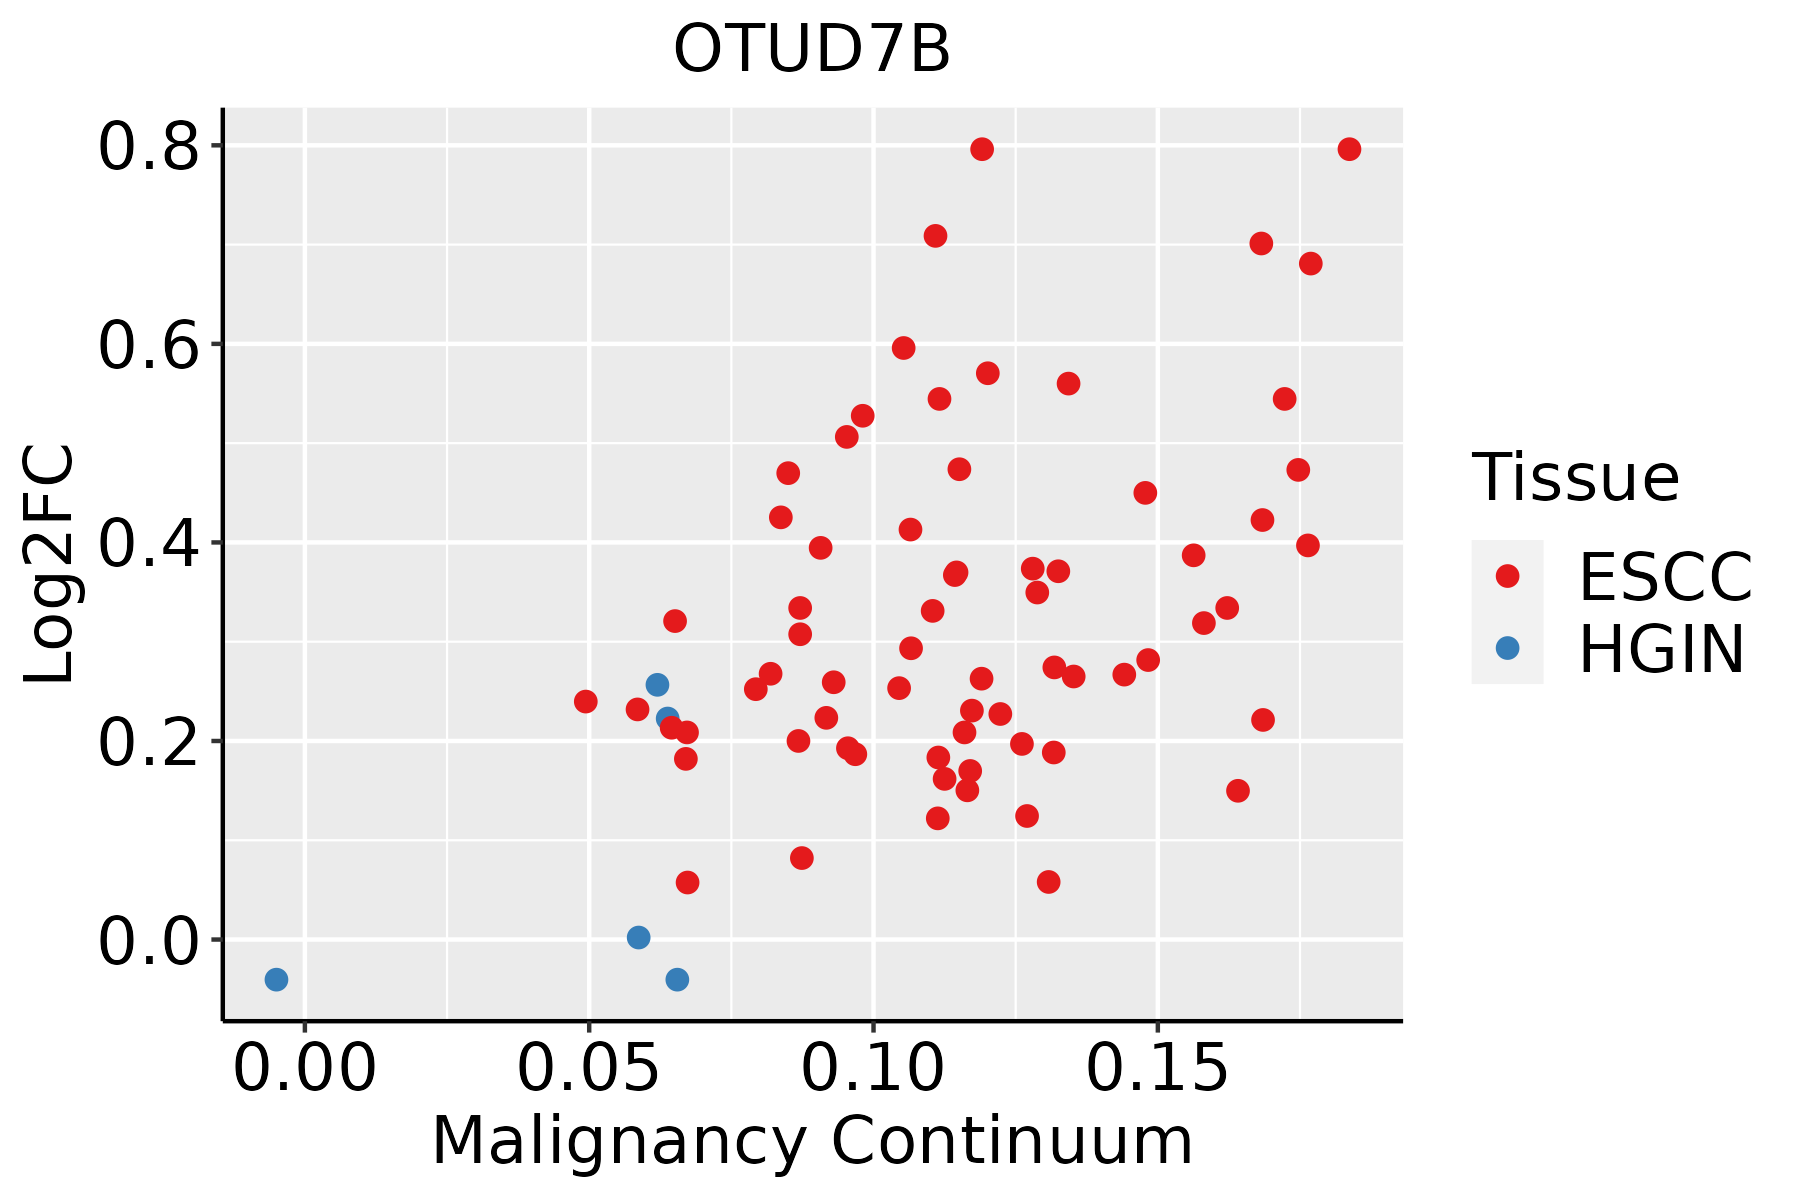 | ESCC: Esophageal squamous cell carcinoma |
| HGIN: High-grade intraepithelial neoplasias |
| LGIN: Low-grade intraepithelial neoplasias |
| Liver |  | HCC: Hepatocellular carcinoma |
| NAFLD: Non-alcoholic fatty liver disease |
| Prostate |  | BPH: Benign Prostatic Hyperplasia |
| Thyroid |  | ATC: Anaplastic thyroid cancer |
| HT: Hashimoto's thyroiditis |
| PTC: Papillary thyroid cancer |
| GO ID | Tissue | Disease Stage | Description | Gene Ratio | Bg Ratio | pvalue | p.adjust | Count |
| GO:00345048 | Cervix | CC | protein localization to nucleus | 68/2311 | 290/18723 | 9.91e-08 | 5.25e-06 | 68 |
| GO:00431228 | Cervix | CC | regulation of I-kappaB kinase/NF-kappaB signaling | 53/2311 | 249/18723 | 4.50e-05 | 6.87e-04 | 53 |
| GO:00017018 | Cervix | CC | in utero embryonic development | 71/2311 | 367/18723 | 7.21e-05 | 1.00e-03 | 71 |
| GO:00072497 | Cervix | CC | I-kappaB kinase/NF-kappaB signaling | 56/2311 | 281/18723 | 1.81e-04 | 2.12e-03 | 56 |
| GO:19001808 | Cervix | CC | regulation of protein localization to nucleus | 31/2311 | 136/18723 | 4.76e-04 | 4.69e-03 | 31 |
| GO:00711083 | Cervix | CC | protein K48-linked deubiquitination | 10/2311 | 35/18723 | 7.99e-03 | 4.18e-02 | 10 |
| GO:19038286 | Cervix | CC | negative regulation of cellular protein localization | 24/2311 | 117/18723 | 8.10e-03 | 4.23e-02 | 24 |
| GO:003450417 | Esophagus | HGIN | protein localization to nucleus | 84/2587 | 290/18723 | 1.06e-11 | 1.24e-09 | 84 |
| GO:004312220 | Esophagus | HGIN | regulation of I-kappaB kinase/NF-kappaB signaling | 63/2587 | 249/18723 | 8.91e-07 | 3.61e-05 | 63 |
| GO:190018017 | Esophagus | HGIN | regulation of protein localization to nucleus | 40/2587 | 136/18723 | 1.69e-06 | 6.31e-05 | 40 |
| GO:000724918 | Esophagus | HGIN | I-kappaB kinase/NF-kappaB signaling | 67/2587 | 281/18723 | 3.84e-06 | 1.29e-04 | 67 |
| GO:000170118 | Esophagus | HGIN | in utero embryonic development | 77/2587 | 367/18723 | 9.56e-05 | 2.05e-03 | 77 |
| GO:00706463 | Esophagus | HGIN | protein modification by small protein removal | 34/2587 | 157/18723 | 4.68e-03 | 4.02e-02 | 34 |
| GO:003450418 | Esophagus | ESCC | protein localization to nucleus | 211/8552 | 290/18723 | 4.06e-21 | 6.60e-19 | 211 |
| GO:000170119 | Esophagus | ESCC | in utero embryonic development | 243/8552 | 367/18723 | 1.00e-15 | 6.86e-14 | 243 |
| GO:190018018 | Esophagus | ESCC | regulation of protein localization to nucleus | 102/8552 | 136/18723 | 2.84e-12 | 1.13e-10 | 102 |
| GO:0043122110 | Esophagus | ESCC | regulation of I-kappaB kinase/NF-kappaB signaling | 167/8552 | 249/18723 | 6.11e-12 | 2.32e-10 | 167 |
| GO:000724919 | Esophagus | ESCC | I-kappaB kinase/NF-kappaB signaling | 183/8552 | 281/18723 | 3.02e-11 | 1.01e-09 | 183 |
| GO:19038289 | Esophagus | ESCC | negative regulation of cellular protein localization | 76/8552 | 117/18723 | 1.97e-05 | 1.72e-04 | 76 |
| GO:007064612 | Esophagus | ESCC | protein modification by small protein removal | 95/8552 | 157/18723 | 1.25e-04 | 8.56e-04 | 95 |
| Hugo Symbol | Variant Class | Variant Classification | dbSNP RS | HGVSc | HGVSp | HGVSp Short | SWISSPROT | BIOTYPE | SIFT | PolyPhen | Tumor Sample Barcode | Tissue | Histology | Sex | Age | Stage | Therapy Types | Drugs | Outcome |
| OTUD7B | SNV | Missense_Mutation | | c.751N>A | p.Glu251Lys | p.E251K | Q6GQQ9 | protein_coding | deleterious(0) | probably_damaging(0.999) | TCGA-A8-A090-01 | Breast | breast invasive carcinoma | Female | >=65 | I/II | Unknown | Unknown | SD |
| OTUD7B | SNV | Missense_Mutation | novel | c.1856A>G | p.His619Arg | p.H619R | Q6GQQ9 | protein_coding | tolerated(0.07) | benign(0.347) | TCGA-AN-A046-01 | Breast | breast invasive carcinoma | Female | >=65 | I/II | Unknown | Unknown | SD |
| OTUD7B | SNV | Missense_Mutation | novel | c.2350N>A | p.Glu784Lys | p.E784K | Q6GQQ9 | protein_coding | tolerated_low_confidence(0.8) | benign(0.105) | TCGA-B6-A400-01 | Breast | breast invasive carcinoma | Female | <65 | III/IV | Unknown | Unknown | SD |
| OTUD7B | SNV | Missense_Mutation | | c.1870N>G | p.Gln624Glu | p.Q624E | Q6GQQ9 | protein_coding | deleterious(0.01) | benign(0.304) | TCGA-D8-A1JA-01 | Breast | breast invasive carcinoma | Female | <65 | III/IV | Chemotherapy | adriamycin | PD |
| OTUD7B | SNV | Missense_Mutation | | c.155N>C | p.Leu52Pro | p.L52P | Q6GQQ9 | protein_coding | deleterious(0.04) | probably_damaging(0.999) | TCGA-D8-A1XK-01 | Breast | breast invasive carcinoma | Female | <65 | I/II | Chemotherapy | doxorubicine+cyclophosphamide | SD |
| OTUD7B | SNV | Missense_Mutation | | c.524N>A | p.Ser175Asn | p.S175N | Q6GQQ9 | protein_coding | tolerated(0.53) | benign(0) | TCGA-E2-A152-01 | Breast | breast invasive carcinoma | Female | <65 | I/II | Targeted Molecular therapy | trastuzumab | PD |
| OTUD7B | SNV | Missense_Mutation | | c.293N>T | p.Gly98Val | p.G98V | Q6GQQ9 | protein_coding | deleterious(0) | probably_damaging(0.998) | TCGA-E2-A155-01 | Breast | breast invasive carcinoma | Female | <65 | I/II | Chemotherapy | cytoxan | SD |
| OTUD7B | SNV | Missense_Mutation | | c.170G>T | p.Ser57Ile | p.S57I | Q6GQQ9 | protein_coding | deleterious(0.01) | benign(0.147) | TCGA-E9-A1RH-01 | Breast | breast invasive carcinoma | Female | <65 | I/II | Chemotherapy | 5-fluorouracil | SD |
| OTUD7B | SNV | Missense_Mutation | novel | c.344C>T | p.Ser115Phe | p.S115F | Q6GQQ9 | protein_coding | tolerated(0.06) | probably_damaging(0.929) | TCGA-EW-A1PE-01 | Breast | breast invasive carcinoma | Female | <65 | I/II | Chemotherapy | fluorouracil | SD |
| OTUD7B | SNV | Missense_Mutation | novel | c.1554N>C | p.Lys518Asn | p.K518N | Q6GQQ9 | protein_coding | deleterious(0) | probably_damaging(0.999) | TCGA-LQ-A4E4-01 | Breast | breast invasive carcinoma | Female | >=65 | III/IV | Hormone Therapy | anastrozole | PD |


