
|
|||||
|
 | |
| |
| |
| |
| |
| |
|
Gene: OTUD5 |
Gene summary for OTUD5 |
| Gene information | Species | Human | Gene symbol | OTUD5 | Gene ID | 55593 |
| Gene name | OTU deubiquitinase 5 | |
| Gene Alias | DUBA | |
| Cytomap | Xp11.23 | |
| Gene Type | protein-coding | GO ID | GO:0001816 | UniProtAcc | Q96G74 |
Top |
Malignant transformation analysis |
| Identification of the aberrant gene expression in precancerous and cancerous lesions by comparing the gene expression of stem-like cells in diseased tissues with normal stem cells |
| Entrez ID | Symbol | Replicates | Species | Organ | Tissue | Adj P-value | Log2FC | Malignancy |
| 55593 | OTUD5 | HCC1_Meng | Human | Liver | HCC | 1.21e-17 | 4.68e-03 | 0.0246 |
| 55593 | OTUD5 | HCC2_Meng | Human | Liver | HCC | 2.08e-16 | 1.27e-01 | 0.0107 |
| 55593 | OTUD5 | HCC1 | Human | Liver | HCC | 1.02e-40 | 6.20e+00 | 0.5336 |
| 55593 | OTUD5 | HCC2 | Human | Liver | HCC | 5.66e-04 | 2.94e+00 | 0.5341 |
| 55593 | OTUD5 | S014 | Human | Liver | HCC | 5.74e-09 | 4.77e-01 | 0.2254 |
| 55593 | OTUD5 | S015 | Human | Liver | HCC | 8.60e-03 | 3.56e-01 | 0.2375 |
| 55593 | OTUD5 | S016 | Human | Liver | HCC | 1.35e-09 | 4.13e-01 | 0.2243 |
| 55593 | OTUD5 | S027 | Human | Liver | HCC | 3.52e-08 | 7.89e-01 | 0.2446 |
| 55593 | OTUD5 | S028 | Human | Liver | HCC | 2.92e-16 | 7.32e-01 | 0.2503 |
| 55593 | OTUD5 | S029 | Human | Liver | HCC | 1.15e-15 | 7.71e-01 | 0.2581 |
| 55593 | OTUD5 | C04 | Human | Oral cavity | OSCC | 2.27e-06 | 5.99e-01 | 0.2633 |
| 55593 | OTUD5 | C21 | Human | Oral cavity | OSCC | 1.10e-16 | 6.22e-01 | 0.2678 |
| 55593 | OTUD5 | C30 | Human | Oral cavity | OSCC | 5.58e-23 | 9.73e-01 | 0.3055 |
| 55593 | OTUD5 | C38 | Human | Oral cavity | OSCC | 3.71e-03 | 6.11e-01 | 0.172 |
| 55593 | OTUD5 | C43 | Human | Oral cavity | OSCC | 1.36e-02 | 1.30e-01 | 0.1704 |
| 55593 | OTUD5 | C46 | Human | Oral cavity | OSCC | 1.37e-04 | 2.62e-01 | 0.1673 |
| 55593 | OTUD5 | C51 | Human | Oral cavity | OSCC | 7.17e-06 | 4.86e-01 | 0.2674 |
| 55593 | OTUD5 | C57 | Human | Oral cavity | OSCC | 5.42e-07 | 3.45e-01 | 0.1679 |
| 55593 | OTUD5 | C08 | Human | Oral cavity | OSCC | 2.17e-11 | 3.05e-01 | 0.1919 |
| 55593 | OTUD5 | LN22 | Human | Oral cavity | OSCC | 1.89e-02 | 5.77e-01 | 0.1733 |
| Page: 1 2 3 |
| Tissue | Expression Dynamics | Abbreviation |
| Liver |  | HCC: Hepatocellular carcinoma |
| NAFLD: Non-alcoholic fatty liver disease | ||
| Oral Cavity |  | EOLP: Erosive Oral lichen planus |
| LP: leukoplakia | ||
| NEOLP: Non-erosive oral lichen planus | ||
| OSCC: Oral squamous cell carcinoma | ||
| Thyroid | 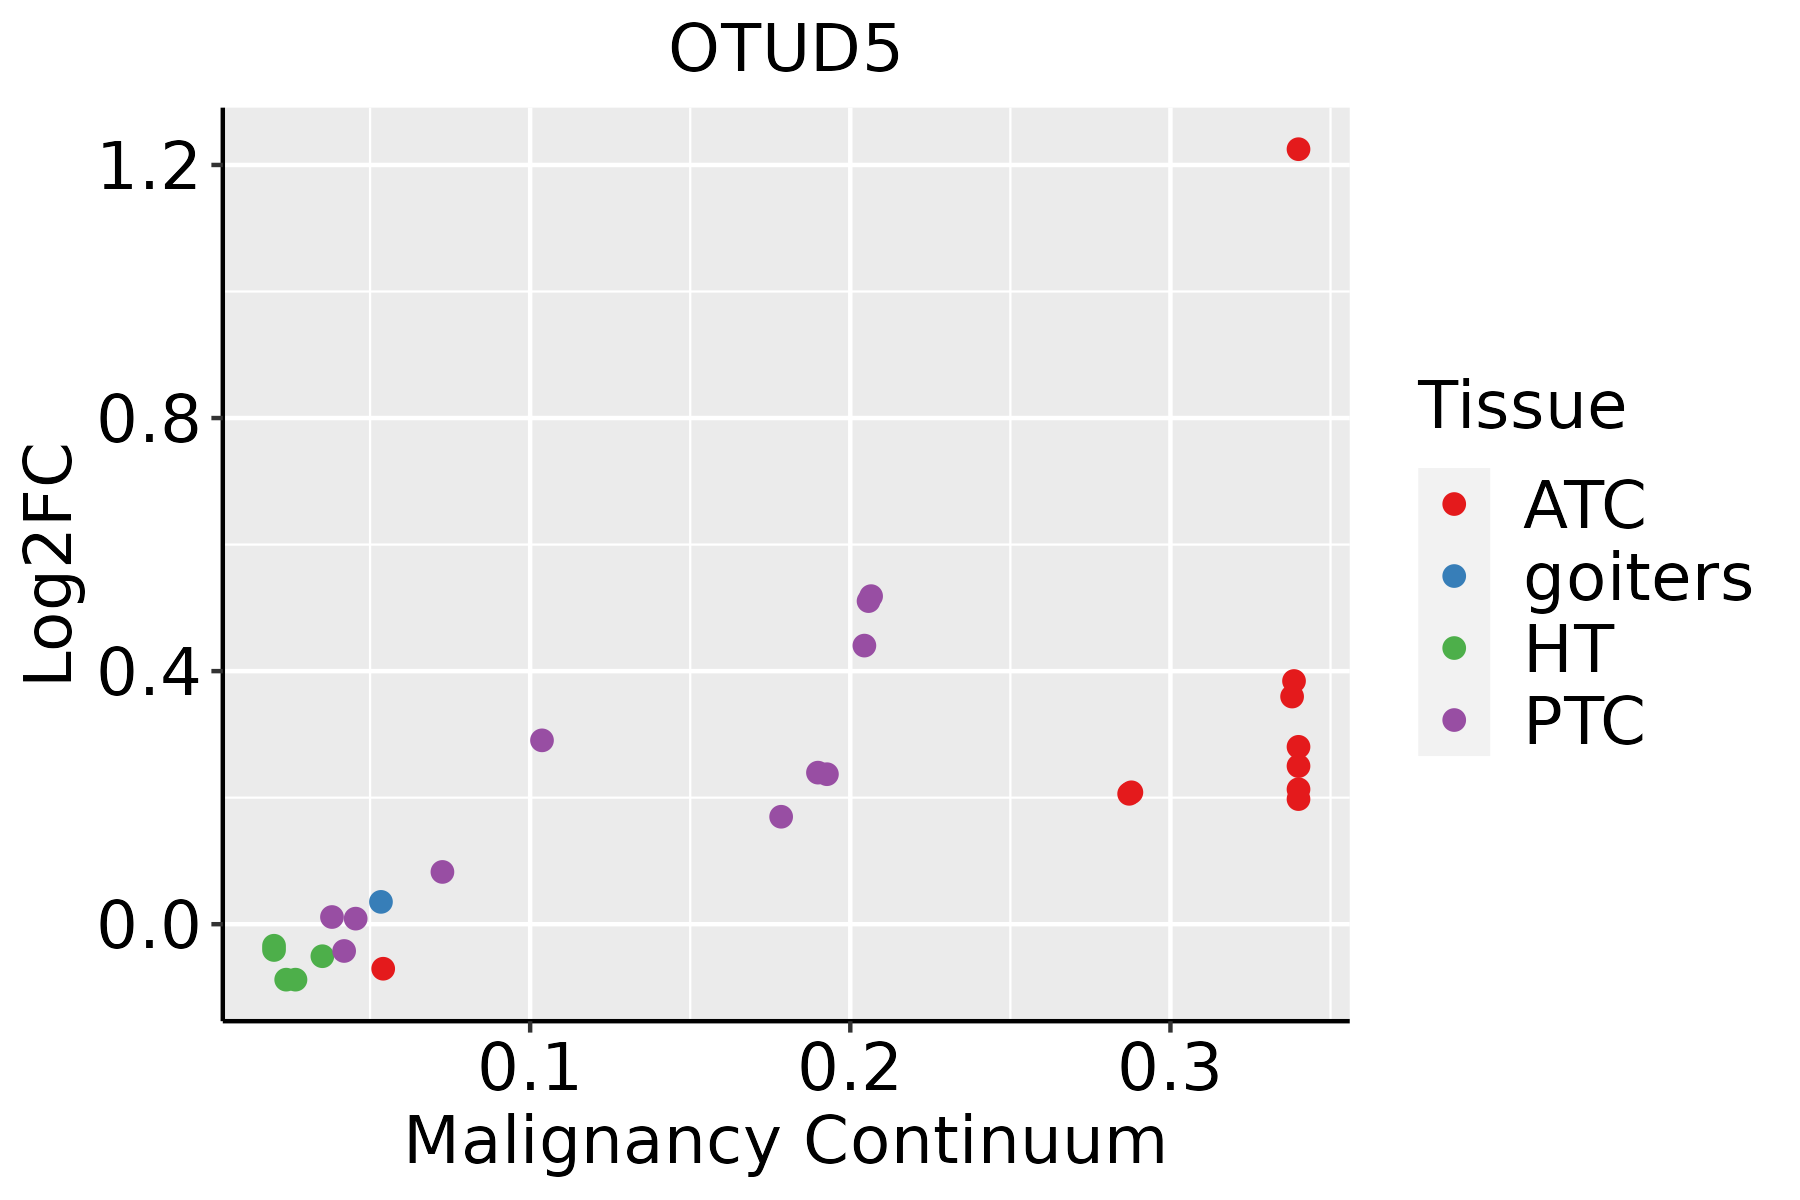 | ATC: Anaplastic thyroid cancer |
| HT: Hashimoto's thyroiditis | ||
| PTC: Papillary thyroid cancer |
| ∗log2FC in expression of this searched gene in stem-like cells from each diseased tissue sample relative to stem-like cells in normal samples in each tissue plotted against the malignancy continuum. Samples are colored based on if they are from different disease stage. |
Top |
Malignant transformation related pathway analysis |
| Find out the enriched GO biological processes and KEGG pathways involved in transition from healthy to precancer to cancer |
| Tissue | Disease Stage | Enriched GO biological Processes |
| Colorectum | AD |  |
| Colorectum | SER |  |
| Colorectum | MSS |  |
| Colorectum | MSI-H |  |
| Colorectum | FAP |  |
| ∗Top 15 enriched GO BP terms are showed in the bar plot of each disease state in each tissue. Each row represents a significant GO biological process which is colored according to the -log10(p.adjust). |
| Page: 1 2 3 4 5 6 7 8 9 |
| GO ID | Tissue | Disease Stage | Description | Gene Ratio | Bg Ratio | pvalue | p.adjust | Count |
| GO:019873821 | Liver | HCC | cell-cell signaling by wnt | 247/7958 | 446/18723 | 2.11e-08 | 4.96e-07 | 247 |
| GO:001605521 | Liver | HCC | Wnt signaling pathway | 245/7958 | 444/18723 | 3.68e-08 | 8.09e-07 | 245 |
| GO:003011121 | Liver | HCC | regulation of Wnt signaling pathway | 180/7958 | 328/18723 | 3.62e-06 | 4.72e-05 | 180 |
| GO:00319291 | Liver | HCC | TOR signaling | 78/7958 | 126/18723 | 8.49e-06 | 9.97e-05 | 78 |
| GO:0032479 | Liver | HCC | regulation of type I interferon production | 60/7958 | 95/18723 | 3.84e-05 | 3.80e-04 | 60 |
| GO:0032606 | Liver | HCC | type I interferon production | 60/7958 | 95/18723 | 3.84e-05 | 3.80e-04 | 60 |
| GO:00706461 | Liver | HCC | protein modification by small protein removal | 91/7958 | 157/18723 | 6.50e-05 | 5.92e-04 | 91 |
| GO:006007021 | Liver | HCC | canonical Wnt signaling pathway | 162/7958 | 303/18723 | 7.00e-05 | 6.32e-04 | 162 |
| GO:006082821 | Liver | HCC | regulation of canonical Wnt signaling pathway | 137/7958 | 253/18723 | 1.15e-04 | 9.70e-04 | 137 |
| GO:0032006 | Liver | HCC | regulation of TOR signaling | 63/7958 | 104/18723 | 1.50e-04 | 1.20e-03 | 63 |
| GO:00165791 | Liver | HCC | protein deubiquitination | 78/7958 | 139/18723 | 8.13e-04 | 4.87e-03 | 78 |
| GO:0032008 | Liver | HCC | positive regulation of TOR signaling | 31/7958 | 47/18723 | 9.90e-04 | 5.71e-03 | 31 |
| GO:003249611 | Liver | HCC | response to lipopolysaccharide | 174/7958 | 343/18723 | 1.19e-03 | 6.62e-03 | 174 |
| GO:00705361 | Liver | HCC | protein K63-linked deubiquitination | 24/7958 | 35/18723 | 1.64e-03 | 8.61e-03 | 24 |
| GO:000223711 | Liver | HCC | response to molecule of bacterial origin | 181/7958 | 363/18723 | 2.58e-03 | 1.24e-02 | 181 |
| GO:00711081 | Liver | HCC | protein K48-linked deubiquitination | 23/7958 | 35/18723 | 4.72e-03 | 2.02e-02 | 23 |
| GO:1904263 | Liver | HCC | positive regulation of TORC1 signaling | 14/7958 | 20/18723 | 1.21e-02 | 4.41e-02 | 14 |
| GO:001605510 | Oral cavity | OSCC | Wnt signaling pathway | 227/7305 | 444/18723 | 1.10e-07 | 1.87e-06 | 227 |
| GO:019873810 | Oral cavity | OSCC | cell-cell signaling by wnt | 227/7305 | 446/18723 | 1.75e-07 | 2.86e-06 | 227 |
| GO:003249617 | Oral cavity | OSCC | response to lipopolysaccharide | 178/7305 | 343/18723 | 7.27e-07 | 1.03e-05 | 178 |
| Page: 1 2 3 |
| Pathway ID | Tissue | Disease Stage | Description | Gene Ratio | Bg Ratio | pvalue | p.adjust | qvalue | Count |
| hsa04622 | Oral cavity | OSCC | RIG-I-like receptor signaling pathway | 41/3704 | 71/8465 | 1.20e-02 | 2.63e-02 | 1.34e-02 | 41 |
| hsa046221 | Oral cavity | OSCC | RIG-I-like receptor signaling pathway | 41/3704 | 71/8465 | 1.20e-02 | 2.63e-02 | 1.34e-02 | 41 |
| Page: 1 |
Top |
Cell-cell communication analysis |
| Identification of potential cell-cell interactions between two cell types and their ligand-receptor pairs for different disease states |
| Ligand | Receptor | LRpair | Pathway | Tissue | Disease Stage |
| Page: 1 |
Top |
Single-cell gene regulatory network inference analysis |
| Find out the significant the regulons (TFs) and the target genes of each regulon across cell types for different disease states |
| TF | Cell Type | Tissue | Disease Stage | Target Gene | RSS | Regulon Activity |
| ∗The dot plots of a searched regulon are shown for all cell subpopulations in each disease state of each tissue based on the regulon specific score inferred using pySCENIC and by calculating the average expression. |
| Page: 1 |
Top |
Somatic mutation of malignant transformation related genes |
| Annotation of somatic variants for genes involved in malignant transformation |
| Hugo Symbol | Variant Class | Variant Classification | dbSNP RS | HGVSc | HGVSp | HGVSp Short | SWISSPROT | BIOTYPE | SIFT | PolyPhen | Tumor Sample Barcode | Tissue | Histology | Sex | Age | Stage | Therapy Types | Drugs | Outcome |
| OTUD5 | SNV | Missense_Mutation | rs782666250 | c.667N>A | p.Ala223Thr | p.A223T | Q96G74 | protein_coding | deleterious(0) | probably_damaging(1) | TCGA-OL-A97C-01 | Breast | breast invasive carcinoma | Female | >=65 | I/II | Unknown | Unknown | PD |
| OTUD5 | SNV | Missense_Mutation | novel | c.1450N>A | p.Leu484Ile | p.L484I | Q96G74 | protein_coding | tolerated(0.17) | benign(0.177) | TCGA-2W-A8YY-01 | Cervix | cervical & endocervical cancer | Female | <65 | I/II | Chemotherapy | cisplatin | CR |
| OTUD5 | SNV | Missense_Mutation | novel | c.723N>T | p.Glu241Asp | p.E241D | Q96G74 | protein_coding | tolerated(0.72) | benign(0.014) | TCGA-2W-A8YY-01 | Cervix | cervical & endocervical cancer | Female | <65 | I/II | Chemotherapy | cisplatin | CR |
| OTUD5 | SNV | Missense_Mutation | novel | c.1433C>A | p.Pro478Gln | p.P478Q | Q96G74 | protein_coding | deleterious(0) | benign(0.202) | TCGA-C5-A2M1-01 | Cervix | cervical & endocervical cancer | Female | <65 | I/II | Unknown | Unknown | SD |
| OTUD5 | SNV | Missense_Mutation | novel | c.839N>A | p.Gly280Asp | p.G280D | Q96G74 | protein_coding | deleterious(0) | probably_damaging(0.998) | TCGA-EA-A3HU-01 | Cervix | cervical & endocervical cancer | Female | <65 | I/II | Unknown | Unknown | SD |
| OTUD5 | SNV | Missense_Mutation | c.596N>G | p.Gln199Arg | p.Q199R | Q96G74 | protein_coding | tolerated(0.52) | benign(0.018) | TCGA-JW-A5VH-01 | Cervix | cervical & endocervical cancer | Female | <65 | I/II | Chemotherapy | carboplatin | PD | |
| OTUD5 | SNV | Missense_Mutation | rs781873713 | c.1256G>A | p.Arg419His | p.R419H | Q96G74 | protein_coding | tolerated(0.06) | benign(0.031) | TCGA-VS-A9UU-01 | Cervix | cervical & endocervical cancer | Female | <65 | I/II | Chemotherapy | cisplatin | CR |
| OTUD5 | SNV | Missense_Mutation | novel | c.21N>T | p.Lys7Asn | p.K7N | Q96G74 | protein_coding | deleterious_low_confidence(0) | benign(0.05) | TCGA-AA-3510-01 | Colorectum | colon adenocarcinoma | Male | >=65 | I/II | Unknown | Unknown | SD |
| OTUD5 | SNV | Missense_Mutation | c.1234N>T | p.Arg412Trp | p.R412W | Q96G74 | protein_coding | deleterious(0) | benign(0.037) | TCGA-AA-3672-01 | Colorectum | colon adenocarcinoma | Female | >=65 | III/IV | Unknown | Unknown | SD | |
| OTUD5 | SNV | Missense_Mutation | c.820N>T | p.Arg274Trp | p.R274W | Q96G74 | protein_coding | deleterious(0) | probably_damaging(1) | TCGA-AA-3715-01 | Colorectum | colon adenocarcinoma | Male | >=65 | I/II | Unknown | Unknown | PD |
| Page: 1 2 3 4 5 |
Top |
Related drugs of malignant transformation related genes |
| Identification of chemicals and drugs interact with genes involved in malignant transfromation |
| (DGIdb 4.0) |
| Entrez ID | Symbol | Category | Interaction Types | Drug Claim Name | Drug Name | PMIDs |
| Page: 1 |

Copyright 2023-Present -The University of Texas Health Science Center at Houston |