
|
|||||
|
 | |
| |
| |
| |
| |
| |
|
Gene: OTUD4 |
Gene summary for OTUD4 |
| Gene information | Species | Human | Gene symbol | OTUD4 | Gene ID | 54726 |
| Gene name | OTU deubiquitinase 4 | |
| Gene Alias | DUBA6 | |
| Cytomap | 4q31.21 | |
| Gene Type | protein-coding | GO ID | GO:0001959 | UniProtAcc | Q01804 |
Top |
Malignant transformation analysis |
| Identification of the aberrant gene expression in precancerous and cancerous lesions by comparing the gene expression of stem-like cells in diseased tissues with normal stem cells |
| Entrez ID | Symbol | Replicates | Species | Organ | Tissue | Adj P-value | Log2FC | Malignancy |
| 54726 | OTUD4 | S43 | Human | Liver | Cirrhotic | 3.79e-02 | 1.64e-02 | -0.0187 |
| 54726 | OTUD4 | HCC1_Meng | Human | Liver | HCC | 1.48e-35 | -1.63e-02 | 0.0246 |
| 54726 | OTUD4 | HCC2_Meng | Human | Liver | HCC | 9.01e-15 | 7.07e-02 | 0.0107 |
| 54726 | OTUD4 | HCC2 | Human | Liver | HCC | 8.25e-08 | 3.10e+00 | 0.5341 |
| 54726 | OTUD4 | S028 | Human | Liver | HCC | 1.09e-05 | 5.39e-01 | 0.2503 |
| 54726 | OTUD4 | S029 | Human | Liver | HCC | 1.04e-05 | 4.96e-01 | 0.2581 |
| 54726 | OTUD4 | C04 | Human | Oral cavity | OSCC | 5.10e-09 | 5.99e-01 | 0.2633 |
| 54726 | OTUD4 | C21 | Human | Oral cavity | OSCC | 2.78e-12 | 5.64e-01 | 0.2678 |
| 54726 | OTUD4 | C30 | Human | Oral cavity | OSCC | 6.58e-19 | 7.33e-01 | 0.3055 |
| 54726 | OTUD4 | C43 | Human | Oral cavity | OSCC | 3.46e-09 | 1.50e-01 | 0.1704 |
| 54726 | OTUD4 | C46 | Human | Oral cavity | OSCC | 8.93e-07 | 2.22e-01 | 0.1673 |
| 54726 | OTUD4 | C51 | Human | Oral cavity | OSCC | 5.60e-09 | 5.70e-01 | 0.2674 |
| 54726 | OTUD4 | C57 | Human | Oral cavity | OSCC | 3.98e-03 | 1.60e-01 | 0.1679 |
| 54726 | OTUD4 | C08 | Human | Oral cavity | OSCC | 7.93e-04 | 1.51e-01 | 0.1919 |
| 54726 | OTUD4 | C09 | Human | Oral cavity | OSCC | 3.26e-04 | 1.23e-01 | 0.1431 |
| 54726 | OTUD4 | LN46 | Human | Oral cavity | OSCC | 4.64e-05 | 4.14e-01 | 0.1666 |
| 54726 | OTUD4 | EOLP-1 | Human | Oral cavity | EOLP | 3.55e-06 | 1.95e-01 | -0.0202 |
| 54726 | OTUD4 | NEOLP-1 | Human | Oral cavity | NEOLP | 2.06e-03 | 1.81e-01 | -0.0194 |
| 54726 | OTUD4 | NEOLP-2 | Human | Oral cavity | NEOLP | 2.43e-02 | 1.26e-01 | -0.0196 |
| 54726 | OTUD4 | SYSMH1 | Human | Oral cavity | OSCC | 4.21e-02 | 1.01e-01 | 0.1127 |
| Page: 1 2 3 |
| Tissue | Expression Dynamics | Abbreviation |
| Liver | 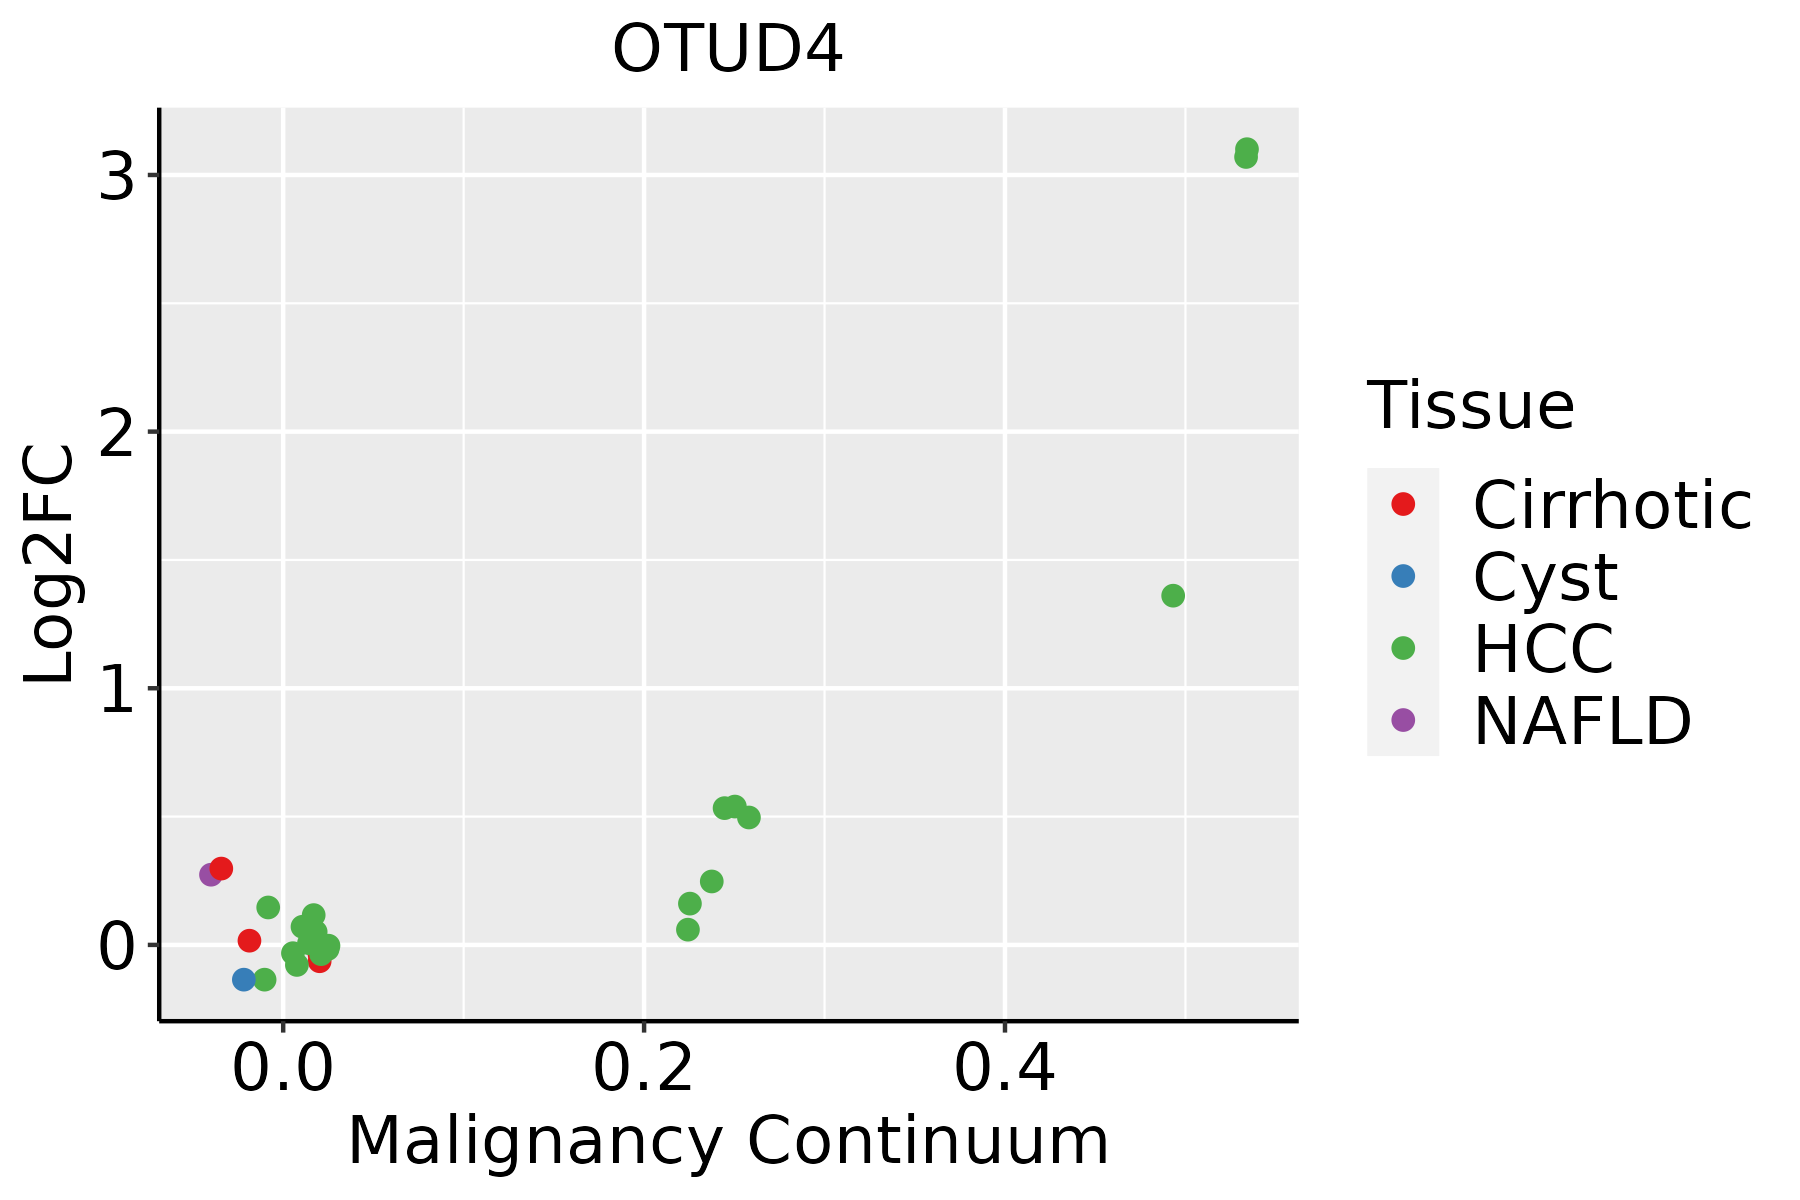 | HCC: Hepatocellular carcinoma |
| NAFLD: Non-alcoholic fatty liver disease | ||
| Oral Cavity | 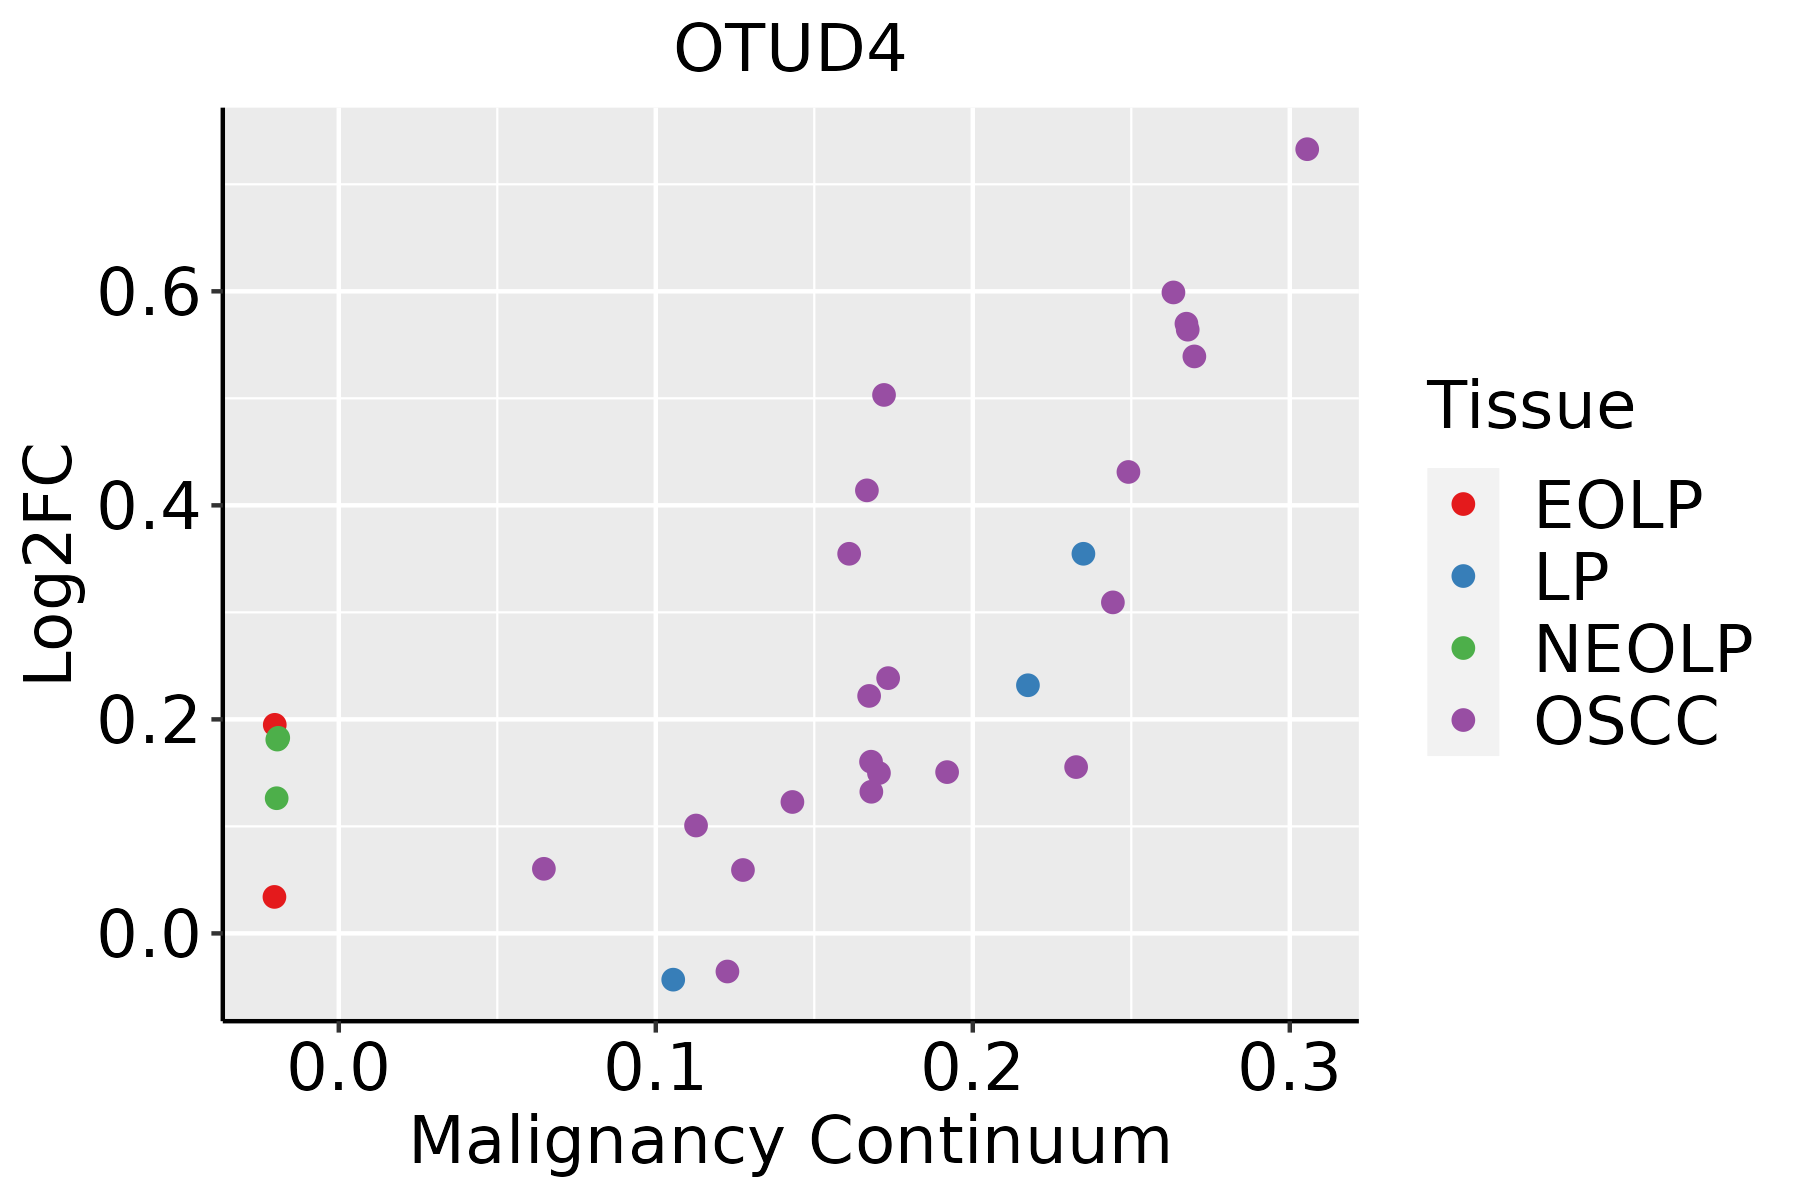 | EOLP: Erosive Oral lichen planus |
| LP: leukoplakia | ||
| NEOLP: Non-erosive oral lichen planus | ||
| OSCC: Oral squamous cell carcinoma | ||
| Thyroid |  | ATC: Anaplastic thyroid cancer |
| HT: Hashimoto's thyroiditis | ||
| PTC: Papillary thyroid cancer |
| ∗log2FC in expression of this searched gene in stem-like cells from each diseased tissue sample relative to stem-like cells in normal samples in each tissue plotted against the malignancy continuum. Samples are colored based on if they are from different disease stage. |
Top |
Malignant transformation related pathway analysis |
| Find out the enriched GO biological processes and KEGG pathways involved in transition from healthy to precancer to cancer |
| Tissue | Disease Stage | Enriched GO biological Processes |
| Colorectum | AD |  |
| Colorectum | SER |  |
| Colorectum | MSS |  |
| Colorectum | MSI-H |  |
| Colorectum | FAP |  |
| ∗Top 15 enriched GO BP terms are showed in the bar plot of each disease state in each tissue. Each row represents a significant GO biological process which is colored according to the -log10(p.adjust). |
| Page: 1 2 3 4 5 6 7 8 9 |
| GO ID | Tissue | Disease Stage | Description | Gene Ratio | Bg Ratio | pvalue | p.adjust | Count |
| GO:190332012 | Liver | Cirrhotic | regulation of protein modification by small protein conjugation or removal | 105/4634 | 242/18723 | 1.43e-10 | 7.43e-09 | 105 |
| GO:00510546 | Liver | Cirrhotic | positive regulation of DNA metabolic process | 73/4634 | 201/18723 | 1.60e-04 | 1.52e-03 | 73 |
| GO:00705553 | Liver | Cirrhotic | response to interleukin-1 | 52/4634 | 143/18723 | 1.27e-03 | 8.54e-03 | 52 |
| GO:005105211 | Liver | Cirrhotic | regulation of DNA metabolic process | 114/4634 | 359/18723 | 1.48e-03 | 9.85e-03 | 114 |
| GO:00900853 | Liver | Cirrhotic | regulation of protein deubiquitination | 8/4634 | 12/18723 | 2.59e-03 | 1.53e-02 | 8 |
| GO:0071347 | Liver | Cirrhotic | cellular response to interleukin-1 | 41/4634 | 113/18723 | 4.08e-03 | 2.19e-02 | 41 |
| GO:190332022 | Liver | HCC | regulation of protein modification by small protein conjugation or removal | 167/7958 | 242/18723 | 4.99e-17 | 4.72e-15 | 167 |
| GO:00022211 | Liver | HCC | pattern recognition receptor signaling pathway | 107/7958 | 172/18723 | 1.37e-07 | 2.58e-06 | 107 |
| GO:005105221 | Liver | HCC | regulation of DNA metabolic process | 198/7958 | 359/18723 | 7.62e-07 | 1.17e-05 | 198 |
| GO:005105411 | Liver | HCC | positive regulation of DNA metabolic process | 113/7958 | 201/18723 | 5.76e-05 | 5.33e-04 | 113 |
| GO:00706461 | Liver | HCC | protein modification by small protein removal | 91/7958 | 157/18723 | 6.50e-05 | 5.92e-04 | 91 |
| GO:009008511 | Liver | HCC | regulation of protein deubiquitination | 11/7958 | 12/18723 | 5.97e-04 | 3.75e-03 | 11 |
| GO:00705551 | Liver | HCC | response to interleukin-1 | 80/7958 | 143/18723 | 7.95e-04 | 4.77e-03 | 80 |
| GO:00165791 | Liver | HCC | protein deubiquitination | 78/7958 | 139/18723 | 8.13e-04 | 4.87e-03 | 78 |
| GO:00705361 | Liver | HCC | protein K63-linked deubiquitination | 24/7958 | 35/18723 | 1.64e-03 | 8.61e-03 | 24 |
| GO:0002224 | Liver | HCC | toll-like receptor signaling pathway | 67/7958 | 121/18723 | 2.87e-03 | 1.34e-02 | 67 |
| GO:00622072 | Liver | HCC | regulation of pattern recognition receptor signaling pathway | 59/7958 | 105/18723 | 3.18e-03 | 1.47e-02 | 59 |
| GO:00711081 | Liver | HCC | protein K48-linked deubiquitination | 23/7958 | 35/18723 | 4.72e-03 | 2.02e-02 | 23 |
| GO:00713471 | Liver | HCC | cellular response to interleukin-1 | 61/7958 | 113/18723 | 8.98e-03 | 3.46e-02 | 61 |
| GO:190332020 | Oral cavity | OSCC | regulation of protein modification by small protein conjugation or removal | 165/7305 | 242/18723 | 2.52e-20 | 3.99e-18 | 165 |
| Page: 1 2 3 4 5 |
| Pathway ID | Tissue | Disease Stage | Description | Gene Ratio | Bg Ratio | pvalue | p.adjust | qvalue | Count |
| Page: 1 |
Top |
Cell-cell communication analysis |
| Identification of potential cell-cell interactions between two cell types and their ligand-receptor pairs for different disease states |
| Ligand | Receptor | LRpair | Pathway | Tissue | Disease Stage |
| Page: 1 |
Top |
Single-cell gene regulatory network inference analysis |
| Find out the significant the regulons (TFs) and the target genes of each regulon across cell types for different disease states |
| TF | Cell Type | Tissue | Disease Stage | Target Gene | RSS | Regulon Activity |
| OTUD4 | CAF | Breast | IDC | ATP13A3,VMP1,DDX21, etc. | 4.14e-02 |  |
| OTUD4 | TREG | Cervix | ADJ | NCAM1,AC253572.2,HIST1H2BE, etc. | 1.33e-02 |  |
| ∗The dot plots of a searched regulon are shown for all cell subpopulations in each disease state of each tissue based on the regulon specific score inferred using pySCENIC and by calculating the average expression. |
| Page: 1 |
Top |
Somatic mutation of malignant transformation related genes |
| Annotation of somatic variants for genes involved in malignant transformation |
| Hugo Symbol | Variant Class | Variant Classification | dbSNP RS | HGVSc | HGVSp | HGVSp Short | SWISSPROT | BIOTYPE | SIFT | PolyPhen | Tumor Sample Barcode | Tissue | Histology | Sex | Age | Stage | Therapy Types | Drugs | Outcome |
| OTUD4 | SNV | Missense_Mutation | novel | c.2307G>T | p.Lys769Asn | p.K769N | Q01804 | protein_coding | deleterious(0) | probably_damaging(0.999) | TCGA-AN-A046-01 | Breast | breast invasive carcinoma | Female | >=65 | I/II | Unknown | Unknown | SD |
| OTUD4 | SNV | Missense_Mutation | c.1099C>T | p.His367Tyr | p.H367Y | Q01804 | protein_coding | tolerated(0.28) | benign(0.341) | TCGA-BH-A1F8-01 | Breast | breast invasive carcinoma | Female | >=65 | III/IV | Unknown | Unknown | PD | |
| OTUD4 | SNV | Missense_Mutation | c.2456C>T | p.Ser819Phe | p.S819F | Q01804 | protein_coding | deleterious(0) | benign(0.444) | TCGA-D8-A1JA-01 | Breast | breast invasive carcinoma | Female | <65 | III/IV | Chemotherapy | adriamycin | PD | |
| OTUD4 | SNV | Missense_Mutation | c.2830G>A | p.Ala944Thr | p.A944T | Q01804 | protein_coding | tolerated(0.23) | benign(0.046) | TCGA-D8-A27E-01 | Breast | breast invasive carcinoma | Female | >=65 | I/II | Hormone Therapy | tamoxiphen+anastrazolum | SD | |
| OTUD4 | SNV | Missense_Mutation | novel | c.287N>T | p.Ser96Phe | p.S96F | Q01804 | protein_coding | deleterious(0) | possibly_damaging(0.836) | TCGA-C5-A1MH-01 | Cervix | cervical & endocervical cancer | Female | >=65 | III/IV | Chemotherapy | cisplatin | PD |
| OTUD4 | SNV | Missense_Mutation | novel | c.2380N>T | p.Pro794Ser | p.P794S | Q01804 | protein_coding | deleterious(0.01) | probably_damaging(0.999) | TCGA-C5-A2LZ-01 | Cervix | cervical & endocervical cancer | Female | >=65 | III/IV | Unknown | Unknown | PD |
| OTUD4 | SNV | Missense_Mutation | c.2919N>T | p.Arg973Ser | p.R973S | Q01804 | protein_coding | deleterious(0) | possibly_damaging(0.884) | TCGA-FU-A23L-01 | Cervix | cervical & endocervical cancer | Female | <65 | I/II | Chemotherapy | cisplatin | CR | |
| OTUD4 | SNV | Missense_Mutation | c.23G>A | p.Arg8Gln | p.R8Q | Q01804 | protein_coding | deleterious(0.04) | benign(0.054) | TCGA-A6-A566-01 | Colorectum | colon adenocarcinoma | Female | <65 | III/IV | Chemotherapy | oxaliplatin | PD | |
| OTUD4 | SNV | Missense_Mutation | c.3071G>A | p.Arg1024Gln | p.R1024Q | Q01804 | protein_coding | deleterious(0.01) | probably_damaging(0.997) | TCGA-AA-3510-01 | Colorectum | colon adenocarcinoma | Male | >=65 | I/II | Unknown | Unknown | SD | |
| OTUD4 | SNV | Missense_Mutation | c.1083N>T | p.Arg361Ser | p.R361S | Q01804 | protein_coding | deleterious(0.02) | probably_damaging(0.978) | TCGA-AA-3715-01 | Colorectum | colon adenocarcinoma | Male | >=65 | I/II | Unknown | Unknown | PD |
| Page: 1 2 3 4 5 6 7 8 9 10 |
Top |
Related drugs of malignant transformation related genes |
| Identification of chemicals and drugs interact with genes involved in malignant transfromation |
| (DGIdb 4.0) |
| Entrez ID | Symbol | Category | Interaction Types | Drug Claim Name | Drug Name | PMIDs |
| Page: 1 |

Copyright 2023-Present -The University of Texas Health Science Center at Houston |