
|
|||||
|
 | |
| |
| |
| |
| |
| |
|
Gene: OTUD1 |
Gene summary for OTUD1 |
| Gene information | Species | Human | Gene symbol | OTUD1 | Gene ID | 220213 |
| Gene name | OTU deubiquitinase 1 | |
| Gene Alias | DUBA7 | |
| Cytomap | 10p12.2 | |
| Gene Type | protein-coding | GO ID | GO:0006464 | UniProtAcc | Q5VV17 |
Top |
Malignant transformation analysis |
| Identification of the aberrant gene expression in precancerous and cancerous lesions by comparing the gene expression of stem-like cells in diseased tissues with normal stem cells |
| Entrez ID | Symbol | Replicates | Species | Organ | Tissue | Adj P-value | Log2FC | Malignancy |
| 220213 | OTUD1 | C04 | Human | Oral cavity | OSCC | 1.67e-08 | 6.04e-01 | 0.2633 |
| 220213 | OTUD1 | C21 | Human | Oral cavity | OSCC | 1.48e-06 | 3.62e-01 | 0.2678 |
| 220213 | OTUD1 | C30 | Human | Oral cavity | OSCC | 2.24e-30 | 1.33e+00 | 0.3055 |
| 220213 | OTUD1 | C38 | Human | Oral cavity | OSCC | 5.27e-04 | 7.84e-01 | 0.172 |
| 220213 | OTUD1 | C51 | Human | Oral cavity | OSCC | 3.89e-07 | 3.42e-01 | 0.2674 |
| 220213 | OTUD1 | C57 | Human | Oral cavity | OSCC | 1.73e-05 | 2.62e-01 | 0.1679 |
| 220213 | OTUD1 | C06 | Human | Oral cavity | OSCC | 1.63e-04 | 1.21e+00 | 0.2699 |
| 220213 | OTUD1 | C08 | Human | Oral cavity | OSCC | 4.27e-04 | 2.08e-01 | 0.1919 |
| 220213 | OTUD1 | LN22 | Human | Oral cavity | OSCC | 4.47e-03 | 6.05e-01 | 0.1733 |
| 220213 | OTUD1 | LP15 | Human | Oral cavity | LP | 1.77e-02 | 4.07e-01 | 0.2174 |
| 220213 | OTUD1 | SYSMH1 | Human | Oral cavity | OSCC | 4.17e-02 | 1.74e-01 | 0.1127 |
| 220213 | OTUD1 | SYSMH2 | Human | Oral cavity | OSCC | 3.32e-16 | 7.22e-01 | 0.2326 |
| 220213 | OTUD1 | SYSMH3 | Human | Oral cavity | OSCC | 6.40e-26 | 9.19e-01 | 0.2442 |
| 220213 | OTUD1 | male-WTA | Human | Thyroid | PTC | 2.56e-11 | 4.42e-02 | 0.1037 |
| 220213 | OTUD1 | PTC01 | Human | Thyroid | PTC | 1.28e-08 | 1.66e-01 | 0.1899 |
| 220213 | OTUD1 | PTC04 | Human | Thyroid | PTC | 2.26e-05 | 1.88e-01 | 0.1927 |
| 220213 | OTUD1 | PTC05 | Human | Thyroid | PTC | 4.19e-13 | 7.72e-01 | 0.2065 |
| 220213 | OTUD1 | PTC06 | Human | Thyroid | PTC | 2.44e-18 | 5.02e-01 | 0.2057 |
| 220213 | OTUD1 | PTC07 | Human | Thyroid | PTC | 1.19e-21 | 4.11e-01 | 0.2044 |
| 220213 | OTUD1 | ATC09 | Human | Thyroid | ATC | 1.19e-04 | 1.40e-01 | 0.2871 |
| Page: 1 2 |
| Tissue | Expression Dynamics | Abbreviation |
| Oral Cavity |  | EOLP: Erosive Oral lichen planus |
| LP: leukoplakia | ||
| NEOLP: Non-erosive oral lichen planus | ||
| OSCC: Oral squamous cell carcinoma | ||
| Thyroid | 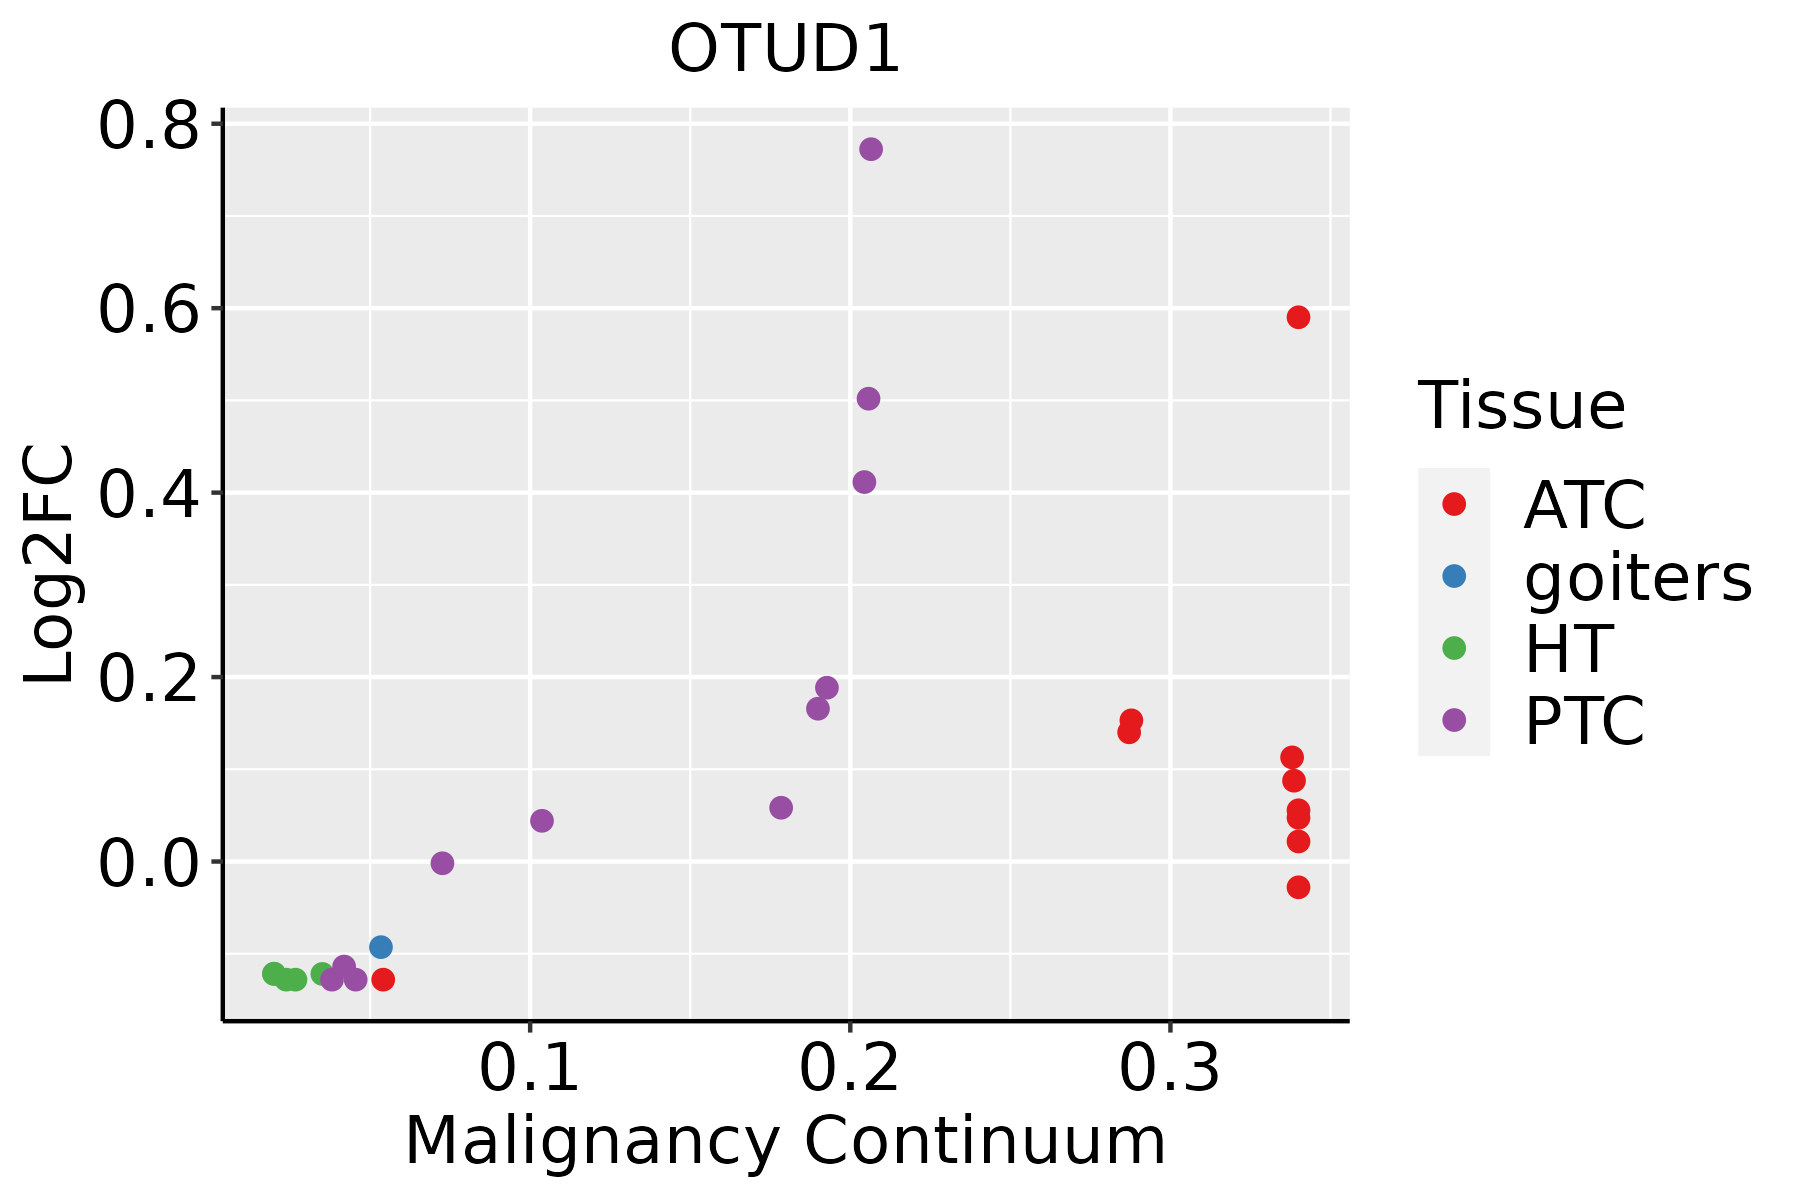 | ATC: Anaplastic thyroid cancer |
| HT: Hashimoto's thyroiditis | ||
| PTC: Papillary thyroid cancer |
| ∗log2FC in expression of this searched gene in stem-like cells from each diseased tissue sample relative to stem-like cells in normal samples in each tissue plotted against the malignancy continuum. Samples are colored based on if they are from different disease stage. |
Top |
Malignant transformation related pathway analysis |
| Find out the enriched GO biological processes and KEGG pathways involved in transition from healthy to precancer to cancer |
| Tissue | Disease Stage | Enriched GO biological Processes |
| Colorectum | AD |  |
| Colorectum | SER |  |
| Colorectum | MSS |  |
| Colorectum | MSI-H |  |
| Colorectum | FAP |  |
| ∗Top 15 enriched GO BP terms are showed in the bar plot of each disease state in each tissue. Each row represents a significant GO biological process which is colored according to the -log10(p.adjust). |
| Page: 1 2 3 4 5 6 7 8 9 |
| GO ID | Tissue | Disease Stage | Description | Gene Ratio | Bg Ratio | pvalue | p.adjust | Count |
| GO:00706462 | Oral cavity | OSCC | protein modification by small protein removal | 77/7305 | 157/18723 | 6.55e-03 | 2.43e-02 | 77 |
| GO:00706465 | Thyroid | PTC | protein modification by small protein removal | 71/5968 | 157/18723 | 3.03e-04 | 2.12e-03 | 71 |
| GO:00705363 | Thyroid | PTC | protein K63-linked deubiquitination | 20/5968 | 35/18723 | 1.75e-03 | 9.51e-03 | 20 |
| GO:00165794 | Thyroid | PTC | protein deubiquitination | 59/5968 | 139/18723 | 5.50e-03 | 2.50e-02 | 59 |
| GO:007064613 | Thyroid | ATC | protein modification by small protein removal | 71/6293 | 157/18723 | 1.59e-03 | 7.99e-03 | 71 |
| GO:007053611 | Thyroid | ATC | protein K63-linked deubiquitination | 20/6293 | 35/18723 | 3.56e-03 | 1.57e-02 | 20 |
| Page: 1 |
| Pathway ID | Tissue | Disease Stage | Description | Gene Ratio | Bg Ratio | pvalue | p.adjust | qvalue | Count |
| Page: 1 |
Top |
Cell-cell communication analysis |
| Identification of potential cell-cell interactions between two cell types and their ligand-receptor pairs for different disease states |
| Ligand | Receptor | LRpair | Pathway | Tissue | Disease Stage |
| Page: 1 |
Top |
Single-cell gene regulatory network inference analysis |
| Find out the significant the regulons (TFs) and the target genes of each regulon across cell types for different disease states |
| TF | Cell Type | Tissue | Disease Stage | Target Gene | RSS | Regulon Activity |
| ∗The dot plots of a searched regulon are shown for all cell subpopulations in each disease state of each tissue based on the regulon specific score inferred using pySCENIC and by calculating the average expression. |
| Page: 1 |
Top |
Somatic mutation of malignant transformation related genes |
| Annotation of somatic variants for genes involved in malignant transformation |
| Hugo Symbol | Variant Class | Variant Classification | dbSNP RS | HGVSc | HGVSp | HGVSp Short | SWISSPROT | BIOTYPE | SIFT | PolyPhen | Tumor Sample Barcode | Tissue | Histology | Sex | Age | Stage | Therapy Types | Drugs | Outcome |
| OTUD1 | SNV | Missense_Mutation | c.985G>A | p.Val329Met | p.V329M | Q5VV17 | protein_coding | tolerated(0.07) | benign(0.174) | TCGA-DG-A2KM-01 | Cervix | cervical & endocervical cancer | Female | <65 | I/II | Chemotherapy | cisplatin | SD | |
| OTUD1 | SNV | Missense_Mutation | c.1378N>A | p.Glu460Lys | p.E460K | Q5VV17 | protein_coding | deleterious(0) | probably_damaging(0.949) | TCGA-AA-3977-01 | Colorectum | colon adenocarcinoma | Male | >=65 | I/II | Unknown | Unknown | SD | |
| OTUD1 | SNV | Missense_Mutation | c.1378N>A | p.Glu460Lys | p.E460K | Q5VV17 | protein_coding | deleterious(0) | probably_damaging(0.949) | TCGA-AJ-A3EL-01 | Endometrium | uterine corpus endometrioid carcinoma | Female | <65 | I/II | Unknown | Unknown | SD | |
| OTUD1 | SNV | Missense_Mutation | novel | c.880C>A | p.Leu294Met | p.L294M | Q5VV17 | protein_coding | deleterious(0.01) | probably_damaging(0.998) | TCGA-AP-A1DK-01 | Endometrium | uterine corpus endometrioid carcinoma | Female | <65 | I/II | Unknown | Unknown | SD |
| OTUD1 | SNV | Missense_Mutation | novel | c.1373G>A | p.Arg458His | p.R458H | Q5VV17 | protein_coding | deleterious(0) | probably_damaging(0.925) | TCGA-AP-A1DV-01 | Endometrium | uterine corpus endometrioid carcinoma | Female | <65 | I/II | Unknown | Unknown | SD |
| OTUD1 | SNV | Missense_Mutation | novel | c.1373N>A | p.Arg458His | p.R458H | Q5VV17 | protein_coding | deleterious(0) | probably_damaging(0.925) | TCGA-AX-A1CE-01 | Endometrium | uterine corpus endometrioid carcinoma | Female | <65 | I/II | Unspecific | Paclitaxel | SD |
| OTUD1 | SNV | Missense_Mutation | novel | c.1042N>A | p.Ala348Thr | p.A348T | Q5VV17 | protein_coding | deleterious(0) | possibly_damaging(0.513) | TCGA-B5-A3FA-01 | Endometrium | uterine corpus endometrioid carcinoma | Female | >=65 | I/II | Unknown | Unknown | SD |
| OTUD1 | SNV | Missense_Mutation | c.1378N>A | p.Glu460Lys | p.E460K | Q5VV17 | protein_coding | deleterious(0) | probably_damaging(0.949) | TCGA-B5-A3FC-01 | Endometrium | uterine corpus endometrioid carcinoma | Female | <65 | I/II | Unknown | Unknown | SD | |
| OTUD1 | SNV | Missense_Mutation | novel | c.1298A>C | p.Asp433Ala | p.D433A | Q5VV17 | protein_coding | deleterious(0) | probably_damaging(0.992) | TCGA-D1-A103-01 | Endometrium | uterine corpus endometrioid carcinoma | Female | >=65 | I/II | Unknown | Unknown | SD |
| OTUD1 | SNV | Missense_Mutation | novel | c.1255N>G | p.Arg419Gly | p.R419G | Q5VV17 | protein_coding | deleterious(0) | possibly_damaging(0.457) | TCGA-DF-A2KN-01 | Endometrium | uterine corpus endometrioid carcinoma | Female | Unknown | I/II | Unknown | Unknown | SD |
| Page: 1 2 |
Top |
Related drugs of malignant transformation related genes |
| Identification of chemicals and drugs interact with genes involved in malignant transfromation |
| (DGIdb 4.0) |
| Entrez ID | Symbol | Category | Interaction Types | Drug Claim Name | Drug Name | PMIDs |
| Page: 1 |

Copyright 2023-Present -The University of Texas Health Science Center at Houston |