
|
|||||
|
 | |
| |
| |
| |
| |
| |
|
Gene: OTUB1 |
Gene summary for OTUB1 |
| Gene information | Species | Human | Gene symbol | OTUB1 | Gene ID | 55611 |
| Gene name | OTU deubiquitinase, ubiquitin aldehyde binding 1 | |
| Gene Alias | HSPC263 | |
| Cytomap | 11q13.1 | |
| Gene Type | protein-coding | GO ID | GO:0000209 | UniProtAcc | B3KUV5 |
Top |
Malignant transformation analysis |
| Identification of the aberrant gene expression in precancerous and cancerous lesions by comparing the gene expression of stem-like cells in diseased tissues with normal stem cells |
| Entrez ID | Symbol | Replicates | Species | Organ | Tissue | Adj P-value | Log2FC | Malignancy |
| 55611 | OTUB1 | HTA11_3410_2000001011 | Human | Colorectum | AD | 4.62e-07 | 2.09e-01 | 0.0155 |
| 55611 | OTUB1 | HTA11_2487_2000001011 | Human | Colorectum | SER | 2.21e-12 | 5.40e-01 | -0.1808 |
| 55611 | OTUB1 | HTA11_1938_2000001011 | Human | Colorectum | AD | 3.44e-08 | 3.47e-01 | -0.0811 |
| 55611 | OTUB1 | HTA11_78_2000001011 | Human | Colorectum | AD | 2.88e-05 | 2.30e-01 | -0.1088 |
| 55611 | OTUB1 | HTA11_347_2000001011 | Human | Colorectum | AD | 4.39e-16 | 4.08e-01 | -0.1954 |
| 55611 | OTUB1 | HTA11_411_2000001011 | Human | Colorectum | SER | 5.09e-07 | 9.48e-01 | -0.2602 |
| 55611 | OTUB1 | HTA11_2112_2000001011 | Human | Colorectum | SER | 3.09e-04 | 4.59e-01 | -0.2196 |
| 55611 | OTUB1 | HTA11_3361_2000001011 | Human | Colorectum | AD | 2.13e-11 | 5.64e-01 | -0.1207 |
| 55611 | OTUB1 | HTA11_83_2000001011 | Human | Colorectum | SER | 4.25e-05 | 2.96e-01 | -0.1526 |
| 55611 | OTUB1 | HTA11_696_2000001011 | Human | Colorectum | AD | 2.88e-26 | 5.35e-01 | -0.1464 |
| 55611 | OTUB1 | HTA11_866_2000001011 | Human | Colorectum | AD | 8.57e-07 | 2.33e-01 | -0.1001 |
| 55611 | OTUB1 | HTA11_1391_2000001011 | Human | Colorectum | AD | 1.09e-20 | 5.78e-01 | -0.059 |
| 55611 | OTUB1 | HTA11_2992_2000001011 | Human | Colorectum | SER | 3.76e-06 | 5.67e-01 | -0.1706 |
| 55611 | OTUB1 | HTA11_5212_2000001011 | Human | Colorectum | AD | 1.49e-05 | 4.58e-01 | -0.2061 |
| 55611 | OTUB1 | HTA11_5216_2000001011 | Human | Colorectum | SER | 7.72e-06 | 5.77e-01 | -0.1462 |
| 55611 | OTUB1 | HTA11_546_2000001011 | Human | Colorectum | AD | 3.46e-11 | 4.06e-01 | -0.0842 |
| 55611 | OTUB1 | HTA11_7862_2000001011 | Human | Colorectum | AD | 2.38e-02 | 2.30e-01 | -0.0179 |
| 55611 | OTUB1 | HTA11_866_3004761011 | Human | Colorectum | AD | 3.59e-11 | 2.60e-01 | 0.096 |
| 55611 | OTUB1 | HTA11_10711_2000001011 | Human | Colorectum | AD | 1.91e-08 | 2.88e-01 | 0.0338 |
| 55611 | OTUB1 | HTA11_7696_3000711011 | Human | Colorectum | AD | 3.98e-13 | 3.73e-01 | 0.0674 |
| Page: 1 2 3 4 5 6 7 8 |
| Tissue | Expression Dynamics | Abbreviation |
| Colorectum (GSE201348) |  | FAP: Familial adenomatous polyposis |
| CRC: Colorectal cancer | ||
| Colorectum (HTA11) |  | AD: Adenomas |
| SER: Sessile serrated lesions | ||
| MSI-H: Microsatellite-high colorectal cancer | ||
| MSS: Microsatellite stable colorectal cancer | ||
| Esophagus | 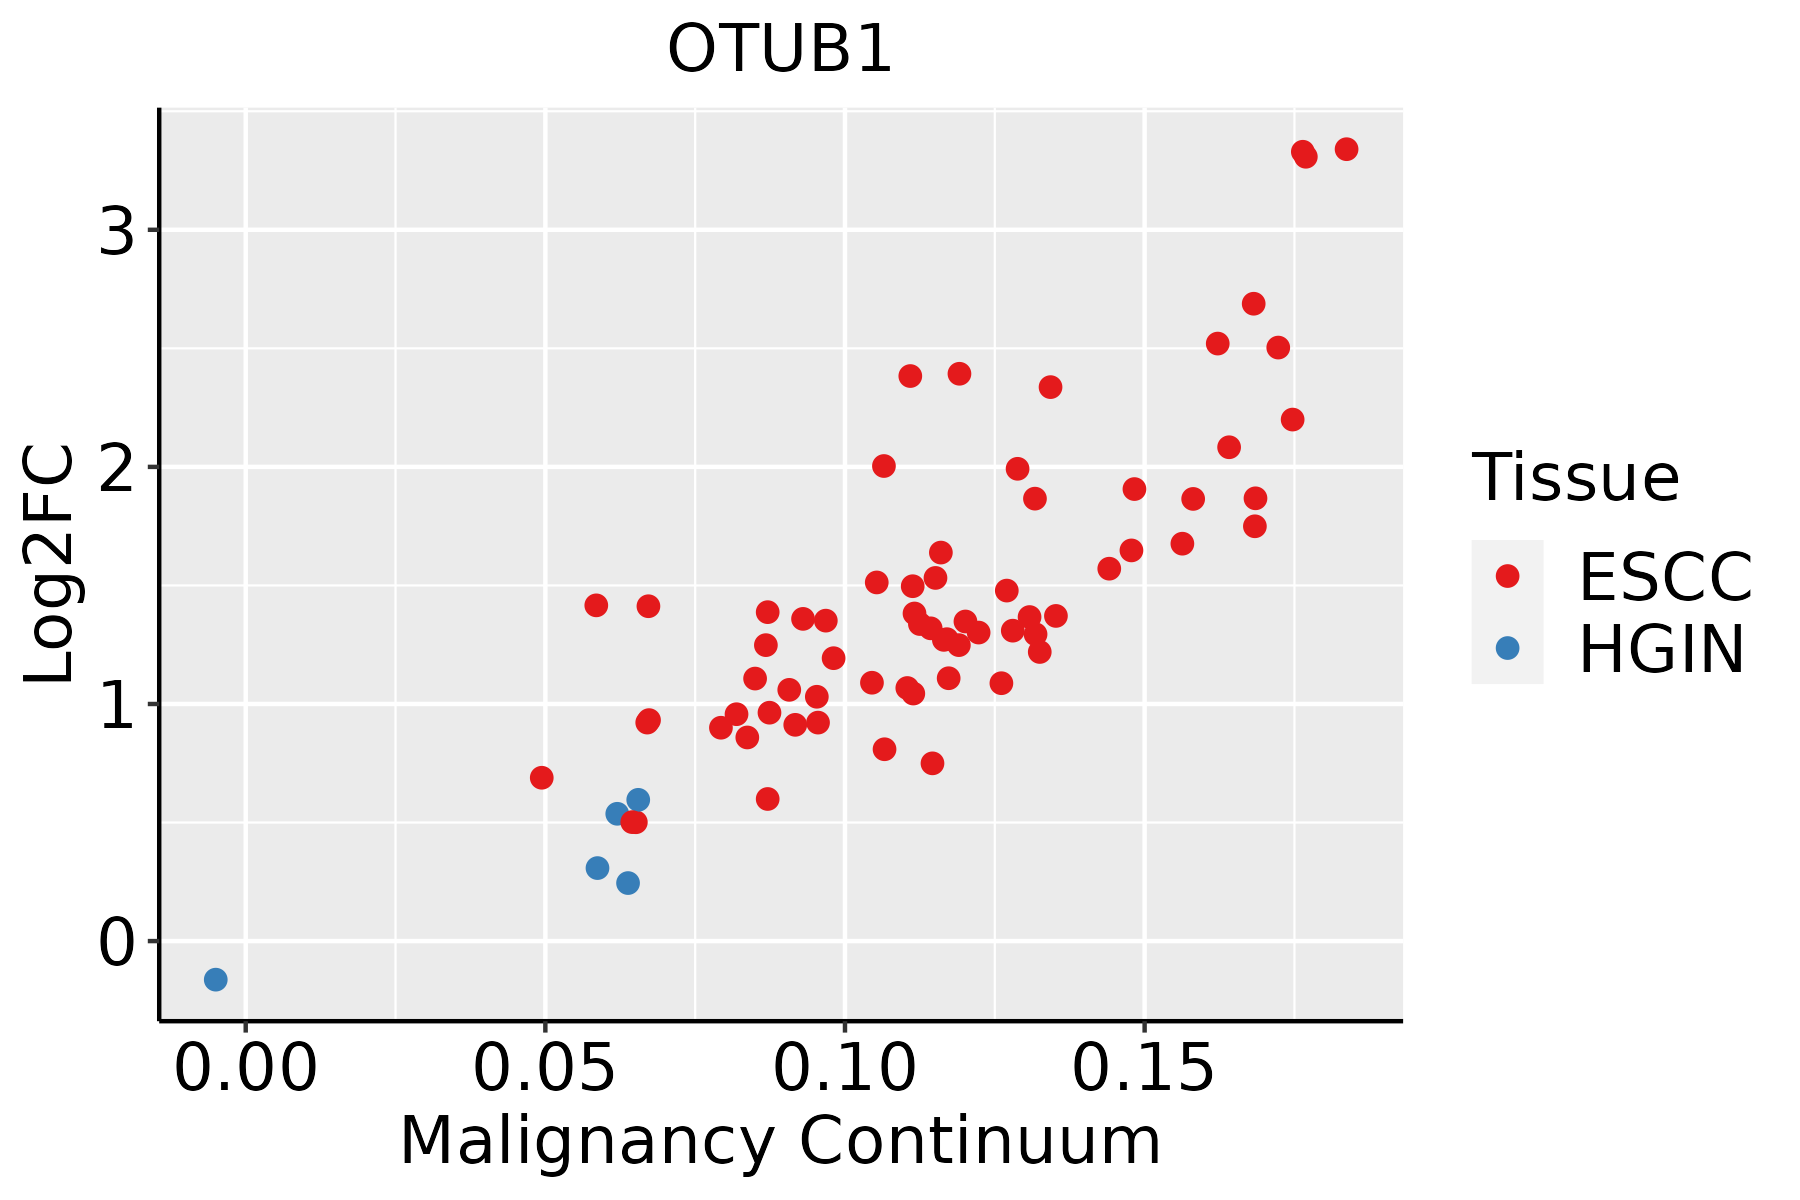 | ESCC: Esophageal squamous cell carcinoma |
| HGIN: High-grade intraepithelial neoplasias | ||
| LGIN: Low-grade intraepithelial neoplasias | ||
| Liver | 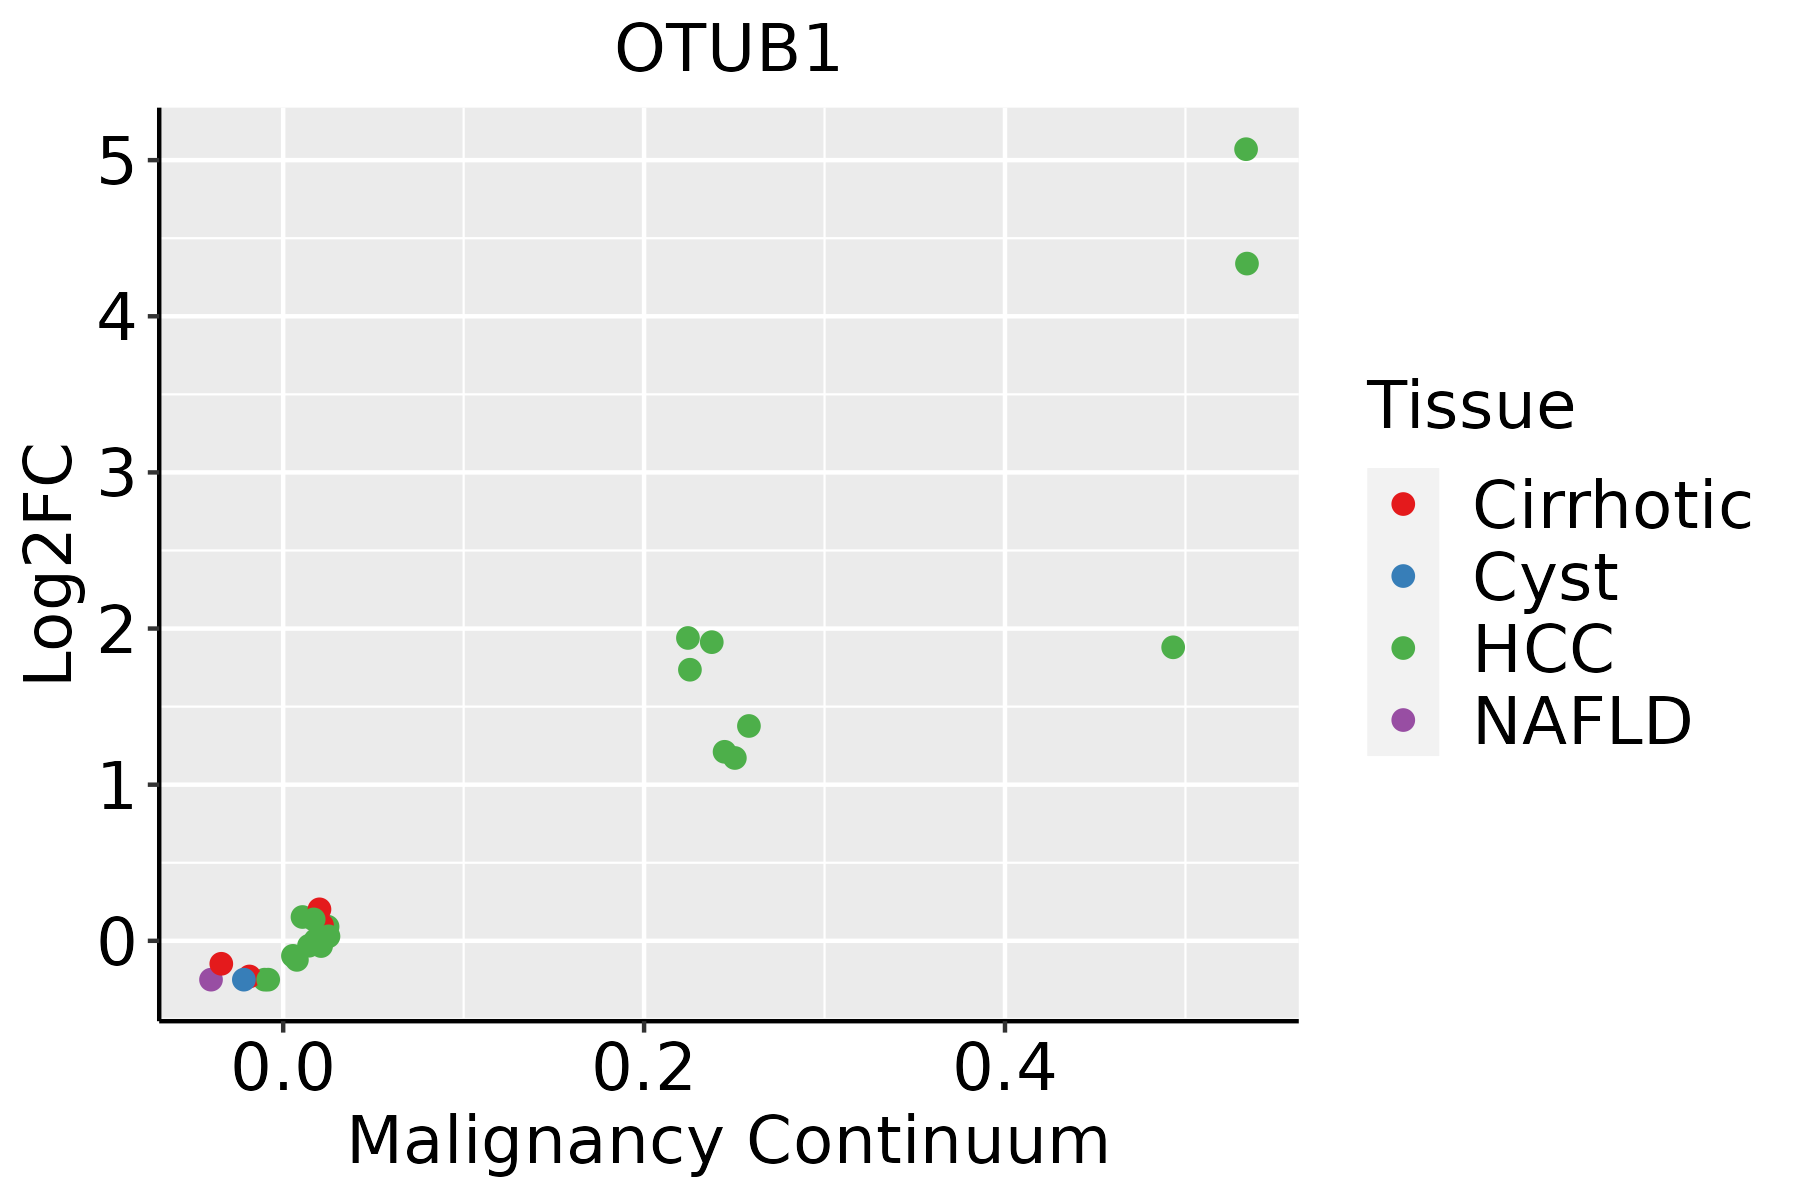 | HCC: Hepatocellular carcinoma |
| NAFLD: Non-alcoholic fatty liver disease | ||
| Oral Cavity |  | EOLP: Erosive Oral lichen planus |
| LP: leukoplakia | ||
| NEOLP: Non-erosive oral lichen planus | ||
| OSCC: Oral squamous cell carcinoma | ||
| Skin | 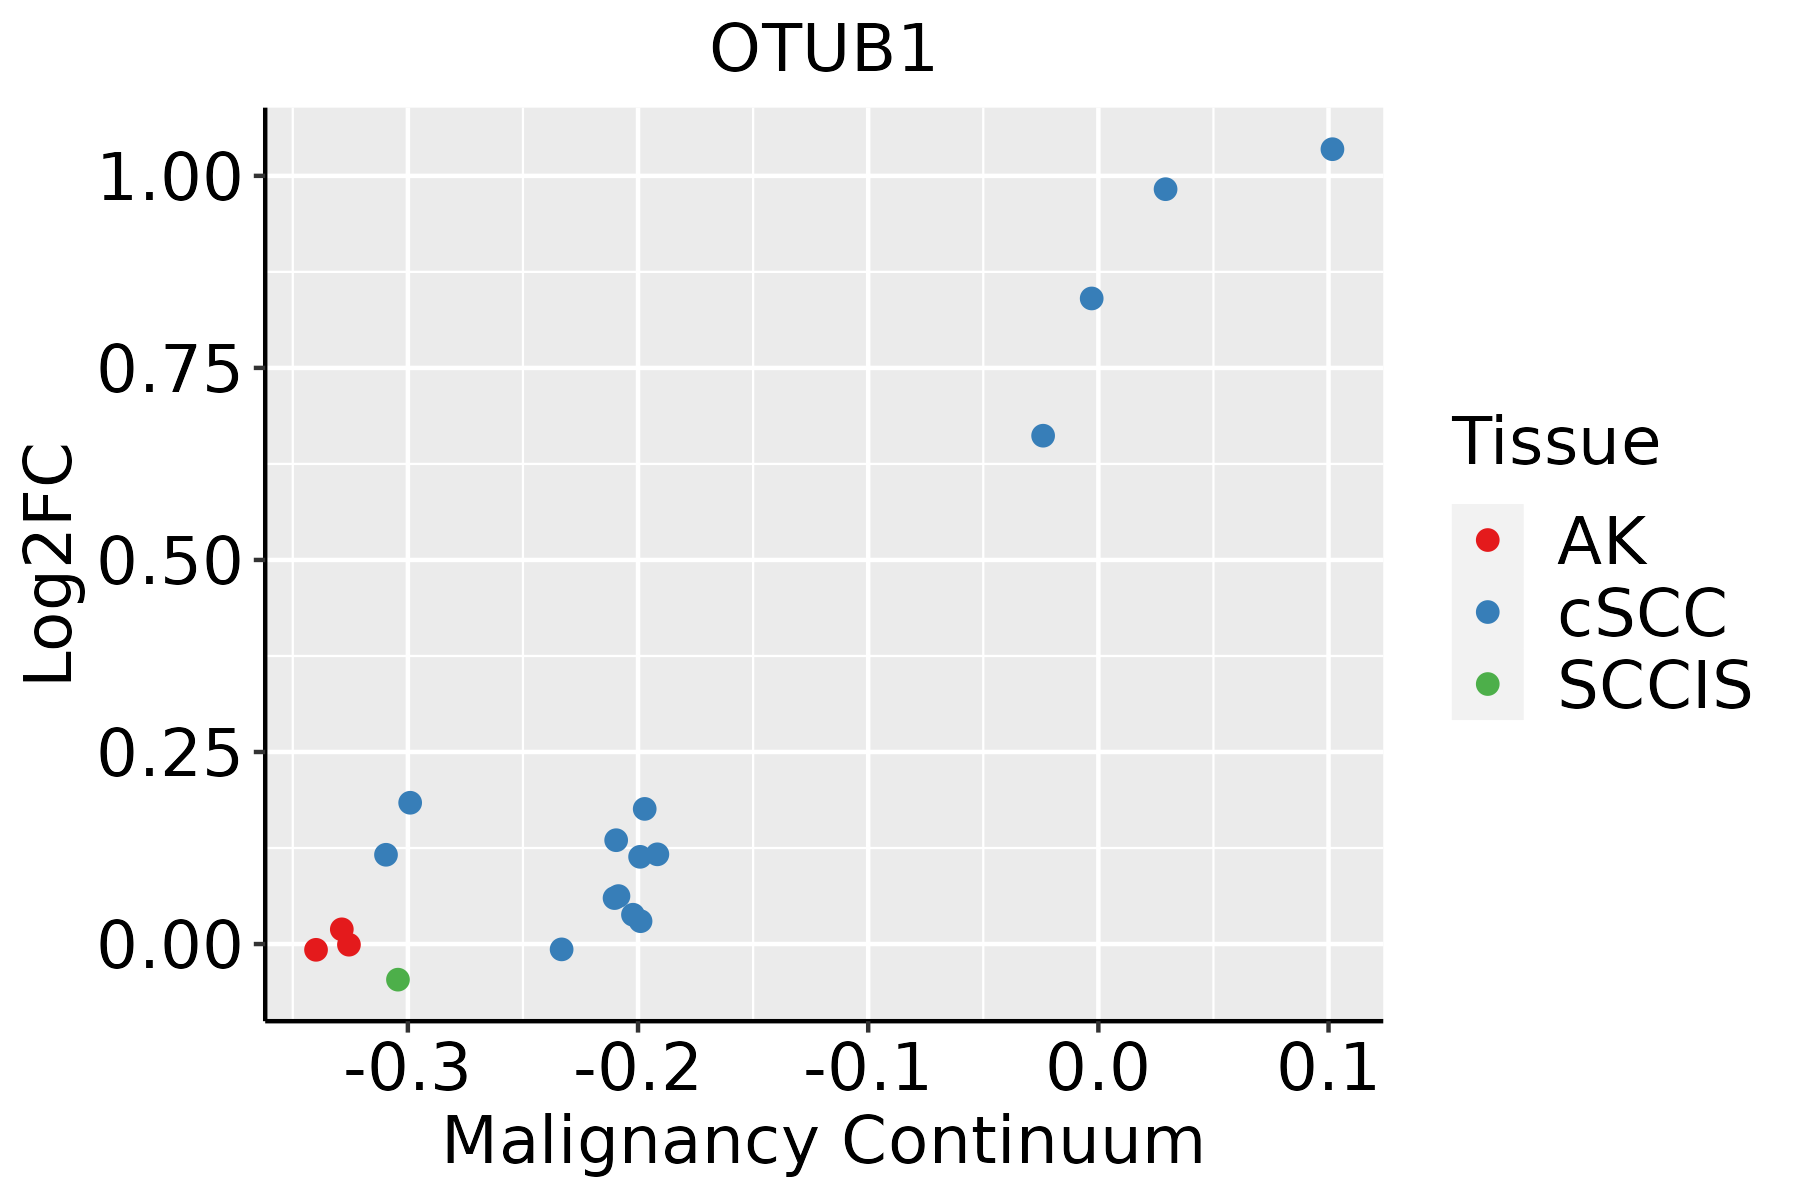 | AK: Actinic keratosis |
| cSCC: Cutaneous squamous cell carcinoma | ||
| SCCIS:squamous cell carcinoma in situ | ||
| Thyroid |  | ATC: Anaplastic thyroid cancer |
| HT: Hashimoto's thyroiditis | ||
| PTC: Papillary thyroid cancer |
| ∗log2FC in expression of this searched gene in stem-like cells from each diseased tissue sample relative to stem-like cells in normal samples in each tissue plotted against the malignancy continuum. Samples are colored based on if they are from different disease stage. |
Top |
Malignant transformation related pathway analysis |
| Find out the enriched GO biological processes and KEGG pathways involved in transition from healthy to precancer to cancer |
| Tissue | Disease Stage | Enriched GO biological Processes |
| Colorectum | AD |  |
| Colorectum | SER |  |
| Colorectum | MSS |  |
| Colorectum | MSI-H |  |
| Colorectum | FAP |  |
| ∗Top 15 enriched GO BP terms are showed in the bar plot of each disease state in each tissue. Each row represents a significant GO biological process which is colored according to the -log10(p.adjust). |
| Page: 1 2 3 4 5 6 7 8 9 |
| GO ID | Tissue | Disease Stage | Description | Gene Ratio | Bg Ratio | pvalue | p.adjust | Count |
| GO:1903320 | Colorectum | AD | regulation of protein modification by small protein conjugation or removal | 86/3918 | 242/18723 | 9.43e-08 | 4.65e-06 | 86 |
| GO:0051052 | Colorectum | AD | regulation of DNA metabolic process | 116/3918 | 359/18723 | 2.47e-07 | 1.00e-05 | 116 |
| GO:0031396 | Colorectum | AD | regulation of protein ubiquitination | 72/3918 | 210/18723 | 4.50e-06 | 1.21e-04 | 72 |
| GO:0000209 | Colorectum | AD | protein polyubiquitination | 78/3918 | 236/18723 | 8.71e-06 | 2.06e-04 | 78 |
| GO:0031397 | Colorectum | AD | negative regulation of protein ubiquitination | 34/3918 | 83/18723 | 2.66e-05 | 5.04e-04 | 34 |
| GO:2001020 | Colorectum | AD | regulation of response to DNA damage stimulus | 71/3918 | 219/18723 | 4.38e-05 | 7.65e-04 | 71 |
| GO:1903321 | Colorectum | AD | negative regulation of protein modification by small protein conjugation or removal | 37/3918 | 95/18723 | 4.49e-05 | 7.83e-04 | 37 |
| GO:0006282 | Colorectum | AD | regulation of DNA repair | 42/3918 | 130/18723 | 1.57e-03 | 1.32e-02 | 42 |
| GO:0033522 | Colorectum | AD | histone H2A ubiquitination | 12/3918 | 26/18723 | 3.47e-03 | 2.51e-02 | 12 |
| GO:0031056 | Colorectum | AD | regulation of histone modification | 45/3918 | 152/18723 | 7.05e-03 | 4.31e-02 | 45 |
| GO:0070534 | Colorectum | AD | protein K63-linked ubiquitination | 20/3918 | 56/18723 | 7.57e-03 | 4.58e-02 | 20 |
| GO:19033201 | Colorectum | SER | regulation of protein modification by small protein conjugation or removal | 70/2897 | 242/18723 | 6.84e-08 | 4.42e-06 | 70 |
| GO:00313961 | Colorectum | SER | regulation of protein ubiquitination | 62/2897 | 210/18723 | 1.69e-07 | 9.71e-06 | 62 |
| GO:00313971 | Colorectum | SER | negative regulation of protein ubiquitination | 29/2897 | 83/18723 | 9.72e-06 | 3.22e-04 | 29 |
| GO:19033211 | Colorectum | SER | negative regulation of protein modification by small protein conjugation or removal | 30/2897 | 95/18723 | 6.29e-05 | 1.46e-03 | 30 |
| GO:00510521 | Colorectum | SER | regulation of DNA metabolic process | 83/2897 | 359/18723 | 8.03e-05 | 1.77e-03 | 83 |
| GO:00002091 | Colorectum | SER | protein polyubiquitination | 58/2897 | 236/18723 | 1.69e-04 | 3.18e-03 | 58 |
| GO:00310561 | Colorectum | SER | regulation of histone modification | 37/2897 | 152/18723 | 2.80e-03 | 2.50e-02 | 37 |
| GO:20010201 | Colorectum | SER | regulation of response to DNA damage stimulus | 49/2897 | 219/18723 | 4.24e-03 | 3.45e-02 | 49 |
| GO:19033202 | Colorectum | MSS | regulation of protein modification by small protein conjugation or removal | 82/3467 | 242/18723 | 7.49e-09 | 4.63e-07 | 82 |
| Page: 1 2 3 4 5 6 7 8 9 10 11 |
| Pathway ID | Tissue | Disease Stage | Description | Gene Ratio | Bg Ratio | pvalue | p.adjust | qvalue | Count |
| Page: 1 |
Top |
Cell-cell communication analysis |
| Identification of potential cell-cell interactions between two cell types and their ligand-receptor pairs for different disease states |
| Ligand | Receptor | LRpair | Pathway | Tissue | Disease Stage |
| Page: 1 |
Top |
Single-cell gene regulatory network inference analysis |
| Find out the significant the regulons (TFs) and the target genes of each regulon across cell types for different disease states |
| TF | Cell Type | Tissue | Disease Stage | Target Gene | RSS | Regulon Activity |
| ∗The dot plots of a searched regulon are shown for all cell subpopulations in each disease state of each tissue based on the regulon specific score inferred using pySCENIC and by calculating the average expression. |
| Page: 1 |
Top |
Somatic mutation of malignant transformation related genes |
| Annotation of somatic variants for genes involved in malignant transformation |
| Hugo Symbol | Variant Class | Variant Classification | dbSNP RS | HGVSc | HGVSp | HGVSp Short | SWISSPROT | BIOTYPE | SIFT | PolyPhen | Tumor Sample Barcode | Tissue | Histology | Sex | Age | Stage | Therapy Types | Drugs | Outcome |
| OTUB1 | SNV | Missense_Mutation | c.404T>C | p.Ile135Thr | p.I135T | Q96FW1 | protein_coding | tolerated(0.08) | possibly_damaging(0.811) | TCGA-D8-A27L-01 | Breast | breast invasive carcinoma | Female | <65 | III/IV | Chemotherapy | adriamycin+cuclophosphamide | SD | |
| OTUB1 | SNV | Missense_Mutation | rs745390279 | c.556G>A | p.Glu186Lys | p.E186K | Q96FW1 | protein_coding | tolerated(0.18) | benign(0.076) | TCGA-LD-A74U-01 | Breast | breast invasive carcinoma | Female | >=65 | III/IV | Chemotherapy | taxotere | SD |
| OTUB1 | insertion | Frame_Shift_Ins | novel | c.138_139insGTAACATACCTGCTTCCAGATTCTAAGC | p.Leu47ValfsTer26 | p.L47Vfs*26 | Q96FW1 | protein_coding | TCGA-A8-A09K-01 | Breast | breast invasive carcinoma | Female | >=65 | I/II | Unknown | Unknown | SD | ||
| OTUB1 | deletion | Frame_Shift_Del | novel | c.667delN | p.Leu223TrpfsTer164 | p.L223Wfs*164 | Q96FW1 | protein_coding | TCGA-D8-A27V-01 | Breast | breast invasive carcinoma | Female | <65 | I/II | Hormone Therapy | tamoxiphen | SD | ||
| OTUB1 | SNV | Missense_Mutation | c.428N>C | p.Met143Thr | p.M143T | Q96FW1 | protein_coding | deleterious(0) | probably_damaging(0.988) | TCGA-AM-5821-01 | Colorectum | colon adenocarcinoma | Female | >=65 | I/II | Unknown | Unknown | SD | |
| OTUB1 | SNV | Missense_Mutation | c.463N>C | p.Val155Leu | p.V155L | Q96FW1 | protein_coding | tolerated(1) | benign(0) | TCGA-AY-6197-01 | Colorectum | colon adenocarcinoma | Male | <65 | I/II | Unknown | Unknown | SD | |
| OTUB1 | SNV | Missense_Mutation | c.280C>T | p.Arg94Trp | p.R94W | Q96FW1 | protein_coding | deleterious(0) | probably_damaging(1) | TCGA-D5-6927-01 | Colorectum | colon adenocarcinoma | Male | <65 | I/II | Unknown | Unknown | SD | |
| OTUB1 | SNV | Missense_Mutation | rs756050985 | c.592C>T | p.Arg198Trp | p.R198W | Q96FW1 | protein_coding | tolerated(0.05) | benign(0.017) | TCGA-G4-6628-01 | Colorectum | colon adenocarcinoma | Male | >=65 | I/II | Unknown | Unknown | SD |
| OTUB1 | SNV | Missense_Mutation | novel | c.527N>A | p.Arg176Gln | p.R176Q | Q96FW1 | protein_coding | deleterious(0) | probably_damaging(1) | TCGA-A5-A0G2-01 | Endometrium | uterine corpus endometrioid carcinoma | Female | <65 | III/IV | Unknown | Unknown | SD |
| OTUB1 | SNV | Missense_Mutation | rs147019398 | c.337N>T | p.Arg113Trp | p.R113W | Q96FW1 | protein_coding | deleterious(0) | probably_damaging(0.981) | TCGA-AP-A051-01 | Endometrium | uterine corpus endometrioid carcinoma | Female | >=65 | I/II | Unknown | Unknown | SD |
| Page: 1 2 3 |
Top |
Related drugs of malignant transformation related genes |
| Identification of chemicals and drugs interact with genes involved in malignant transfromation |
| (DGIdb 4.0) |
| Entrez ID | Symbol | Category | Interaction Types | Drug Claim Name | Drug Name | PMIDs |
| Page: 1 |

Copyright 2023-Present -The University of Texas Health Science Center at Houston |