
|
|||||
|
 | |
| |
| |
| |
| |
| |
|
Gene: OSTM1 |
Gene summary for OSTM1 |
| Gene information | Species | Human | Gene symbol | OSTM1 | Gene ID | 28962 |
| Gene name | osteoclastogenesis associated transmembrane protein 1 | |
| Gene Alias | GIPN | |
| Cytomap | 6q21 | |
| Gene Type | protein-coding | GO ID | GO:0002376 | UniProtAcc | Q86WC4 |
Top |
Malignant transformation analysis |
| Identification of the aberrant gene expression in precancerous and cancerous lesions by comparing the gene expression of stem-like cells in diseased tissues with normal stem cells |
| Entrez ID | Symbol | Replicates | Species | Organ | Tissue | Adj P-value | Log2FC | Malignancy |
| 28962 | OSTM1 | LZE4T | Human | Esophagus | ESCC | 1.14e-12 | 3.22e-01 | 0.0811 |
| 28962 | OSTM1 | LZE24T | Human | Esophagus | ESCC | 3.97e-08 | 3.56e-01 | 0.0596 |
| 28962 | OSTM1 | P2T-E | Human | Esophagus | ESCC | 6.29e-21 | 3.61e-01 | 0.1177 |
| 28962 | OSTM1 | P4T-E | Human | Esophagus | ESCC | 3.87e-18 | 3.22e-01 | 0.1323 |
| 28962 | OSTM1 | P5T-E | Human | Esophagus | ESCC | 3.12e-12 | 2.55e-01 | 0.1327 |
| 28962 | OSTM1 | P8T-E | Human | Esophagus | ESCC | 4.36e-07 | 1.45e-01 | 0.0889 |
| 28962 | OSTM1 | P9T-E | Human | Esophagus | ESCC | 1.95e-08 | 1.45e-01 | 0.1131 |
| 28962 | OSTM1 | P10T-E | Human | Esophagus | ESCC | 7.68e-17 | 4.40e-01 | 0.116 |
| 28962 | OSTM1 | P11T-E | Human | Esophagus | ESCC | 4.49e-13 | 5.65e-01 | 0.1426 |
| 28962 | OSTM1 | P12T-E | Human | Esophagus | ESCC | 2.68e-13 | 2.19e-01 | 0.1122 |
| 28962 | OSTM1 | P15T-E | Human | Esophagus | ESCC | 5.30e-13 | 4.36e-01 | 0.1149 |
| 28962 | OSTM1 | P16T-E | Human | Esophagus | ESCC | 8.04e-18 | 3.33e-01 | 0.1153 |
| 28962 | OSTM1 | P19T-E | Human | Esophagus | ESCC | 5.22e-06 | 4.96e-01 | 0.1662 |
| 28962 | OSTM1 | P20T-E | Human | Esophagus | ESCC | 3.57e-08 | 2.43e-01 | 0.1124 |
| 28962 | OSTM1 | P21T-E | Human | Esophagus | ESCC | 1.33e-33 | 7.11e-01 | 0.1617 |
| 28962 | OSTM1 | P22T-E | Human | Esophagus | ESCC | 4.46e-10 | 1.77e-01 | 0.1236 |
| 28962 | OSTM1 | P23T-E | Human | Esophagus | ESCC | 2.45e-20 | 4.50e-01 | 0.108 |
| 28962 | OSTM1 | P24T-E | Human | Esophagus | ESCC | 8.17e-11 | 2.70e-01 | 0.1287 |
| 28962 | OSTM1 | P26T-E | Human | Esophagus | ESCC | 3.70e-15 | 3.16e-01 | 0.1276 |
| 28962 | OSTM1 | P27T-E | Human | Esophagus | ESCC | 1.28e-12 | 1.56e-01 | 0.1055 |
| Page: 1 2 3 4 5 |
| Tissue | Expression Dynamics | Abbreviation |
| Esophagus | 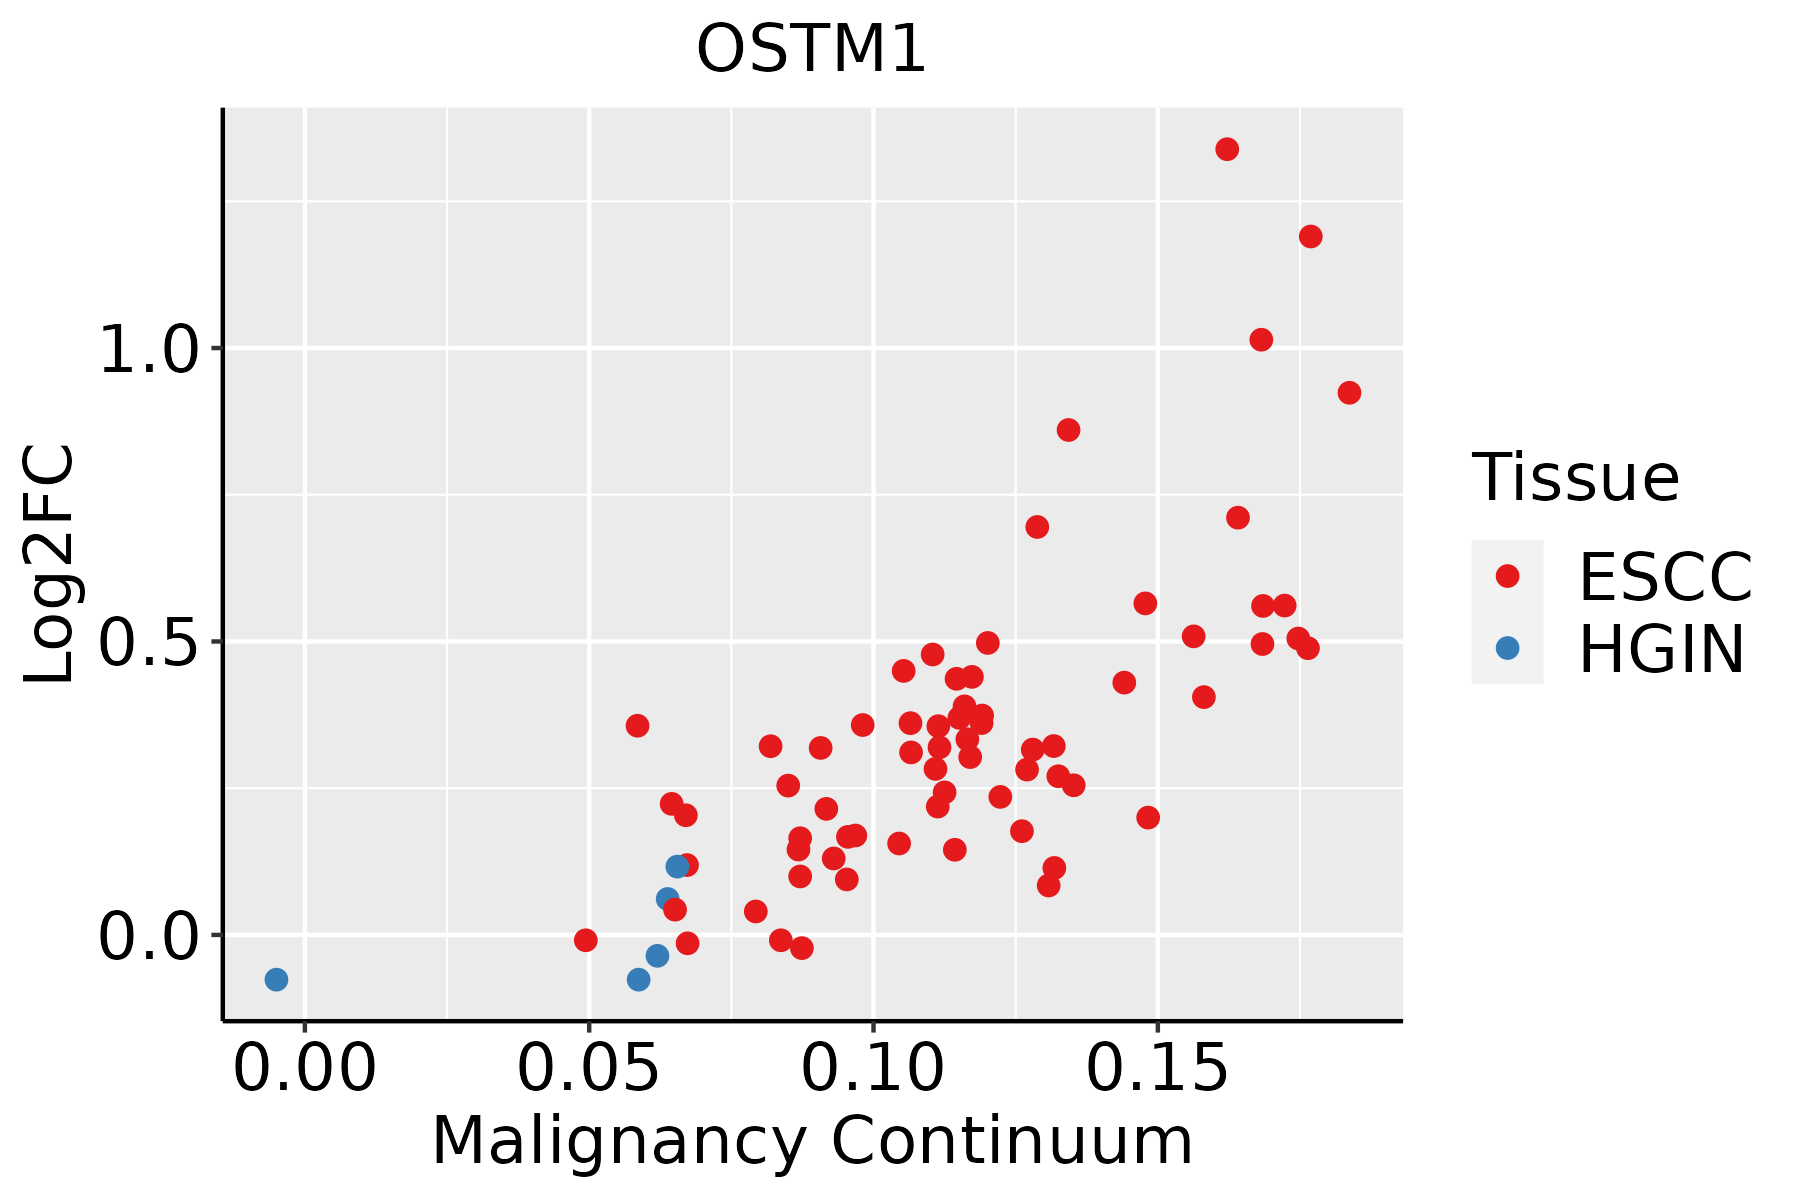 | ESCC: Esophageal squamous cell carcinoma |
| HGIN: High-grade intraepithelial neoplasias | ||
| LGIN: Low-grade intraepithelial neoplasias | ||
| Liver |  | HCC: Hepatocellular carcinoma |
| NAFLD: Non-alcoholic fatty liver disease | ||
| Oral Cavity | 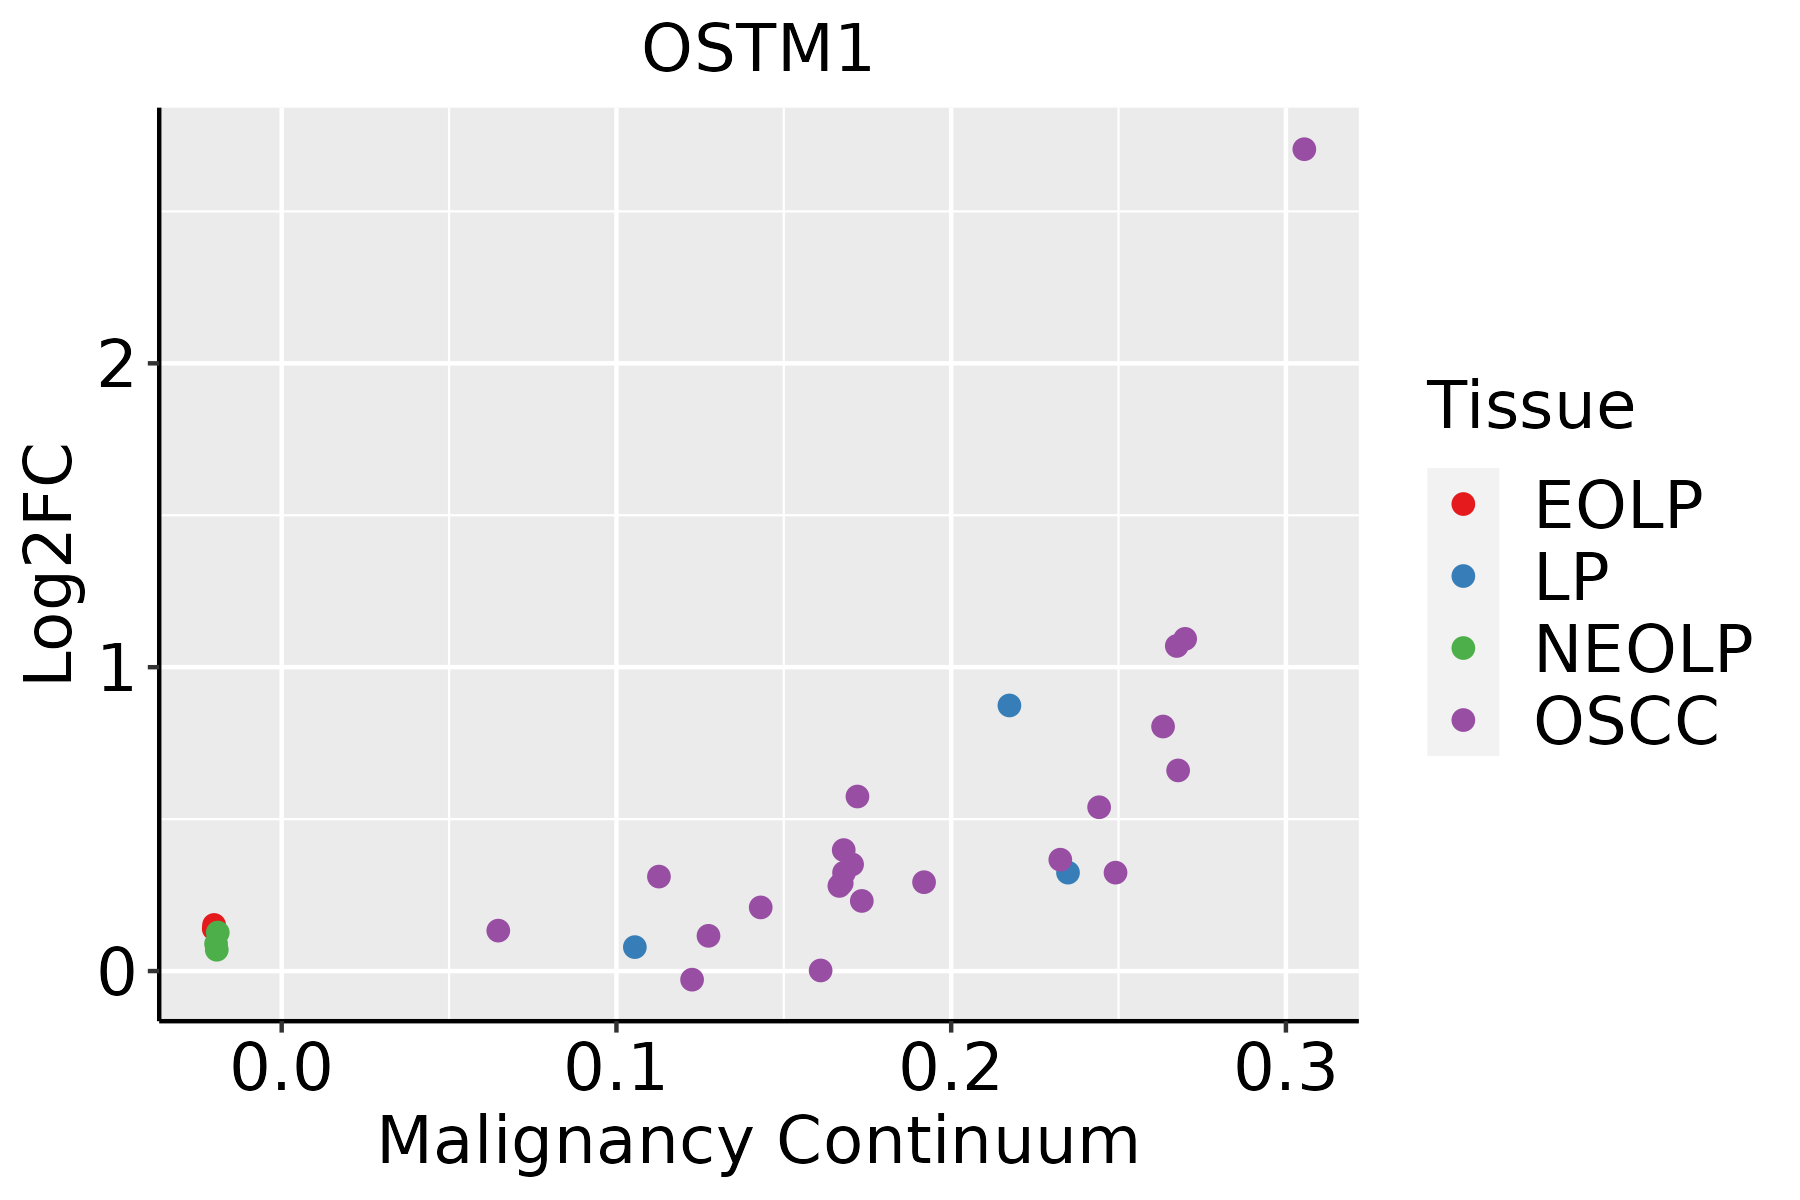 | EOLP: Erosive Oral lichen planus |
| LP: leukoplakia | ||
| NEOLP: Non-erosive oral lichen planus | ||
| OSCC: Oral squamous cell carcinoma | ||
| Skin | 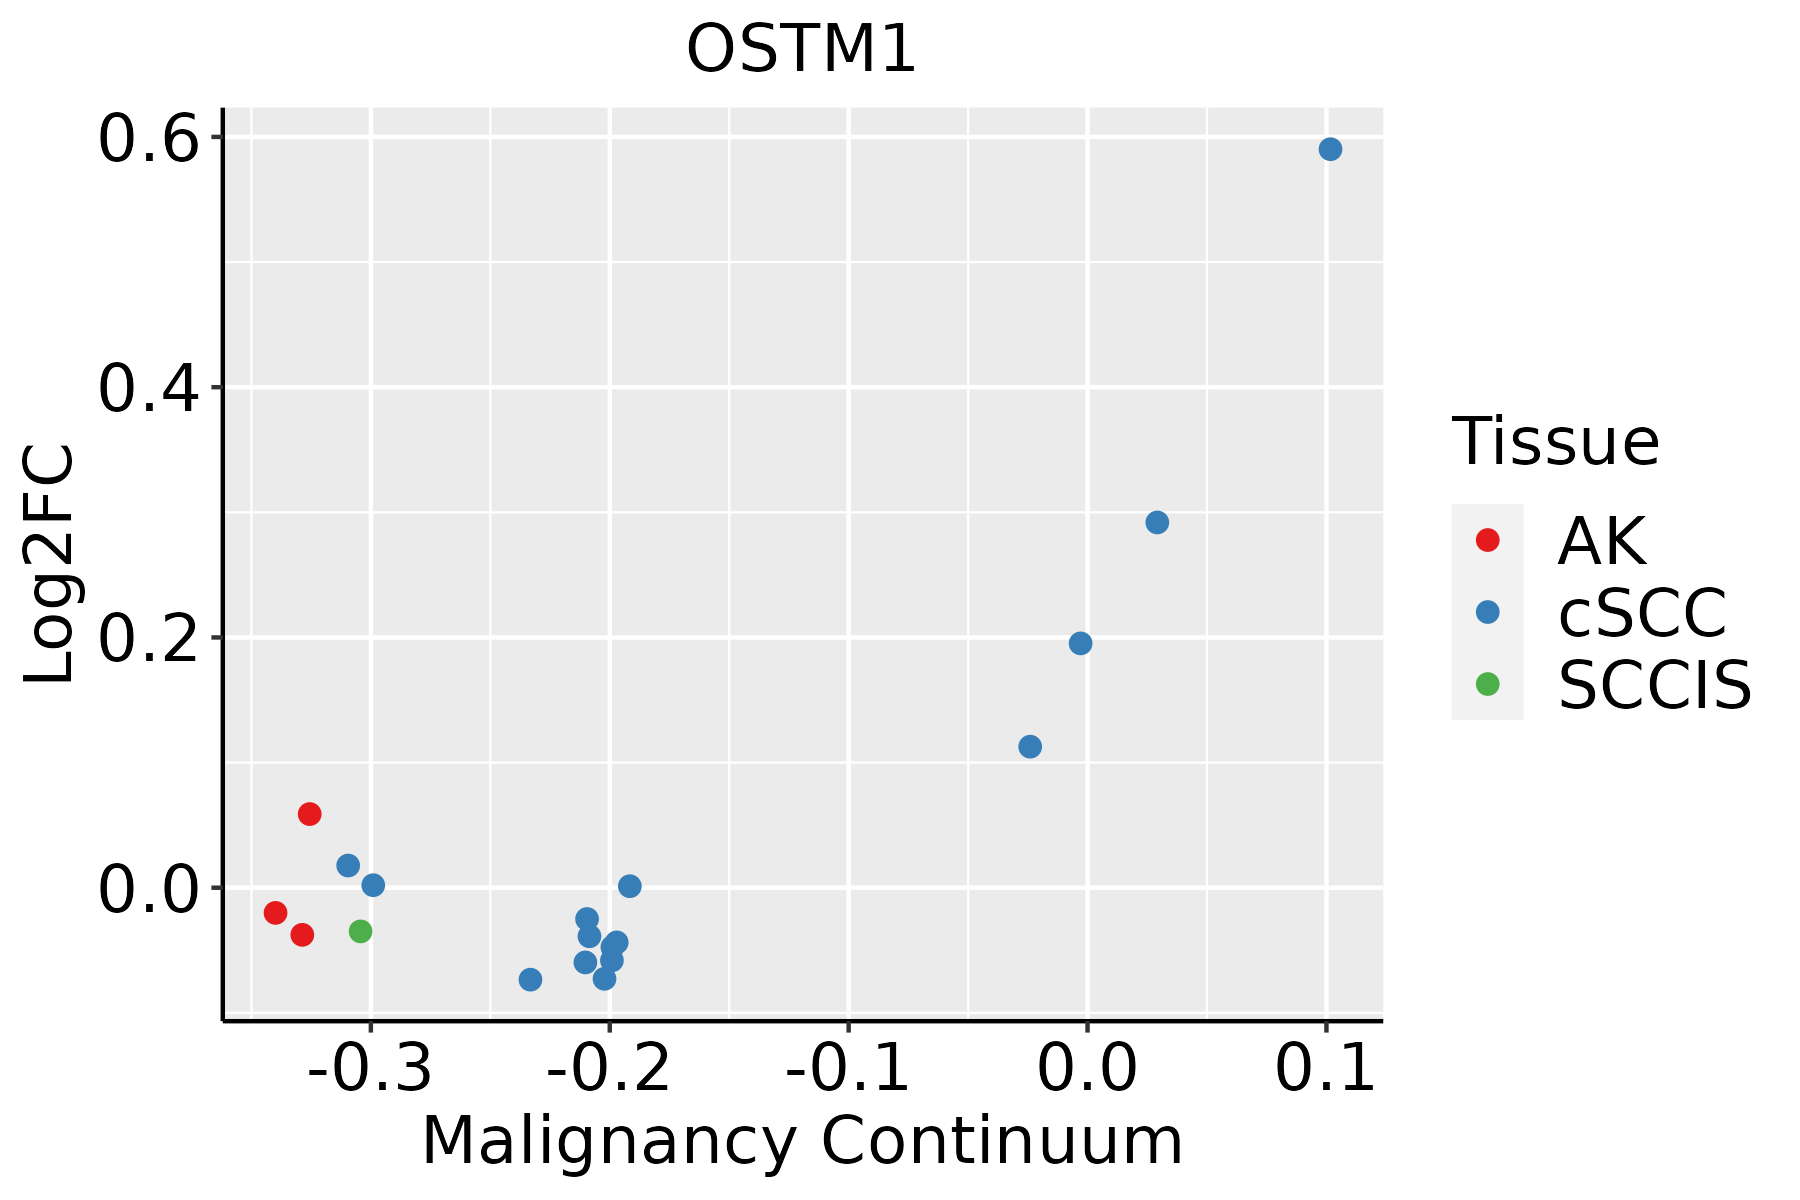 | AK: Actinic keratosis |
| cSCC: Cutaneous squamous cell carcinoma | ||
| SCCIS:squamous cell carcinoma in situ | ||
| Thyroid |  | ATC: Anaplastic thyroid cancer |
| HT: Hashimoto's thyroiditis | ||
| PTC: Papillary thyroid cancer |
| ∗log2FC in expression of this searched gene in stem-like cells from each diseased tissue sample relative to stem-like cells in normal samples in each tissue plotted against the malignancy continuum. Samples are colored based on if they are from different disease stage. |
Top |
Malignant transformation related pathway analysis |
| Find out the enriched GO biological processes and KEGG pathways involved in transition from healthy to precancer to cancer |
| Tissue | Disease Stage | Enriched GO biological Processes |
| Colorectum | AD |  |
| Colorectum | SER |  |
| Colorectum | MSS |  |
| Colorectum | MSI-H |  |
| Colorectum | FAP |  |
| ∗Top 15 enriched GO BP terms are showed in the bar plot of each disease state in each tissue. Each row represents a significant GO biological process which is colored according to the -log10(p.adjust). |
| Page: 1 2 3 4 5 6 7 8 9 |
| GO ID | Tissue | Disease Stage | Description | Gene Ratio | Bg Ratio | pvalue | p.adjust | Count |
| GO:0030099111 | Esophagus | ESCC | myeloid cell differentiation | 232/8552 | 381/18723 | 1.22e-09 | 2.90e-08 | 232 |
| GO:000257317 | Esophagus | ESCC | myeloid leukocyte differentiation | 128/8552 | 208/18723 | 2.75e-06 | 3.15e-05 | 128 |
| GO:00303165 | Esophagus | ESCC | osteoclast differentiation | 54/8552 | 94/18723 | 1.43e-02 | 4.65e-02 | 54 |
| GO:003009922 | Liver | HCC | myeloid cell differentiation | 200/7958 | 381/18723 | 4.64e-05 | 4.49e-04 | 200 |
| GO:003009920 | Oral cavity | OSCC | myeloid cell differentiation | 213/7305 | 381/18723 | 1.24e-11 | 4.42e-10 | 213 |
| GO:000257310 | Oral cavity | OSCC | myeloid leukocyte differentiation | 119/7305 | 208/18723 | 7.29e-08 | 1.29e-06 | 119 |
| GO:00303164 | Oral cavity | OSCC | osteoclast differentiation | 48/7305 | 94/18723 | 1.16e-02 | 3.92e-02 | 48 |
| GO:003009926 | Oral cavity | EOLP | myeloid cell differentiation | 91/2218 | 381/18723 | 2.87e-11 | 4.15e-09 | 91 |
| GO:000257323 | Oral cavity | EOLP | myeloid leukocyte differentiation | 48/2218 | 208/18723 | 3.71e-06 | 7.88e-05 | 48 |
| GO:003009932 | Oral cavity | NEOLP | myeloid cell differentiation | 83/2005 | 381/18723 | 1.79e-10 | 1.69e-08 | 83 |
| GO:000257331 | Oral cavity | NEOLP | myeloid leukocyte differentiation | 41/2005 | 208/18723 | 8.21e-05 | 1.03e-03 | 41 |
| GO:003009929 | Skin | cSCC | myeloid cell differentiation | 146/4864 | 381/18723 | 6.38e-08 | 1.61e-06 | 146 |
| GO:000257324 | Skin | cSCC | myeloid leukocyte differentiation | 76/4864 | 208/18723 | 4.75e-04 | 3.60e-03 | 76 |
| GO:0030099113 | Thyroid | PTC | myeloid cell differentiation | 160/5968 | 381/18723 | 1.75e-05 | 1.82e-04 | 160 |
| GO:003009933 | Thyroid | ATC | myeloid cell differentiation | 170/6293 | 381/18723 | 4.26e-06 | 4.68e-05 | 170 |
| GO:0002573110 | Thyroid | ATC | myeloid leukocyte differentiation | 86/6293 | 208/18723 | 1.15e-02 | 4.11e-02 | 86 |
| Page: 1 |
| Pathway ID | Tissue | Disease Stage | Description | Gene Ratio | Bg Ratio | pvalue | p.adjust | qvalue | Count |
| Page: 1 |
Top |
Cell-cell communication analysis |
| Identification of potential cell-cell interactions between two cell types and their ligand-receptor pairs for different disease states |
| Ligand | Receptor | LRpair | Pathway | Tissue | Disease Stage |
| Page: 1 |
Top |
Single-cell gene regulatory network inference analysis |
| Find out the significant the regulons (TFs) and the target genes of each regulon across cell types for different disease states |
| TF | Cell Type | Tissue | Disease Stage | Target Gene | RSS | Regulon Activity |
| ∗The dot plots of a searched regulon are shown for all cell subpopulations in each disease state of each tissue based on the regulon specific score inferred using pySCENIC and by calculating the average expression. |
| Page: 1 |
Top |
Somatic mutation of malignant transformation related genes |
| Annotation of somatic variants for genes involved in malignant transformation |
| Hugo Symbol | Variant Class | Variant Classification | dbSNP RS | HGVSc | HGVSp | HGVSp Short | SWISSPROT | BIOTYPE | SIFT | PolyPhen | Tumor Sample Barcode | Tissue | Histology | Sex | Age | Stage | Therapy Types | Drugs | Outcome |
| OSTM1 | SNV | Missense_Mutation | c.181N>A | p.Ser61Thr | p.S61T | Q86WC4 | protein_coding | tolerated(0.33) | benign(0) | TCGA-CK-4951-01 | Colorectum | colon adenocarcinoma | Female | >=65 | I/II | Unknown | Unknown | PD | |
| OSTM1 | insertion | Frame_Shift_Ins | novel | c.721_722insA | p.Met241AsnfsTer3 | p.M241Nfs*3 | Q86WC4 | protein_coding | TCGA-AZ-6598-01 | Colorectum | colon adenocarcinoma | Female | >=65 | I/II | Unknown | Unknown | SD | ||
| OSTM1 | insertion | Frame_Shift_Ins | novel | c.721dupA | p.Met241AsnfsTer3 | p.M241Nfs*3 | Q86WC4 | protein_coding | TCGA-CM-6171-01 | Colorectum | colon adenocarcinoma | Female | >=65 | I/II | Unknown | Unknown | SD | ||
| OSTM1 | SNV | Missense_Mutation | novel | c.472N>A | p.Leu158Ile | p.L158I | Q86WC4 | protein_coding | deleterious(0.03) | benign(0.046) | TCGA-AJ-A5DW-01 | Endometrium | uterine corpus endometrioid carcinoma | Female | <65 | I/II | Unknown | Unknown | SD |
| OSTM1 | SNV | Missense_Mutation | c.479N>G | p.Glu160Gly | p.E160G | Q86WC4 | protein_coding | tolerated(0.09) | benign(0.421) | TCGA-AP-A051-01 | Endometrium | uterine corpus endometrioid carcinoma | Female | >=65 | I/II | Unknown | Unknown | SD | |
| OSTM1 | SNV | Missense_Mutation | novel | c.541G>A | p.Glu181Lys | p.E181K | Q86WC4 | protein_coding | tolerated(0.44) | benign(0.425) | TCGA-AP-A1DV-01 | Endometrium | uterine corpus endometrioid carcinoma | Female | <65 | I/II | Unknown | Unknown | SD |
| OSTM1 | SNV | Missense_Mutation | novel | c.643A>C | p.Lys215Gln | p.K215Q | Q86WC4 | protein_coding | tolerated(0.17) | benign(0.122) | TCGA-AP-A1E0-01 | Endometrium | uterine corpus endometrioid carcinoma | Female | <65 | III/IV | Chemotherapy | paclitaxel | SD |
| OSTM1 | SNV | Missense_Mutation | novel | c.955N>T | p.Arg319Cys | p.R319C | Q86WC4 | protein_coding | deleterious(0) | probably_damaging(0.999) | TCGA-AX-A1CE-01 | Endometrium | uterine corpus endometrioid carcinoma | Female | <65 | I/II | Unspecific | Paclitaxel | SD |
| OSTM1 | SNV | Missense_Mutation | novel | c.757N>T | p.His253Tyr | p.H253Y | Q86WC4 | protein_coding | deleterious(0.03) | possibly_damaging(0.857) | TCGA-AX-A1CE-01 | Endometrium | uterine corpus endometrioid carcinoma | Female | <65 | I/II | Unspecific | Paclitaxel | SD |
| OSTM1 | SNV | Missense_Mutation | novel | c.887C>A | p.Pro296His | p.P296H | Q86WC4 | protein_coding | deleterious(0) | probably_damaging(1) | TCGA-B5-A1MX-01 | Endometrium | uterine corpus endometrioid carcinoma | Female | <65 | I/II | Hormone Therapy | megace | SD |
| Page: 1 2 3 |
Top |
Related drugs of malignant transformation related genes |
| Identification of chemicals and drugs interact with genes involved in malignant transfromation |
| (DGIdb 4.0) |
| Entrez ID | Symbol | Category | Interaction Types | Drug Claim Name | Drug Name | PMIDs |
| Page: 1 |

Copyright 2023-Present -The University of Texas Health Science Center at Houston |