
|
|||||
|
 | |
| |
| |
| |
| |
| |
|
Gene: OST4 |
Gene summary for OST4 |
| Gene information | Species | Human | Gene symbol | OST4 | Gene ID | 100128731 |
| Gene name | oligosaccharyltransferase complex subunit 4, non-catalytic | |
| Gene Alias | OST4 | |
| Cytomap | 2p23.3 | |
| Gene Type | protein-coding | GO ID | GO:0006464 | UniProtAcc | P0C6T2 |
Top |
Malignant transformation analysis |
| Identification of the aberrant gene expression in precancerous and cancerous lesions by comparing the gene expression of stem-like cells in diseased tissues with normal stem cells |
| Entrez ID | Symbol | Replicates | Species | Organ | Tissue | Adj P-value | Log2FC | Malignancy |
| 100128731 | OST4 | GSM4909280 | Human | Breast | Precancer | 1.21e-03 | -6.57e-01 | 0.0305 |
| 100128731 | OST4 | GSM4909282 | Human | Breast | IDC | 2.55e-02 | -2.71e-01 | -0.0288 |
| 100128731 | OST4 | GSM4909285 | Human | Breast | IDC | 3.04e-32 | 4.49e-01 | 0.21 |
| 100128731 | OST4 | GSM4909286 | Human | Breast | IDC | 5.96e-03 | 4.19e-02 | 0.1081 |
| 100128731 | OST4 | GSM4909287 | Human | Breast | IDC | 1.51e-02 | -2.37e-01 | 0.2057 |
| 100128731 | OST4 | GSM4909288 | Human | Breast | IDC | 8.40e-06 | -4.61e-01 | 0.0988 |
| 100128731 | OST4 | GSM4909290 | Human | Breast | IDC | 3.19e-16 | 3.92e-01 | 0.2096 |
| 100128731 | OST4 | GSM4909291 | Human | Breast | IDC | 4.82e-03 | 2.29e-01 | 0.1753 |
| 100128731 | OST4 | GSM4909293 | Human | Breast | IDC | 2.36e-04 | -3.47e-02 | 0.1581 |
| 100128731 | OST4 | GSM4909294 | Human | Breast | IDC | 2.80e-06 | -6.22e-02 | 0.2022 |
| 100128731 | OST4 | GSM4909295 | Human | Breast | IDC | 2.99e-02 | 1.85e-01 | 0.0898 |
| 100128731 | OST4 | GSM4909296 | Human | Breast | IDC | 1.79e-17 | 1.41e-01 | 0.1524 |
| 100128731 | OST4 | GSM4909297 | Human | Breast | IDC | 2.62e-22 | -1.95e-01 | 0.1517 |
| 100128731 | OST4 | GSM4909298 | Human | Breast | IDC | 4.70e-03 | 1.83e-01 | 0.1551 |
| 100128731 | OST4 | GSM4909299 | Human | Breast | IDC | 1.56e-03 | 1.71e-01 | 0.035 |
| 100128731 | OST4 | GSM4909301 | Human | Breast | IDC | 6.83e-35 | 4.39e-01 | 0.1577 |
| 100128731 | OST4 | GSM4909304 | Human | Breast | IDC | 1.76e-05 | 2.34e-01 | 0.1636 |
| 100128731 | OST4 | GSM4909311 | Human | Breast | IDC | 2.92e-54 | -3.97e-02 | 0.1534 |
| 100128731 | OST4 | GSM4909312 | Human | Breast | IDC | 2.09e-13 | 6.09e-02 | 0.1552 |
| 100128731 | OST4 | GSM4909313 | Human | Breast | IDC | 9.70e-19 | 2.71e-01 | 0.0391 |
| Page: 1 2 3 4 5 6 7 8 9 10 11 12 13 14 15 16 17 |
| Tissue | Expression Dynamics | Abbreviation |
| Breast | 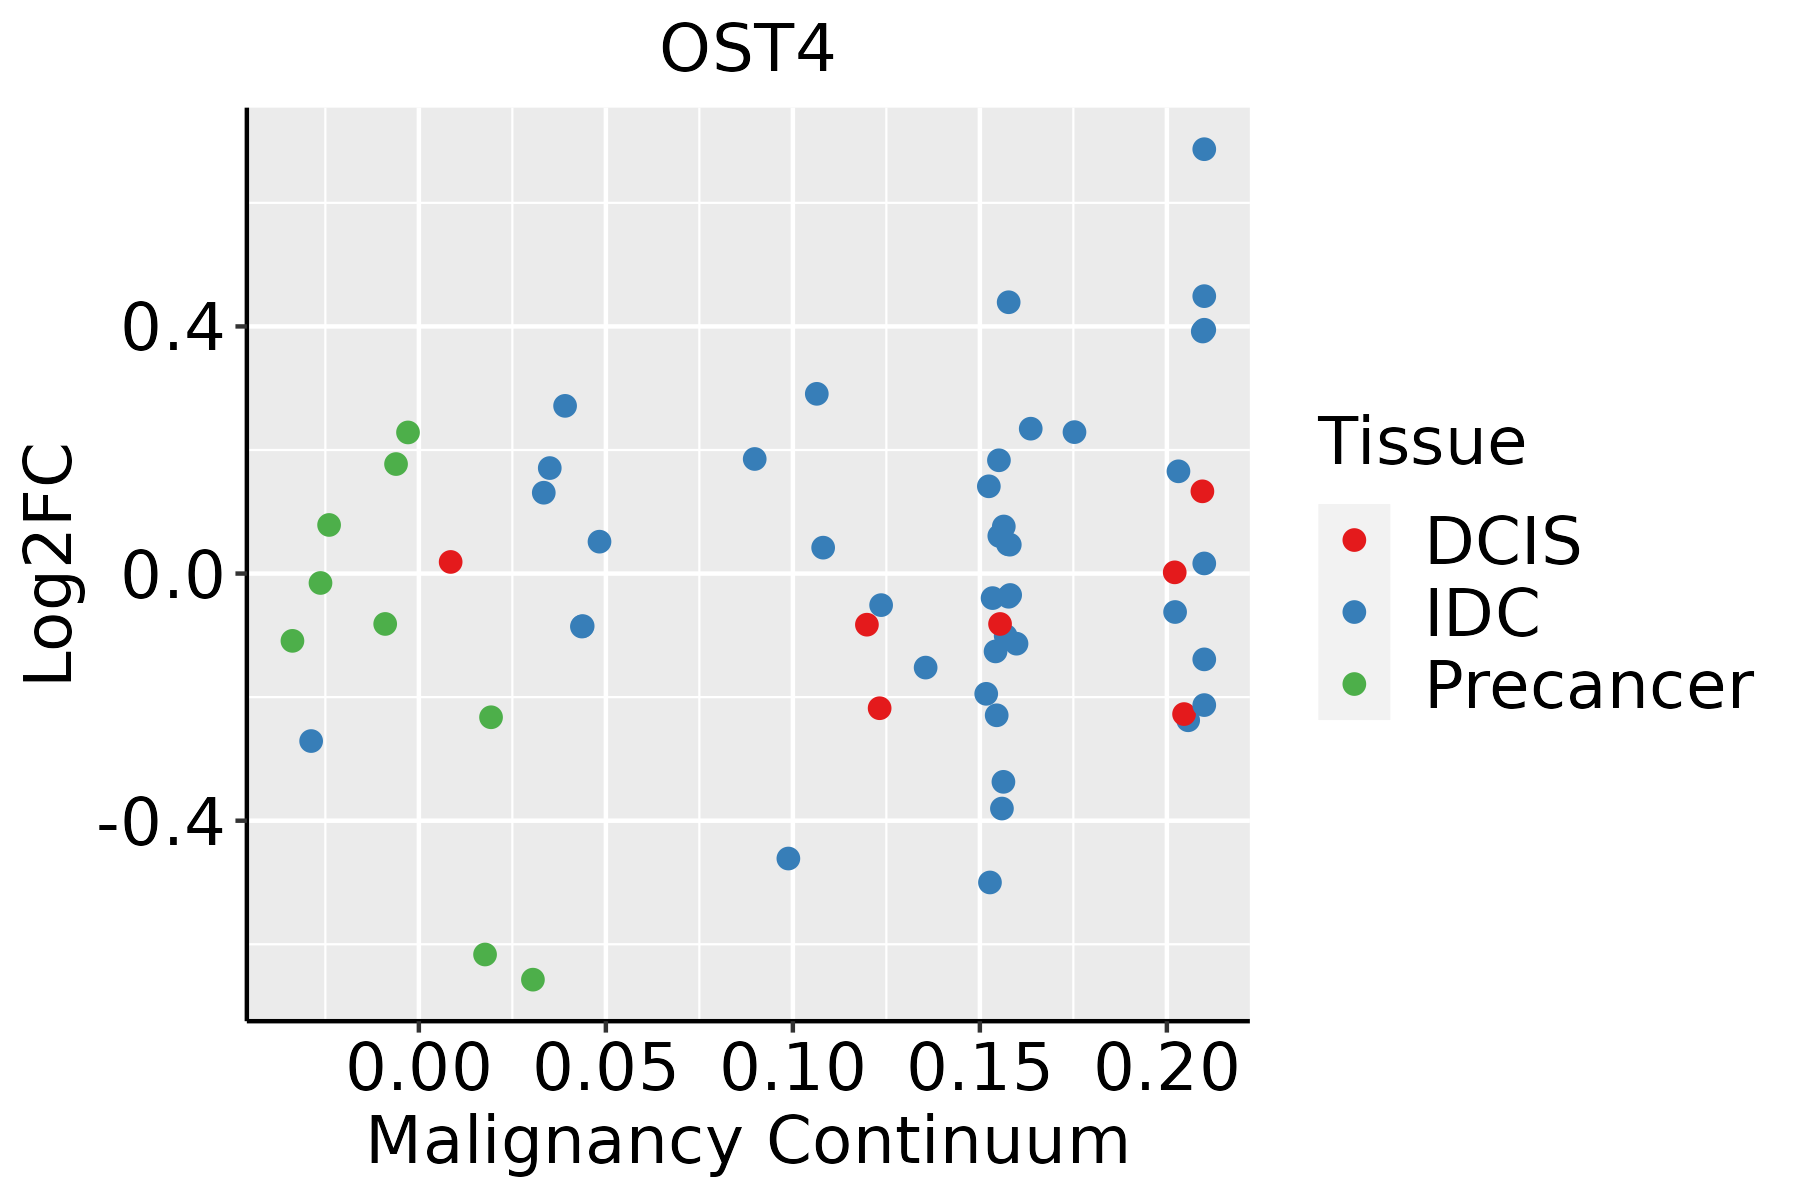 | IDC: Invasive ductal carcinoma |
| DCIS: Ductal carcinoma in situ | ||
| Precancer(BRCA1-mut): Precancerous lesion from BRCA1 mutation carriers | ||
| Cervix |  | CC: Cervix cancer |
| HSIL_HPV: HPV-infected high-grade squamous intraepithelial lesions | ||
| N_HPV: HPV-infected normal cervix | ||
| Colorectum (GSE201348) |  | FAP: Familial adenomatous polyposis |
| CRC: Colorectal cancer | ||
| Colorectum (HTA11) |  | AD: Adenomas |
| SER: Sessile serrated lesions | ||
| MSI-H: Microsatellite-high colorectal cancer | ||
| MSS: Microsatellite stable colorectal cancer | ||
| Endometrium | 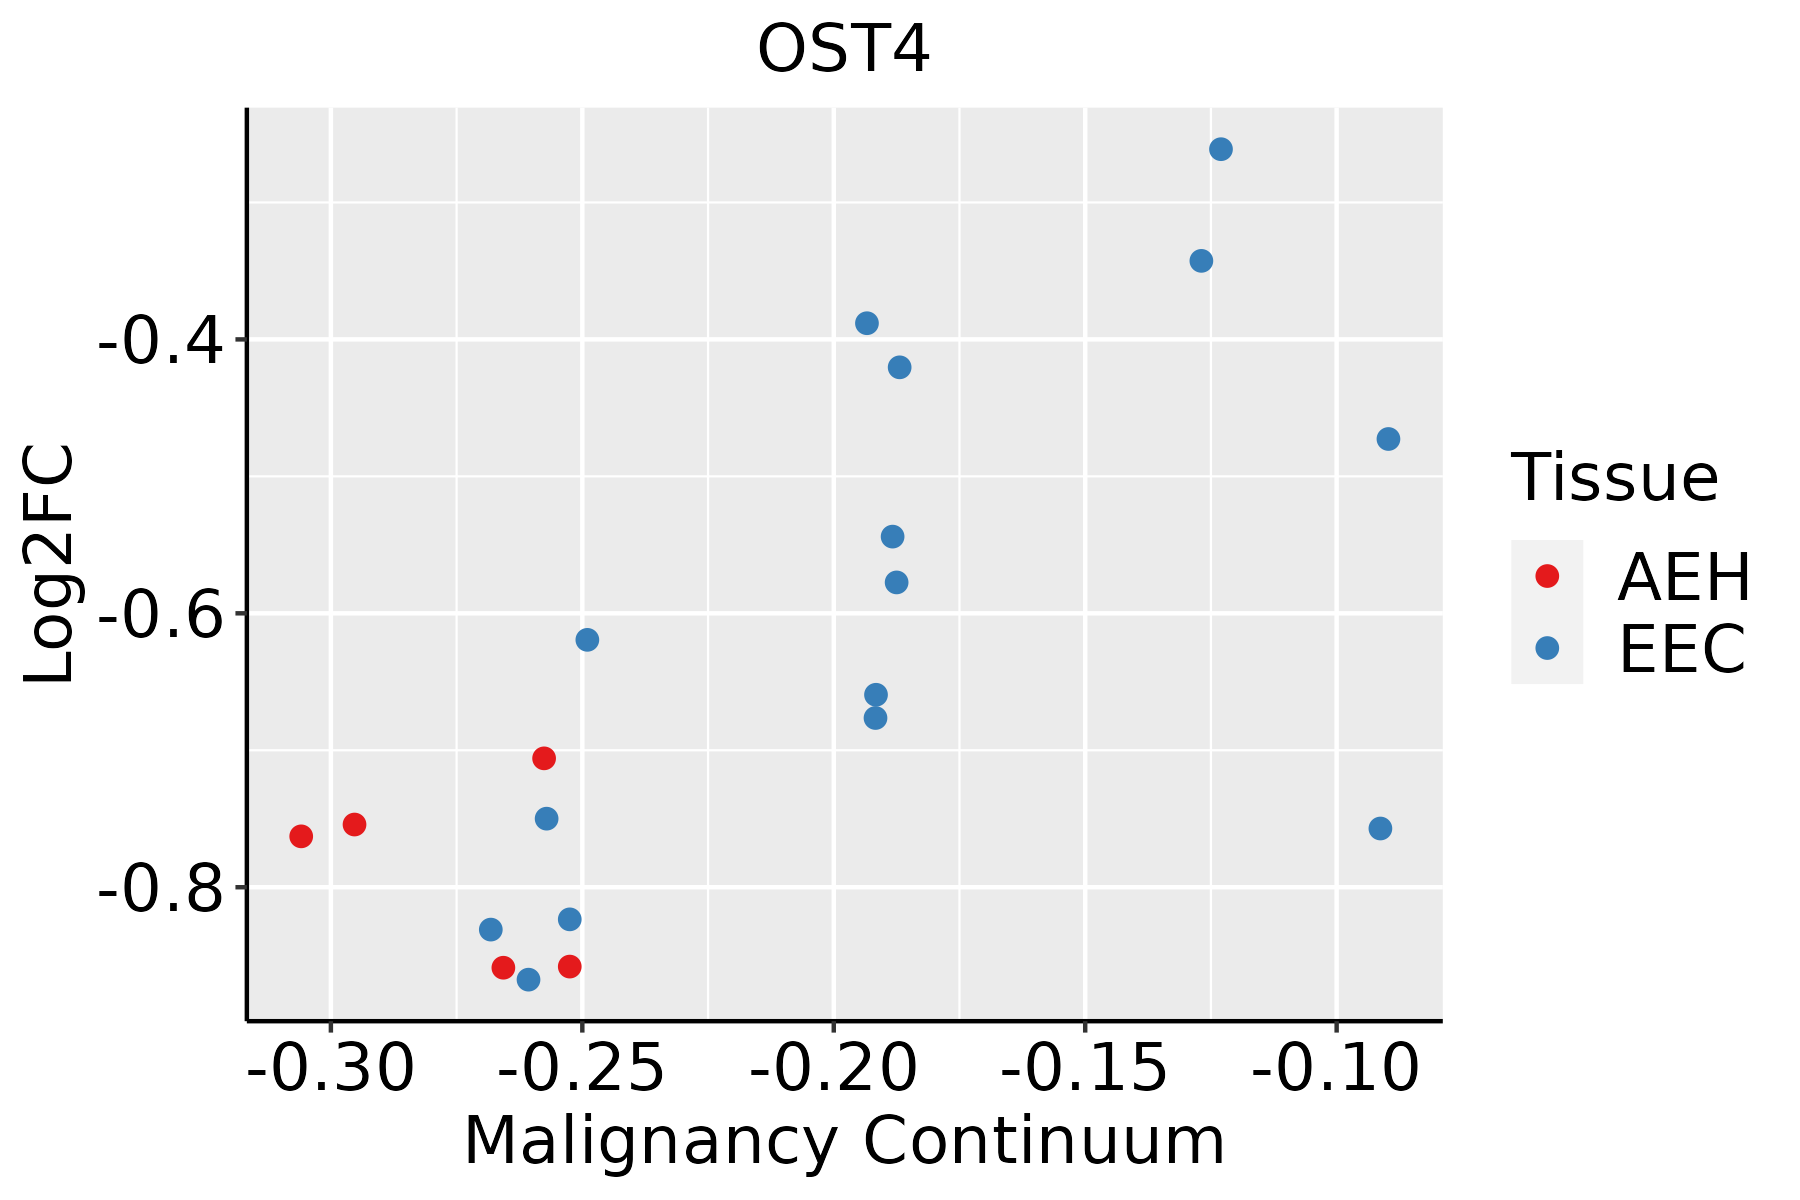 | AEH: Atypical endometrial hyperplasia |
| EEC: Endometrioid Cancer | ||
| Esophagus | 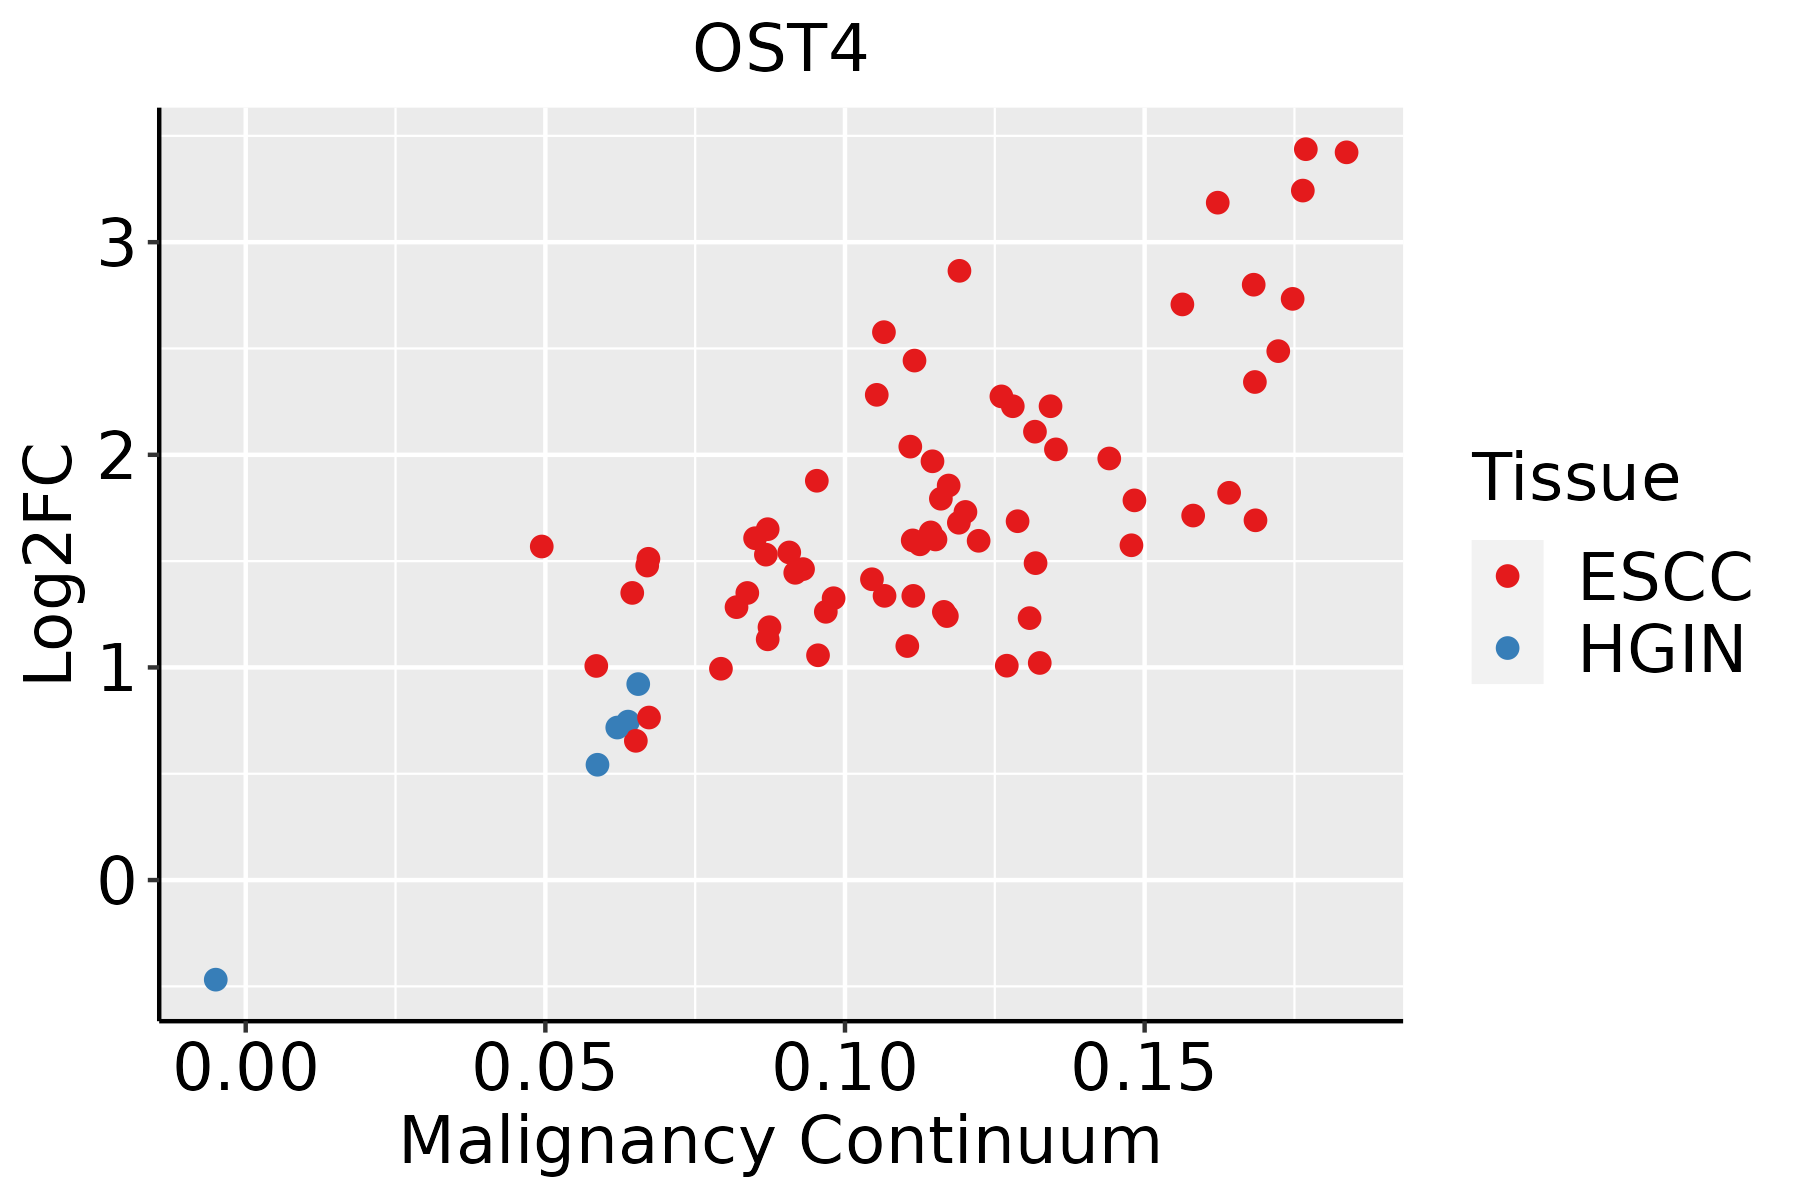 | ESCC: Esophageal squamous cell carcinoma |
| HGIN: High-grade intraepithelial neoplasias | ||
| LGIN: Low-grade intraepithelial neoplasias | ||
| GC | 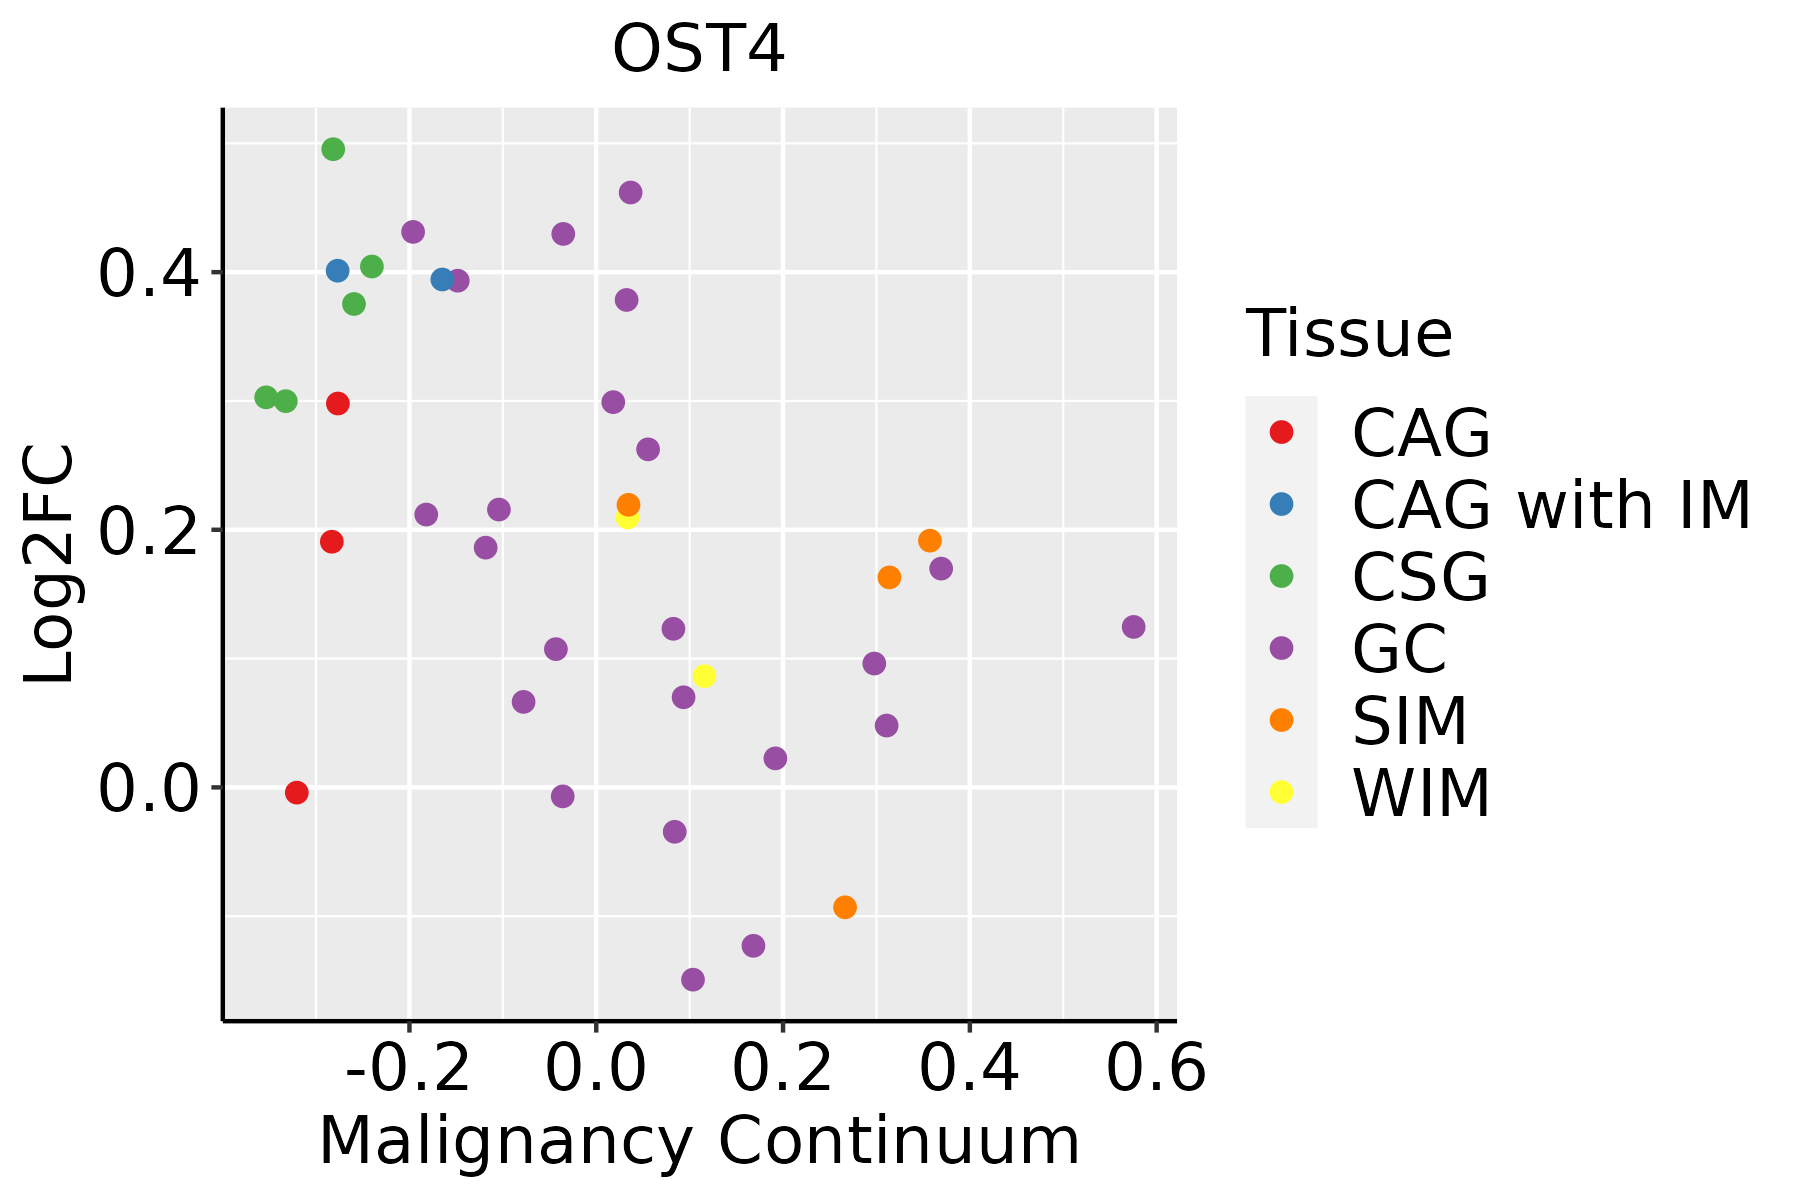 | CAG: Chronic atrophic gastritis |
| CAG with IM: Chronic atrophic gastritis with intestinal metaplasia | ||
| CSG: Chronic superficial gastritis | ||
| GC: Gastric cancer | ||
| SIM: Severe intestinal metaplasia | ||
| WIM: Wild intestinal metaplasia | ||
| Liver | 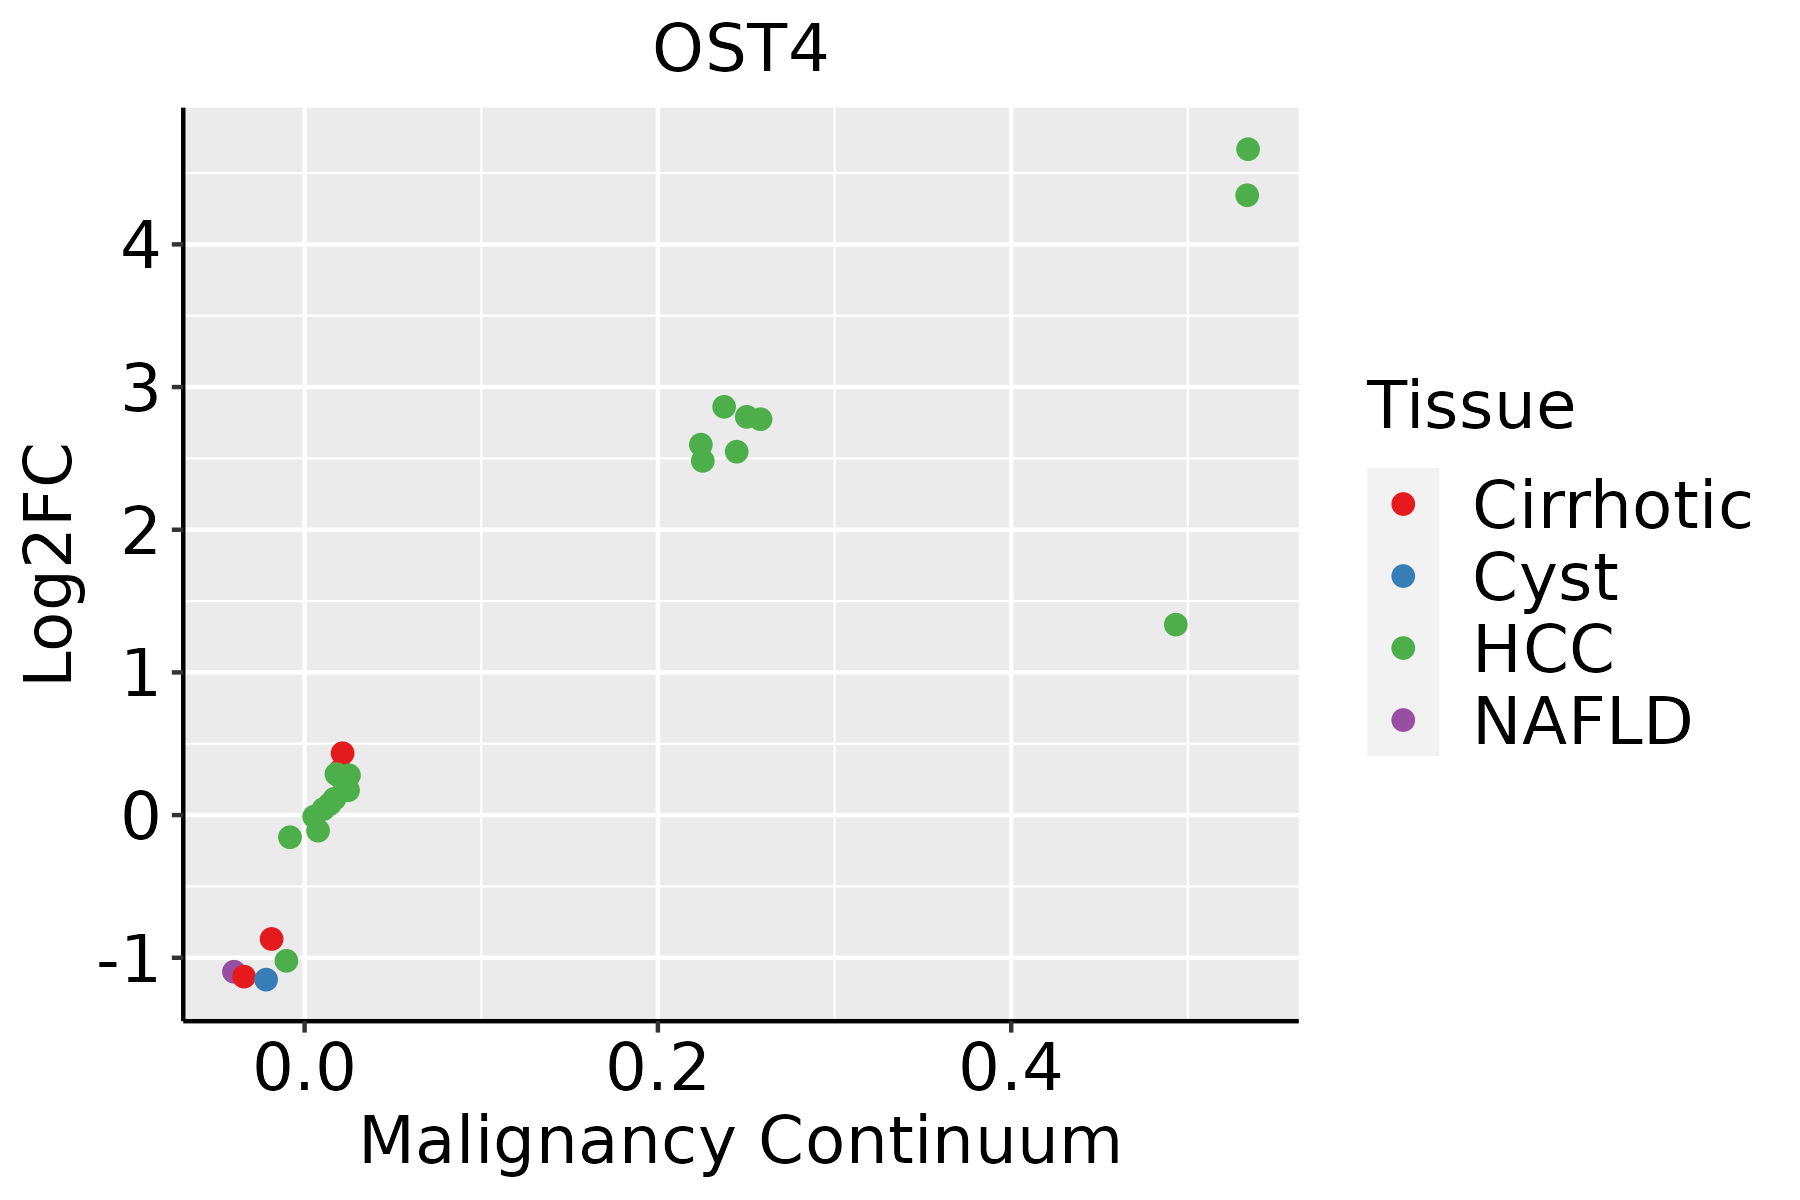 | HCC: Hepatocellular carcinoma |
| NAFLD: Non-alcoholic fatty liver disease | ||
| Oral Cavity | 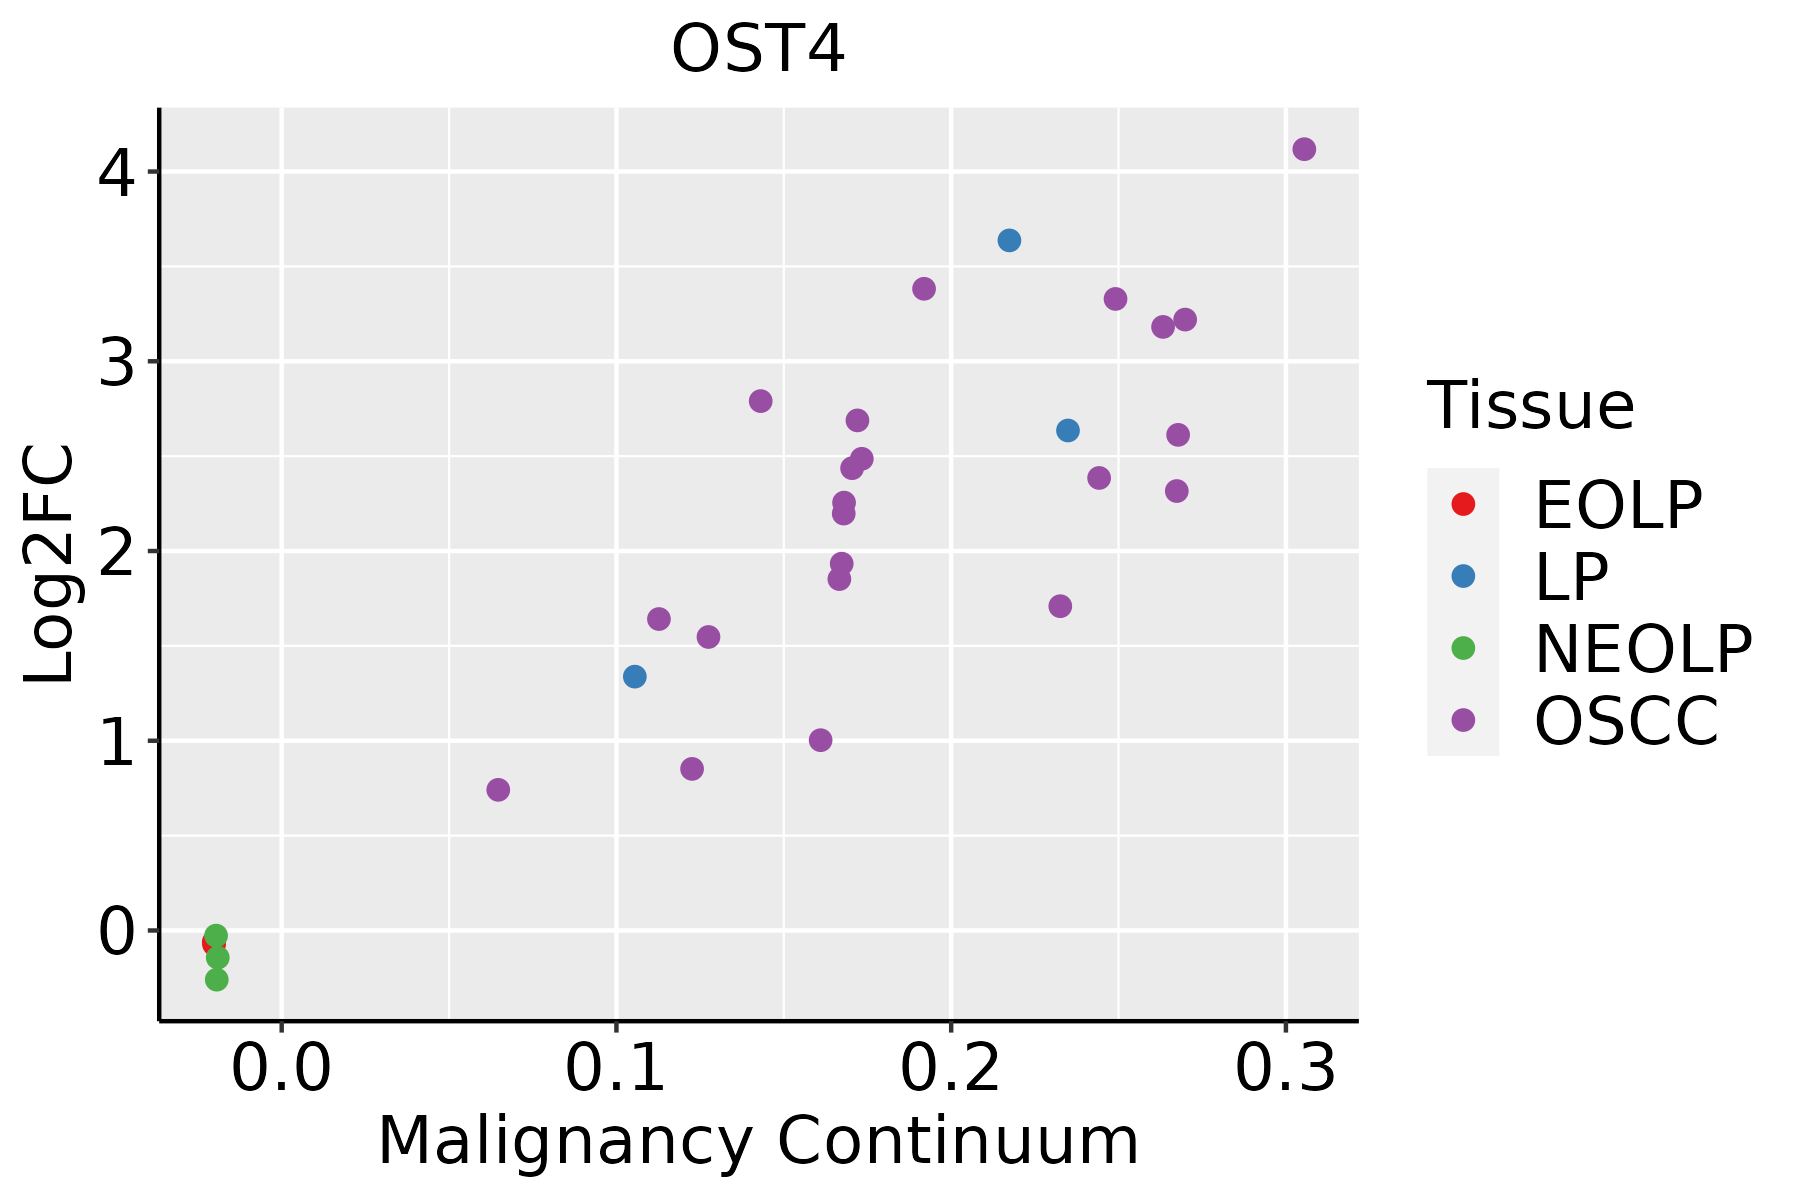 | EOLP: Erosive Oral lichen planus |
| LP: leukoplakia | ||
| NEOLP: Non-erosive oral lichen planus | ||
| OSCC: Oral squamous cell carcinoma | ||
| Prostate | 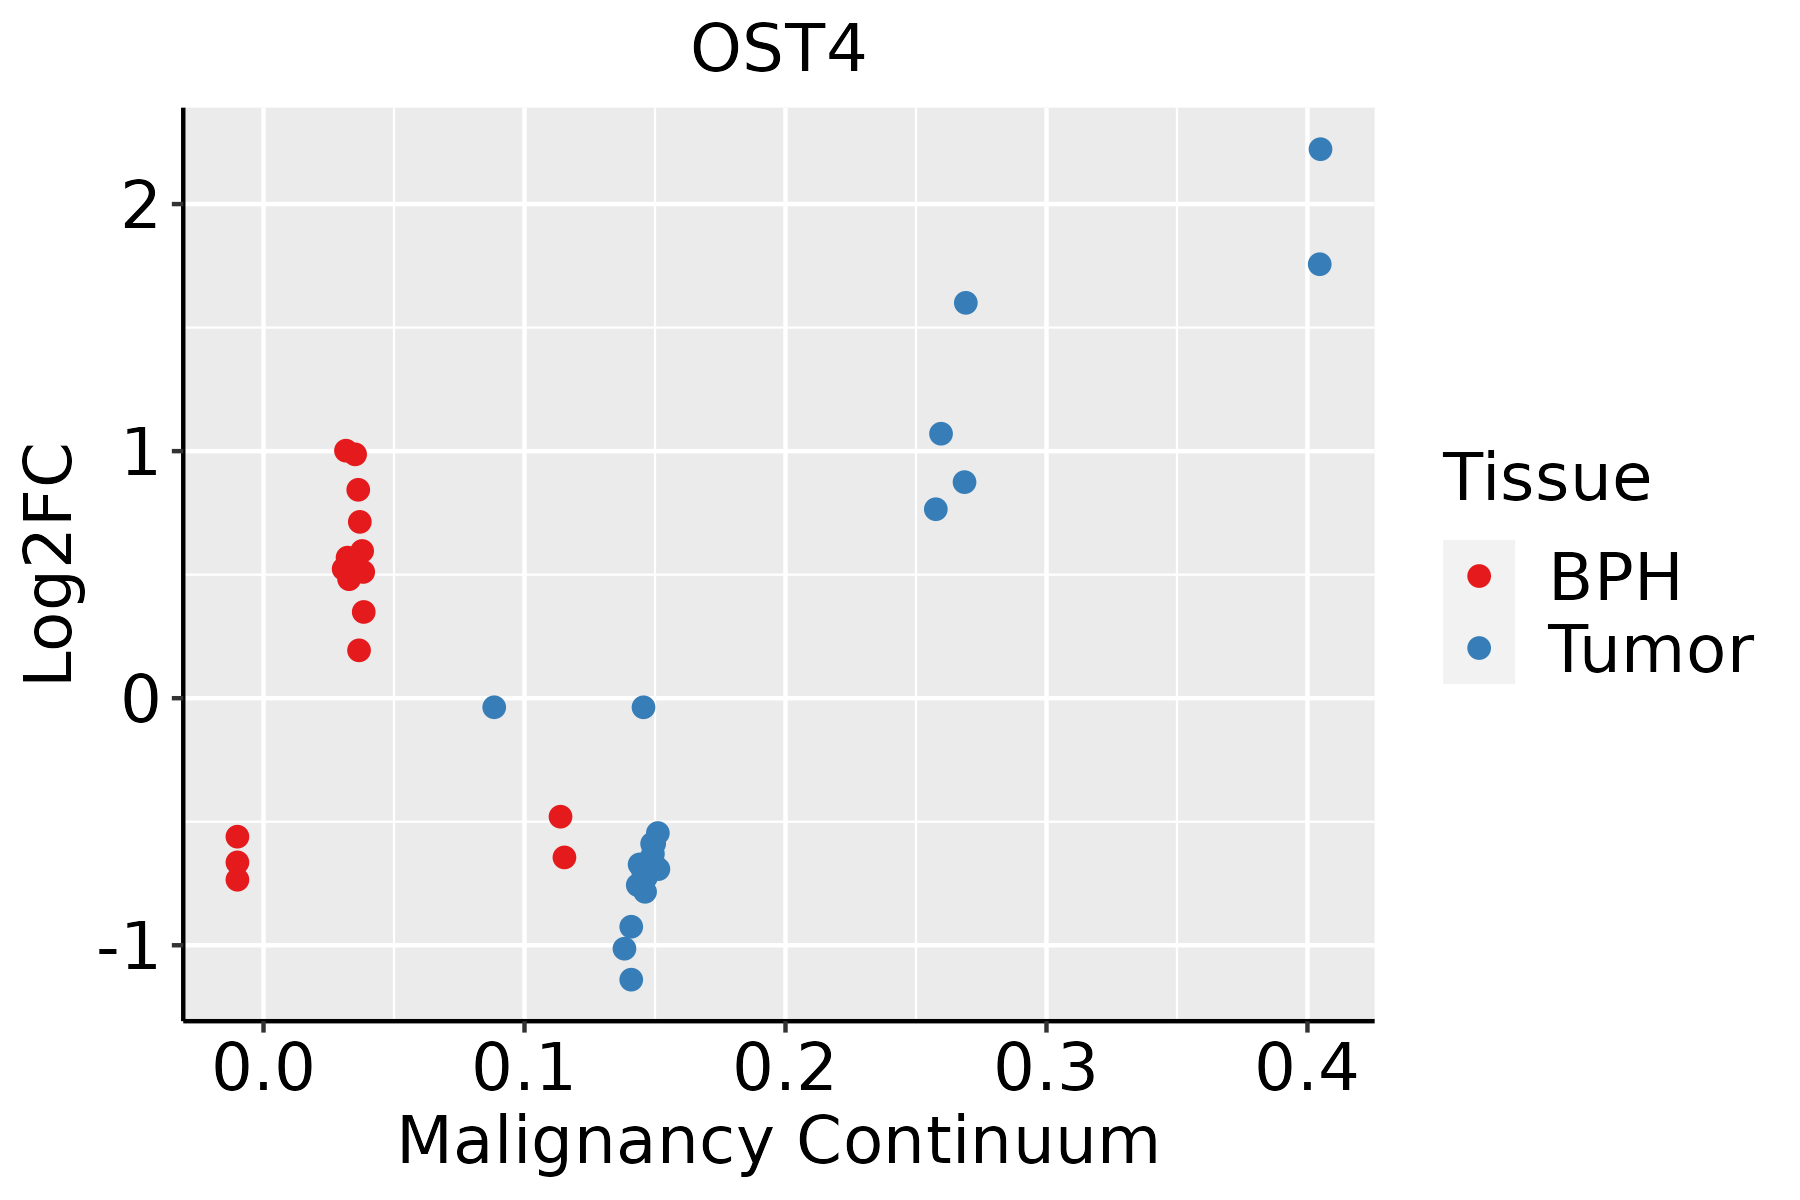 | BPH: Benign Prostatic Hyperplasia |
| Skin |  | AK: Actinic keratosis |
| cSCC: Cutaneous squamous cell carcinoma | ||
| SCCIS:squamous cell carcinoma in situ | ||
| Thyroid | 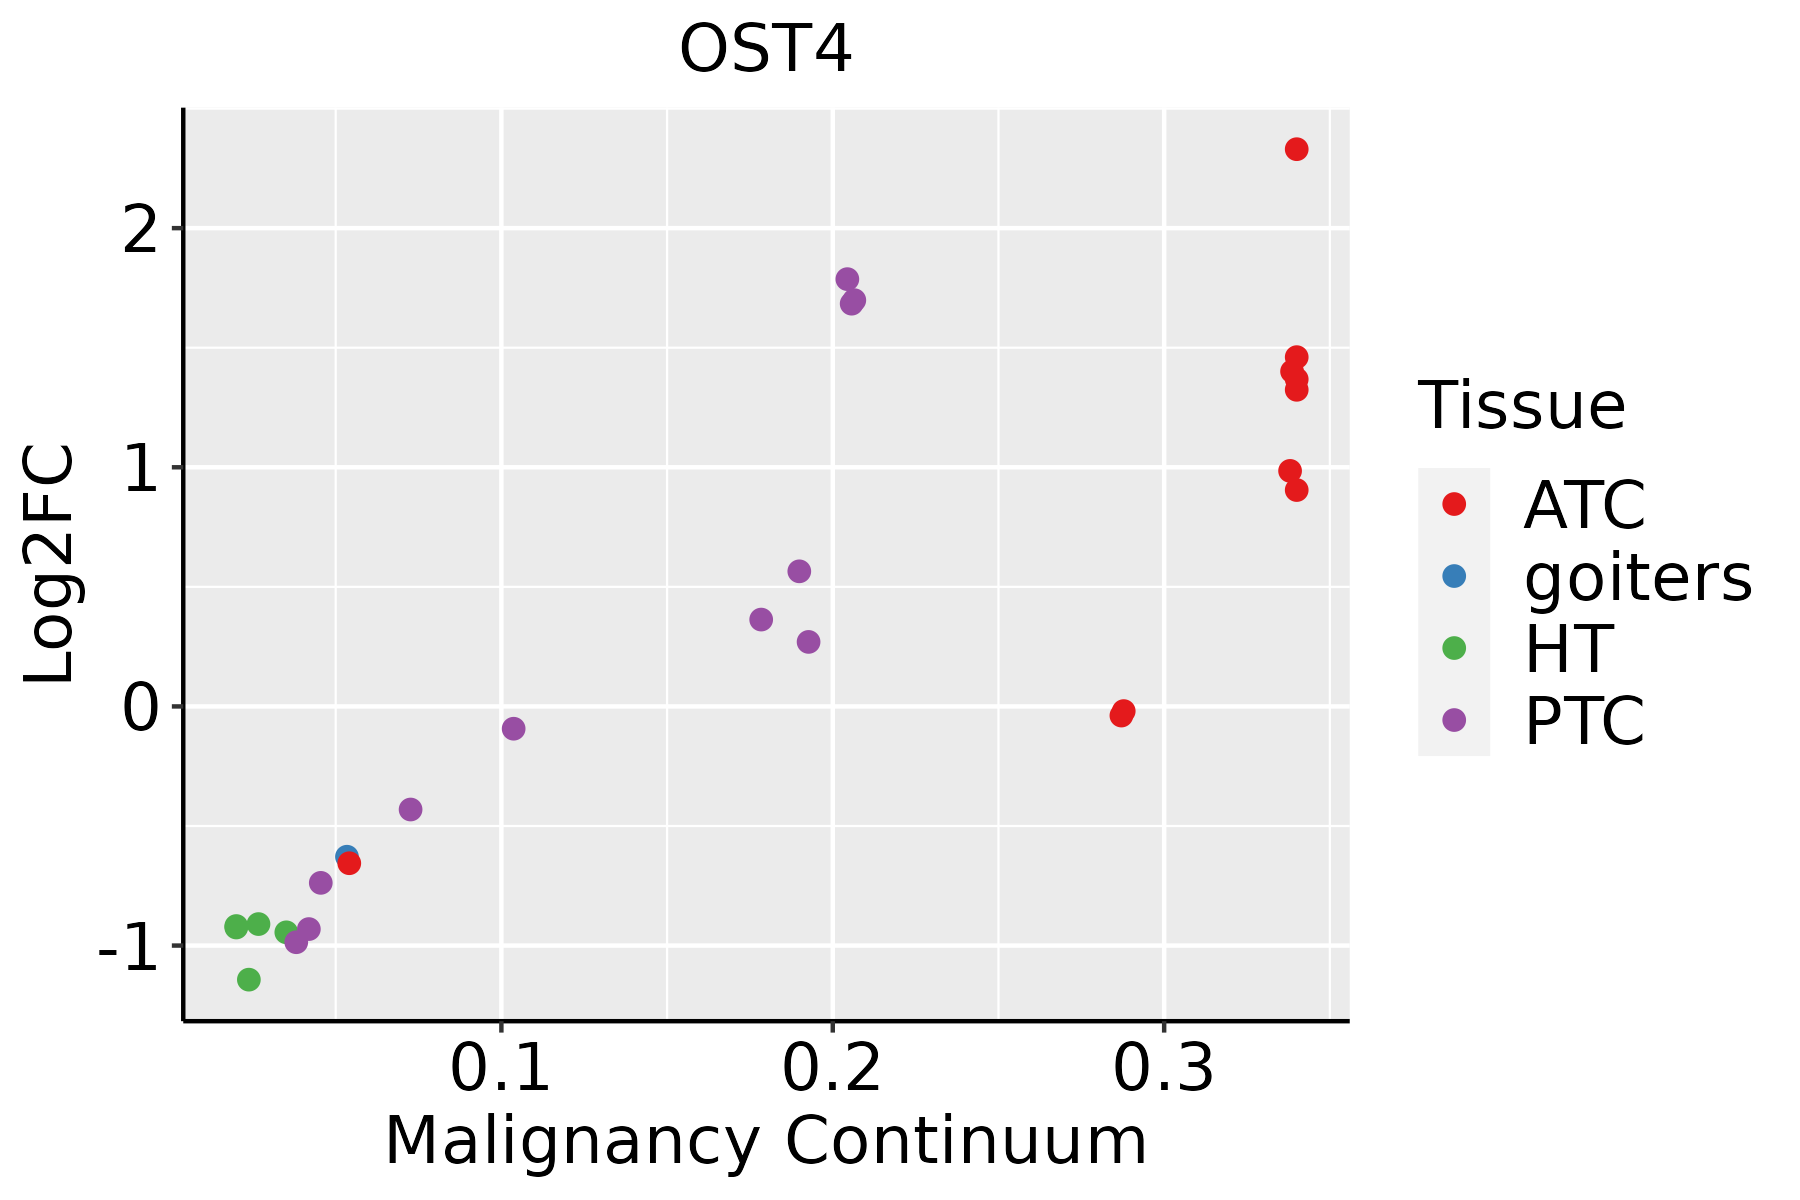 | ATC: Anaplastic thyroid cancer |
| HT: Hashimoto's thyroiditis | ||
| PTC: Papillary thyroid cancer |
| ∗log2FC in expression of this searched gene in stem-like cells from each diseased tissue sample relative to stem-like cells in normal samples in each tissue plotted against the malignancy continuum. Samples are colored based on if they are from different disease stage. |
Top |
Malignant transformation related pathway analysis |
| Find out the enriched GO biological processes and KEGG pathways involved in transition from healthy to precancer to cancer |
| Tissue | Disease Stage | Enriched GO biological Processes |
| Colorectum | AD |  |
| Colorectum | SER |  |
| Colorectum | MSS |  |
| Colorectum | MSI-H |  |
| Colorectum | FAP |  |
| ∗Top 15 enriched GO BP terms are showed in the bar plot of each disease state in each tissue. Each row represents a significant GO biological process which is colored according to the -log10(p.adjust). |
| Page: 1 2 3 4 5 6 7 8 9 |
| GO ID | Tissue | Disease Stage | Description | Gene Ratio | Bg Ratio | pvalue | p.adjust | Count |
| GO:0018279 | Colorectum | AD | protein N-linked glycosylation via asparagine | 15/3918 | 23/18723 | 5.47e-06 | 1.40e-04 | 15 |
| GO:0018196 | Colorectum | AD | peptidyl-asparagine modification | 15/3918 | 24/18723 | 1.18e-05 | 2.62e-04 | 15 |
| GO:0006487 | Colorectum | AD | protein N-linked glycosylation | 25/3918 | 65/18723 | 9.12e-04 | 8.71e-03 | 25 |
| GO:0006486 | Colorectum | AD | protein glycosylation | 64/3918 | 226/18723 | 4.86e-03 | 3.27e-02 | 64 |
| GO:0043413 | Colorectum | AD | macromolecule glycosylation | 64/3918 | 226/18723 | 4.86e-03 | 3.27e-02 | 64 |
| GO:0070085 | Colorectum | AD | glycosylation | 67/3918 | 240/18723 | 5.78e-03 | 3.67e-02 | 67 |
| GO:00182791 | Colorectum | SER | protein N-linked glycosylation via asparagine | 9/2897 | 23/18723 | 5.20e-03 | 3.95e-02 | 9 |
| GO:00181961 | Colorectum | SER | peptidyl-asparagine modification | 9/2897 | 24/18723 | 7.19e-03 | 4.99e-02 | 9 |
| GO:00182792 | Colorectum | MSS | protein N-linked glycosylation via asparagine | 13/3467 | 23/18723 | 5.21e-05 | 9.31e-04 | 13 |
| GO:00181962 | Colorectum | MSS | peptidyl-asparagine modification | 13/3467 | 24/18723 | 9.44e-05 | 1.49e-03 | 13 |
| GO:00064871 | Colorectum | MSS | protein N-linked glycosylation | 23/3467 | 65/18723 | 9.47e-04 | 9.54e-03 | 23 |
| GO:00182793 | Colorectum | MSI-H | protein N-linked glycosylation via asparagine | 7/1319 | 23/18723 | 7.62e-04 | 1.42e-02 | 7 |
| GO:00181963 | Colorectum | MSI-H | peptidyl-asparagine modification | 7/1319 | 24/18723 | 1.01e-03 | 1.73e-02 | 7 |
| GO:00182796 | Endometrium | AEH | protein N-linked glycosylation via asparagine | 9/2100 | 23/18723 | 5.19e-04 | 5.27e-03 | 9 |
| GO:00181966 | Endometrium | AEH | peptidyl-asparagine modification | 9/2100 | 24/18723 | 7.48e-04 | 7.12e-03 | 9 |
| GO:001827912 | Endometrium | EEC | protein N-linked glycosylation via asparagine | 9/2168 | 23/18723 | 6.58e-04 | 6.37e-03 | 9 |
| GO:001819612 | Endometrium | EEC | peptidyl-asparagine modification | 9/2168 | 24/18723 | 9.45e-04 | 8.45e-03 | 9 |
| GO:00064876 | Esophagus | HGIN | protein N-linked glycosylation | 17/2587 | 65/18723 | 6.04e-03 | 4.87e-02 | 17 |
| GO:000648714 | Esophagus | ESCC | protein N-linked glycosylation | 51/8552 | 65/18723 | 6.41e-08 | 1.13e-06 | 51 |
| GO:00091002 | Esophagus | ESCC | glycoprotein metabolic process | 226/8552 | 387/18723 | 2.64e-07 | 3.94e-06 | 226 |
| Page: 1 2 3 4 |
| Pathway ID | Tissue | Disease Stage | Description | Gene Ratio | Bg Ratio | pvalue | p.adjust | qvalue | Count |
| Page: 1 |
Top |
Cell-cell communication analysis |
| Identification of potential cell-cell interactions between two cell types and their ligand-receptor pairs for different disease states |
| Ligand | Receptor | LRpair | Pathway | Tissue | Disease Stage |
| Page: 1 |
Top |
Single-cell gene regulatory network inference analysis |
| Find out the significant the regulons (TFs) and the target genes of each regulon across cell types for different disease states |
| TF | Cell Type | Tissue | Disease Stage | Target Gene | RSS | Regulon Activity |
| ∗The dot plots of a searched regulon are shown for all cell subpopulations in each disease state of each tissue based on the regulon specific score inferred using pySCENIC and by calculating the average expression. |
| Page: 1 |
Top |
Somatic mutation of malignant transformation related genes |
| Annotation of somatic variants for genes involved in malignant transformation |
| Hugo Symbol | Variant Class | Variant Classification | dbSNP RS | HGVSc | HGVSp | HGVSp Short | SWISSPROT | BIOTYPE | SIFT | PolyPhen | Tumor Sample Barcode | Tissue | Histology | Sex | Age | Stage | Therapy Types | Drugs | Outcome |
| OST4 | deletion | In_Frame_Del | c.66_68delNNN | p.Val23del | p.V23del | P0C6T2 | protein_coding | TCGA-D8-A1XB-01 | Breast | breast invasive carcinoma | Female | <65 | I/II | Unknown | Unknown | SD | |||
| OST4 | SNV | Missense_Mutation | c.101A>C | p.Lys34Thr | p.K34T | P0C6T2 | protein_coding | deleterious(0.01) | benign(0.011) | TCGA-BS-A0UV-01 | Endometrium | uterine corpus endometrioid carcinoma | Female | <65 | III/IV | Unknown | Unknown | SD |
| Page: 1 |
Top |
Related drugs of malignant transformation related genes |
| Identification of chemicals and drugs interact with genes involved in malignant transfromation |
| (DGIdb 4.0) |
| Entrez ID | Symbol | Category | Interaction Types | Drug Claim Name | Drug Name | PMIDs |
| Page: 1 |

Copyright 2023-Present -The University of Texas Health Science Center at Houston |