
|
|||||
|
 | |
| |
| |
| |
| |
| |
|
Gene: OSR1 |
Gene summary for OSR1 |
| Gene information | Species | Human | Gene symbol | OSR1 | Gene ID | 130497 |
| Gene name | odd-skipped related transcription factor 1 | |
| Gene Alias | ODD | |
| Cytomap | 2p24.1 | |
| Gene Type | protein-coding | GO ID | GO:0000003 | UniProtAcc | Q8TAX0 |
Top |
Malignant transformation analysis |
| Identification of the aberrant gene expression in precancerous and cancerous lesions by comparing the gene expression of stem-like cells in diseased tissues with normal stem cells |
| Entrez ID | Symbol | Replicates | Species | Organ | Tissue | Adj P-value | Log2FC | Malignancy |
| 130497 | OSR1 | LZE24T | Human | Esophagus | ESCC | 3.03e-06 | 2.75e-01 | 0.0596 |
| 130497 | OSR1 | P8T-E | Human | Esophagus | ESCC | 5.94e-06 | 1.67e-01 | 0.0889 |
| 130497 | OSR1 | P12T-E | Human | Esophagus | ESCC | 4.72e-51 | 1.11e+00 | 0.1122 |
| 130497 | OSR1 | P16T-E | Human | Esophagus | ESCC | 3.33e-67 | 1.30e+00 | 0.1153 |
| 130497 | OSR1 | P27T-E | Human | Esophagus | ESCC | 2.06e-08 | 1.88e-01 | 0.1055 |
| 130497 | OSR1 | P48T-E | Human | Esophagus | ESCC | 1.51e-02 | 8.32e-02 | 0.0959 |
| 130497 | OSR1 | P56T-E | Human | Esophagus | ESCC | 1.99e-17 | 1.96e+00 | 0.1613 |
| 130497 | OSR1 | P61T-E | Human | Esophagus | ESCC | 1.15e-08 | 2.76e-01 | 0.099 |
| 130497 | OSR1 | P62T-E | Human | Esophagus | ESCC | 1.14e-02 | 1.27e-01 | 0.1302 |
| 130497 | OSR1 | P74T-E | Human | Esophagus | ESCC | 5.95e-07 | 3.39e-01 | 0.1479 |
| 130497 | OSR1 | P76T-E | Human | Esophagus | ESCC | 2.13e-17 | 6.19e-01 | 0.1207 |
| 130497 | OSR1 | P83T-E | Human | Esophagus | ESCC | 1.29e-04 | 1.76e-01 | 0.1738 |
| 130497 | OSR1 | P128T-E | Human | Esophagus | ESCC | 8.05e-09 | 2.91e-01 | 0.1241 |
| Page: 1 |
| Tissue | Expression Dynamics | Abbreviation |
| Esophagus | 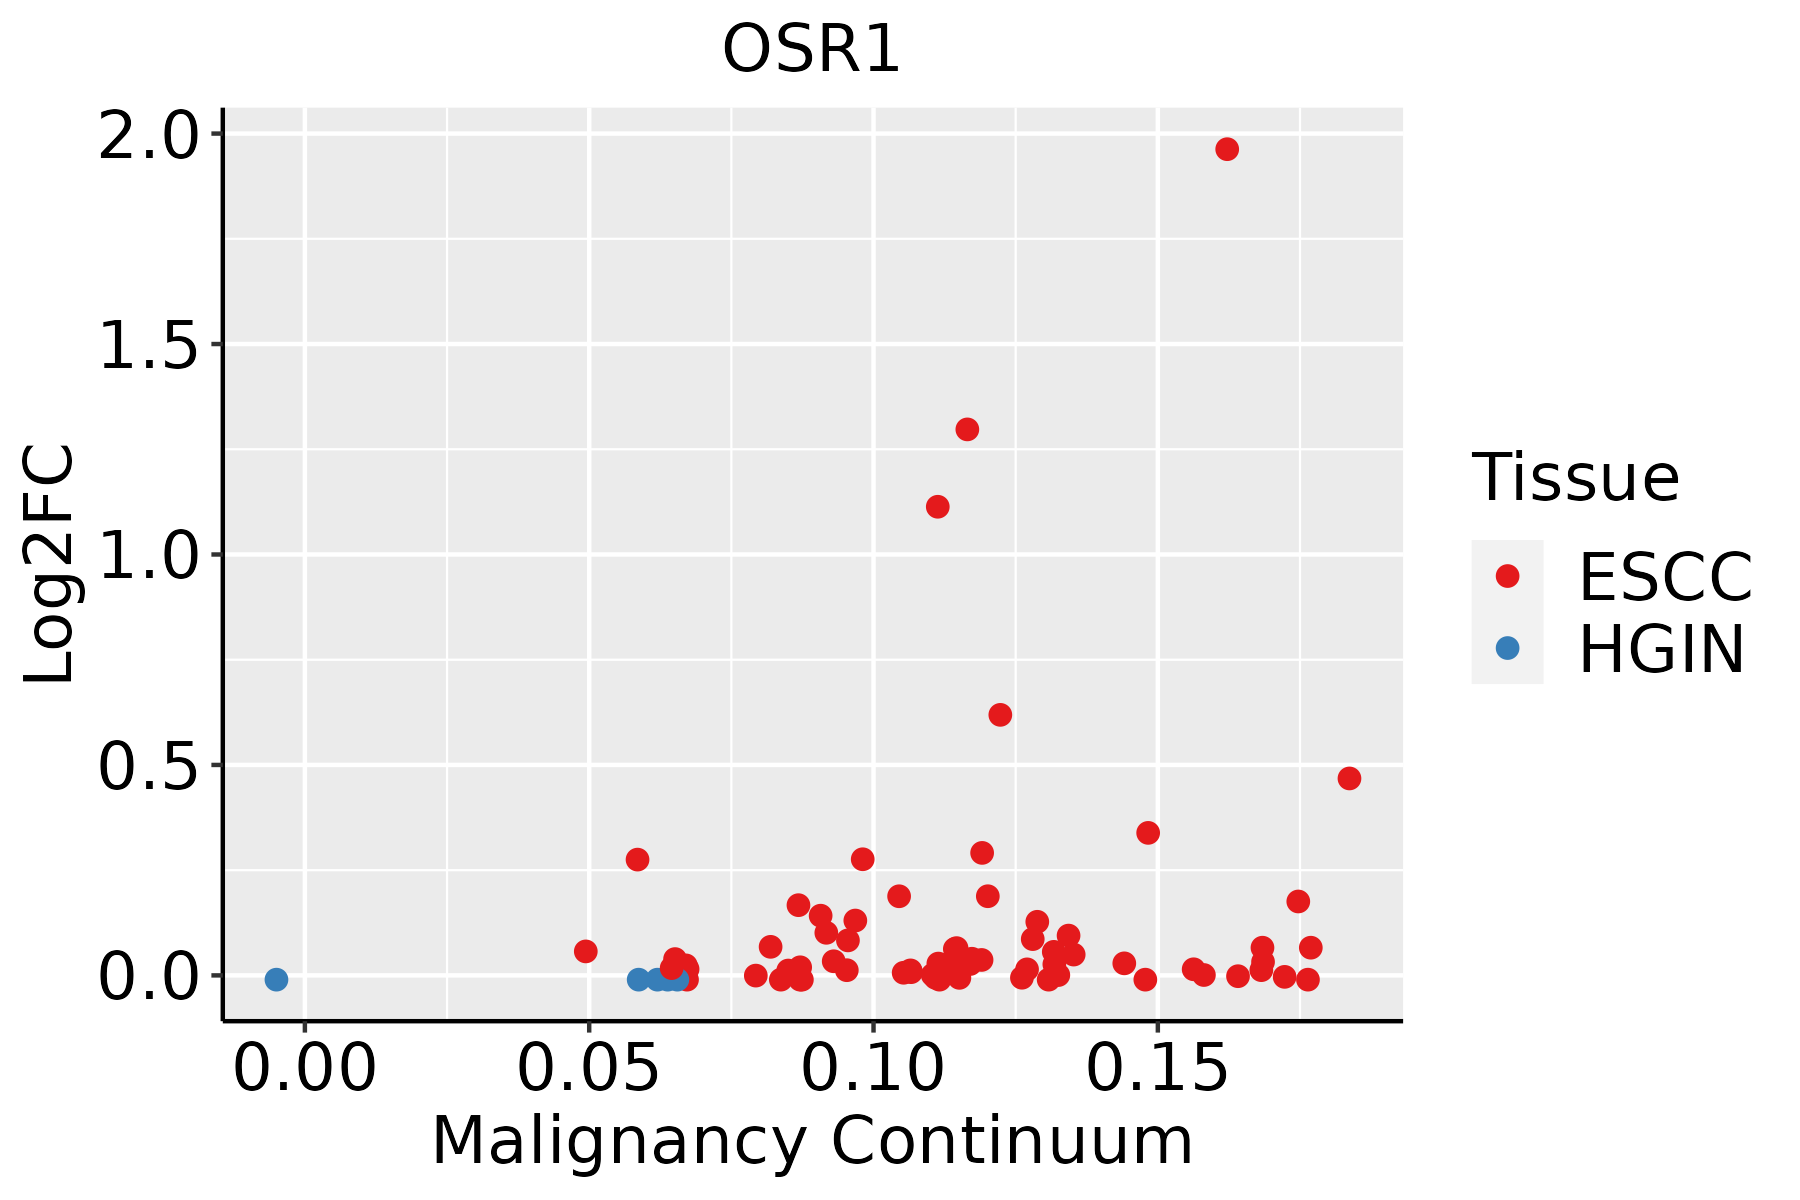 | ESCC: Esophageal squamous cell carcinoma |
| HGIN: High-grade intraepithelial neoplasias | ||
| LGIN: Low-grade intraepithelial neoplasias |
| ∗log2FC in expression of this searched gene in stem-like cells from each diseased tissue sample relative to stem-like cells in normal samples in each tissue plotted against the malignancy continuum. Samples are colored based on if they are from different disease stage. |
Top |
Malignant transformation related pathway analysis |
| Find out the enriched GO biological processes and KEGG pathways involved in transition from healthy to precancer to cancer |
| Tissue | Disease Stage | Enriched GO biological Processes |
| Colorectum | AD |  |
| Colorectum | SER |  |
| Colorectum | MSS |  |
| Colorectum | MSI-H |  |
| Colorectum | FAP |  |
| ∗Top 15 enriched GO BP terms are showed in the bar plot of each disease state in each tissue. Each row represents a significant GO biological process which is colored according to the -log10(p.adjust). |
| Page: 1 2 3 4 5 6 7 8 9 |
| GO ID | Tissue | Disease Stage | Description | Gene Ratio | Bg Ratio | pvalue | p.adjust | Count |
| GO:004819318 | Esophagus | ESCC | Golgi vesicle transport | 231/8552 | 296/18723 | 1.82e-30 | 9.63e-28 | 231 |
| GO:005165617 | Esophagus | ESCC | establishment of organelle localization | 273/8552 | 390/18723 | 9.13e-23 | 1.81e-20 | 273 |
| GO:001605014 | Esophagus | ESCC | vesicle organization | 211/8552 | 300/18723 | 2.85e-18 | 2.87e-16 | 211 |
| GO:001619715 | Esophagus | ESCC | endosomal transport | 168/8552 | 230/18723 | 2.28e-17 | 1.93e-15 | 168 |
| GO:000688815 | Esophagus | ESCC | endoplasmic reticulum to Golgi vesicle-mediated transport | 102/8552 | 130/18723 | 1.73e-14 | 9.22e-13 | 102 |
| GO:001648210 | Esophagus | ESCC | cytosolic transport | 124/8552 | 168/18723 | 9.69e-14 | 4.69e-12 | 124 |
| GO:005165016 | Esophagus | ESCC | establishment of vesicle localization | 114/8552 | 161/18723 | 8.20e-11 | 2.53e-09 | 114 |
| GO:005164815 | Esophagus | ESCC | vesicle localization | 119/8552 | 177/18723 | 5.16e-09 | 1.08e-07 | 119 |
| GO:00069038 | Esophagus | ESCC | vesicle targeting | 38/8552 | 45/18723 | 8.42e-08 | 1.43e-06 | 38 |
| GO:00163316 | Esophagus | ESCC | morphogenesis of embryonic epithelium | 98/8552 | 147/18723 | 2.12e-07 | 3.27e-06 | 98 |
| GO:0061458110 | Esophagus | ESCC | reproductive system development | 247/8552 | 427/18723 | 2.24e-07 | 3.42e-06 | 247 |
| GO:000183814 | Esophagus | ESCC | embryonic epithelial tube formation | 83/8552 | 121/18723 | 2.78e-07 | 4.08e-06 | 83 |
| GO:004860818 | Esophagus | ESCC | reproductive structure development | 245/8552 | 424/18723 | 2.82e-07 | 4.14e-06 | 245 |
| GO:00482844 | Esophagus | ESCC | organelle fusion | 94/8552 | 141/18723 | 3.72e-07 | 5.16e-06 | 94 |
| GO:003514815 | Esophagus | ESCC | tube formation | 96/8552 | 148/18723 | 1.86e-06 | 2.16e-05 | 96 |
| GO:000150317 | Esophagus | ESCC | ossification | 232/8552 | 408/18723 | 3.00e-06 | 3.40e-05 | 232 |
| GO:00073698 | Esophagus | ESCC | gastrulation | 115/8552 | 185/18723 | 4.35e-06 | 4.64e-05 | 115 |
| GO:00421477 | Esophagus | ESCC | retrograde transport, endosome to Golgi | 63/8552 | 91/18723 | 4.58e-06 | 4.87e-05 | 63 |
| GO:00721759 | Esophagus | ESCC | epithelial tube formation | 86/8552 | 132/18723 | 4.81e-06 | 5.10e-05 | 86 |
| GO:00901743 | Esophagus | ESCC | organelle membrane fusion | 73/8552 | 110/18723 | 9.29e-06 | 8.88e-05 | 73 |
| Page: 1 2 3 4 5 6 7 8 |
| Pathway ID | Tissue | Disease Stage | Description | Gene Ratio | Bg Ratio | pvalue | p.adjust | qvalue | Count |
| Page: 1 |
Top |
Cell-cell communication analysis |
| Identification of potential cell-cell interactions between two cell types and their ligand-receptor pairs for different disease states |
| Ligand | Receptor | LRpair | Pathway | Tissue | Disease Stage |
| Page: 1 |
Top |
Single-cell gene regulatory network inference analysis |
| Find out the significant the regulons (TFs) and the target genes of each regulon across cell types for different disease states |
| TF | Cell Type | Tissue | Disease Stage | Target Gene | RSS | Regulon Activity |
| ∗The dot plots of a searched regulon are shown for all cell subpopulations in each disease state of each tissue based on the regulon specific score inferred using pySCENIC and by calculating the average expression. |
| Page: 1 |
Top |
Somatic mutation of malignant transformation related genes |
| Annotation of somatic variants for genes involved in malignant transformation |
| Hugo Symbol | Variant Class | Variant Classification | dbSNP RS | HGVSc | HGVSp | HGVSp Short | SWISSPROT | BIOTYPE | SIFT | PolyPhen | Tumor Sample Barcode | Tissue | Histology | Sex | Age | Stage | Therapy Types | Drugs | Outcome |
| OSR1 | SNV | Missense_Mutation | c.472N>G | p.Pro158Ala | p.P158A | Q8TAX0 | protein_coding | deleterious(0.03) | benign(0.313) | TCGA-AC-A23H-01 | Breast | breast invasive carcinoma | Female | >=65 | I/II | Unknown | Unknown | PD | |
| OSR1 | SNV | Missense_Mutation | novel | c.598N>A | p.Glu200Lys | p.E200K | Q8TAX0 | protein_coding | deleterious(0) | probably_damaging(0.999) | TCGA-AN-A046-01 | Breast | breast invasive carcinoma | Female | >=65 | I/II | Unknown | Unknown | SD |
| OSR1 | SNV | Missense_Mutation | novel | c.732N>T | p.Arg244Ser | p.R244S | Q8TAX0 | protein_coding | tolerated(0.18) | benign(0.113) | TCGA-S3-AA10-01 | Breast | breast invasive carcinoma | Female | >=65 | I/II | Chemotherapy | cytoxan | CR |
| OSR1 | insertion | Nonsense_Mutation | novel | c.155_156insATAACATTGCATCATTTTGCAAGGATGAACTCTCTGTTTC | p.His53Ter | p.H53* | Q8TAX0 | protein_coding | TCGA-A8-A06P-01 | Breast | breast invasive carcinoma | Female | <65 | III/IV | Unspecific | SD | |||
| OSR1 | insertion | Frame_Shift_Ins | novel | c.566_567insAAGTGTAATCCCTGTATCTGCTTCAGCCTCCTGC | p.Asn189LysfsTer17 | p.N189Kfs*17 | Q8TAX0 | protein_coding | TCGA-BH-A0HF-01 | Breast | breast invasive carcinoma | Female | >=65 | I/II | Hormone Therapy | arimidex | SD | ||
| OSR1 | SNV | Missense_Mutation | novel | c.346N>T | p.Arg116Cys | p.R116C | Q8TAX0 | protein_coding | deleterious(0) | probably_damaging(0.991) | TCGA-EA-A3HU-01 | Cervix | cervical & endocervical cancer | Female | <65 | I/II | Unknown | Unknown | SD |
| OSR1 | SNV | Missense_Mutation | c.788A>C | p.Lys263Thr | p.K263T | Q8TAX0 | protein_coding | tolerated_low_confidence(0.06) | benign(0.138) | TCGA-AA-3977-01 | Colorectum | colon adenocarcinoma | Male | >=65 | I/II | Unknown | Unknown | SD | |
| OSR1 | SNV | Missense_Mutation | c.494N>C | p.Gly165Ala | p.G165A | Q8TAX0 | protein_coding | deleterious(0.04) | possibly_damaging(0.572) | TCGA-CM-5863-01 | Colorectum | colon adenocarcinoma | Female | <65 | III/IV | Chemotherapy | oxaliplatin | SD | |
| OSR1 | SNV | Missense_Mutation | c.684N>T | p.Glu228Asp | p.E228D | Q8TAX0 | protein_coding | tolerated(0.09) | benign(0.21) | TCGA-F5-6814-01 | Colorectum | rectum adenocarcinoma | Male | <65 | I/II | Unknown | Unknown | SD | |
| OSR1 | SNV | Missense_Mutation | novel | c.779A>G | p.Lys260Arg | p.K260R | Q8TAX0 | protein_coding | tolerated(0.1) | benign(0.011) | TCGA-A5-A1OF-01 | Endometrium | uterine corpus endometrioid carcinoma | Female | <65 | I/II | Unknown | Unknown | SD |
| Page: 1 2 3 4 5 |
Top |
Related drugs of malignant transformation related genes |
| Identification of chemicals and drugs interact with genes involved in malignant transfromation |
| (DGIdb 4.0) |
| Entrez ID | Symbol | Category | Interaction Types | Drug Claim Name | Drug Name | PMIDs |
| Page: 1 |

Copyright 2023-Present -The University of Texas Health Science Center at Houston |