
|
|||||
|
 | |
| |
| |
| |
| |
| |
|
Gene: OSMR |
Gene summary for OSMR |
| Gene information | Species | Human | Gene symbol | OSMR | Gene ID | 9180 |
| Gene name | oncostatin M receptor | |
| Gene Alias | IL-31R-beta | |
| Cytomap | 5p13.1 | |
| Gene Type | protein-coding | GO ID | GO:0002526 | UniProtAcc | Q99650 |
Top |
Malignant transformation analysis |
| Identification of the aberrant gene expression in precancerous and cancerous lesions by comparing the gene expression of stem-like cells in diseased tissues with normal stem cells |
| Entrez ID | Symbol | Replicates | Species | Organ | Tissue | Adj P-value | Log2FC | Malignancy |
| 9180 | OSMR | CA_HPV_1 | Human | Cervix | CC | 6.60e-03 | -1.49e-01 | 0.0264 |
| 9180 | OSMR | CCI_1 | Human | Cervix | CC | 7.52e-08 | 8.81e-01 | 0.528 |
| 9180 | OSMR | CCI_3 | Human | Cervix | CC | 2.18e-04 | 6.90e-01 | 0.516 |
| 9180 | OSMR | Tumor | Human | Cervix | CC | 4.90e-05 | 2.69e-01 | 0.1241 |
| 9180 | OSMR | sample3 | Human | Cervix | CC | 5.93e-19 | 4.16e-01 | 0.1387 |
| 9180 | OSMR | T3 | Human | Cervix | CC | 1.14e-15 | 4.16e-01 | 0.1389 |
| 9180 | OSMR | LZE2D | Human | Esophagus | HGIN | 7.66e-03 | 1.80e-01 | 0.0642 |
| 9180 | OSMR | LZE4T | Human | Esophagus | ESCC | 5.13e-05 | 2.42e-01 | 0.0811 |
| 9180 | OSMR | LZE8T | Human | Esophagus | ESCC | 1.13e-04 | 2.90e-01 | 0.067 |
| 9180 | OSMR | LZE20T | Human | Esophagus | ESCC | 4.34e-03 | 2.56e-01 | 0.0662 |
| 9180 | OSMR | LZE24T | Human | Esophagus | ESCC | 5.75e-05 | -2.10e-02 | 0.0596 |
| 9180 | OSMR | P1T-E | Human | Esophagus | ESCC | 1.47e-03 | 2.00e-01 | 0.0875 |
| 9180 | OSMR | P2T-E | Human | Esophagus | ESCC | 1.67e-12 | 8.95e-02 | 0.1177 |
| 9180 | OSMR | P4T-E | Human | Esophagus | ESCC | 2.16e-06 | -8.94e-03 | 0.1323 |
| 9180 | OSMR | P5T-E | Human | Esophagus | ESCC | 7.49e-18 | 2.42e-01 | 0.1327 |
| 9180 | OSMR | P8T-E | Human | Esophagus | ESCC | 2.17e-12 | 3.13e-01 | 0.0889 |
| 9180 | OSMR | P9T-E | Human | Esophagus | ESCC | 1.66e-17 | 4.18e-01 | 0.1131 |
| 9180 | OSMR | P10T-E | Human | Esophagus | ESCC | 1.73e-16 | 1.85e-01 | 0.116 |
| 9180 | OSMR | P11T-E | Human | Esophagus | ESCC | 4.32e-04 | 3.83e-02 | 0.1426 |
| 9180 | OSMR | P12T-E | Human | Esophagus | ESCC | 2.95e-10 | 2.23e-02 | 0.1122 |
| Page: 1 2 3 4 5 6 |
| Tissue | Expression Dynamics | Abbreviation |
| Cervix |  | CC: Cervix cancer |
| HSIL_HPV: HPV-infected high-grade squamous intraepithelial lesions | ||
| N_HPV: HPV-infected normal cervix | ||
| Esophagus |  | ESCC: Esophageal squamous cell carcinoma |
| HGIN: High-grade intraepithelial neoplasias | ||
| LGIN: Low-grade intraepithelial neoplasias | ||
| Liver | 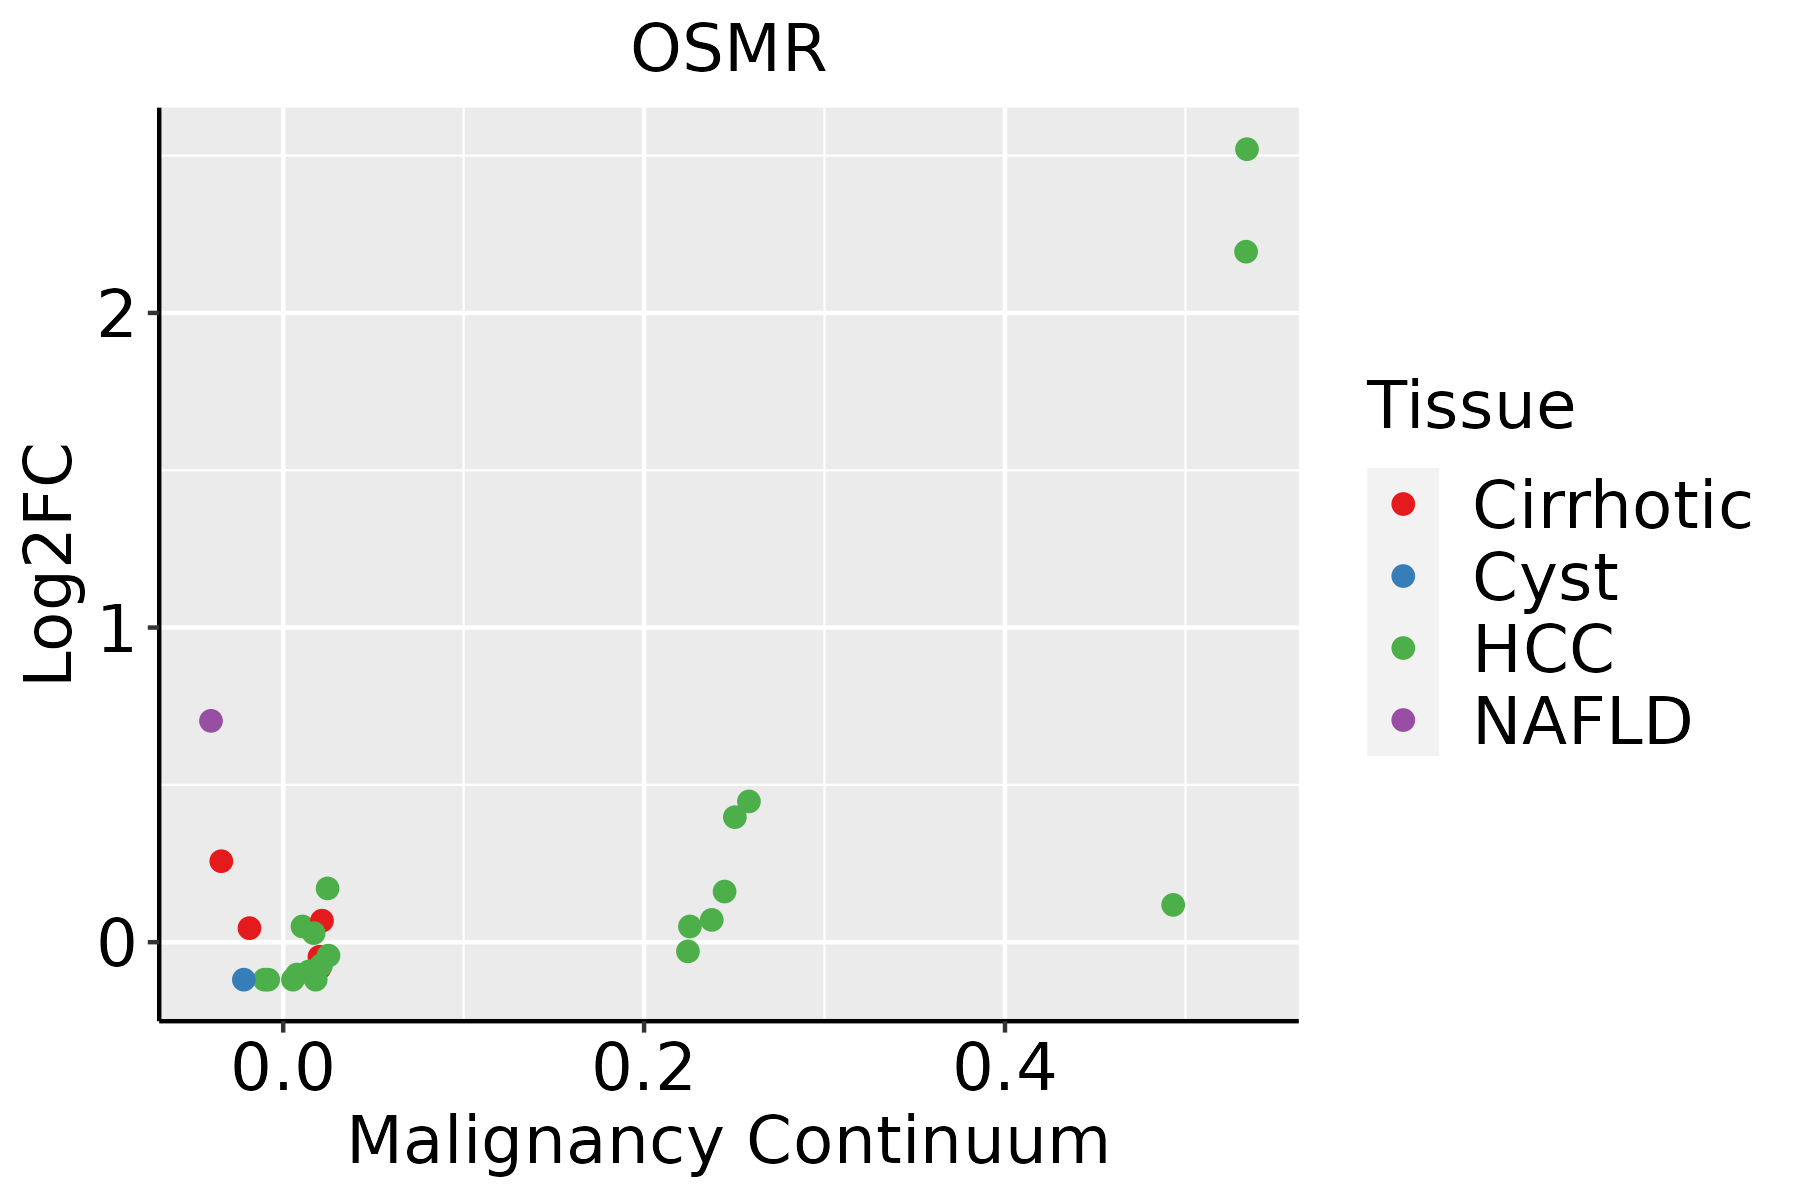 | HCC: Hepatocellular carcinoma |
| NAFLD: Non-alcoholic fatty liver disease | ||
| Oral Cavity | 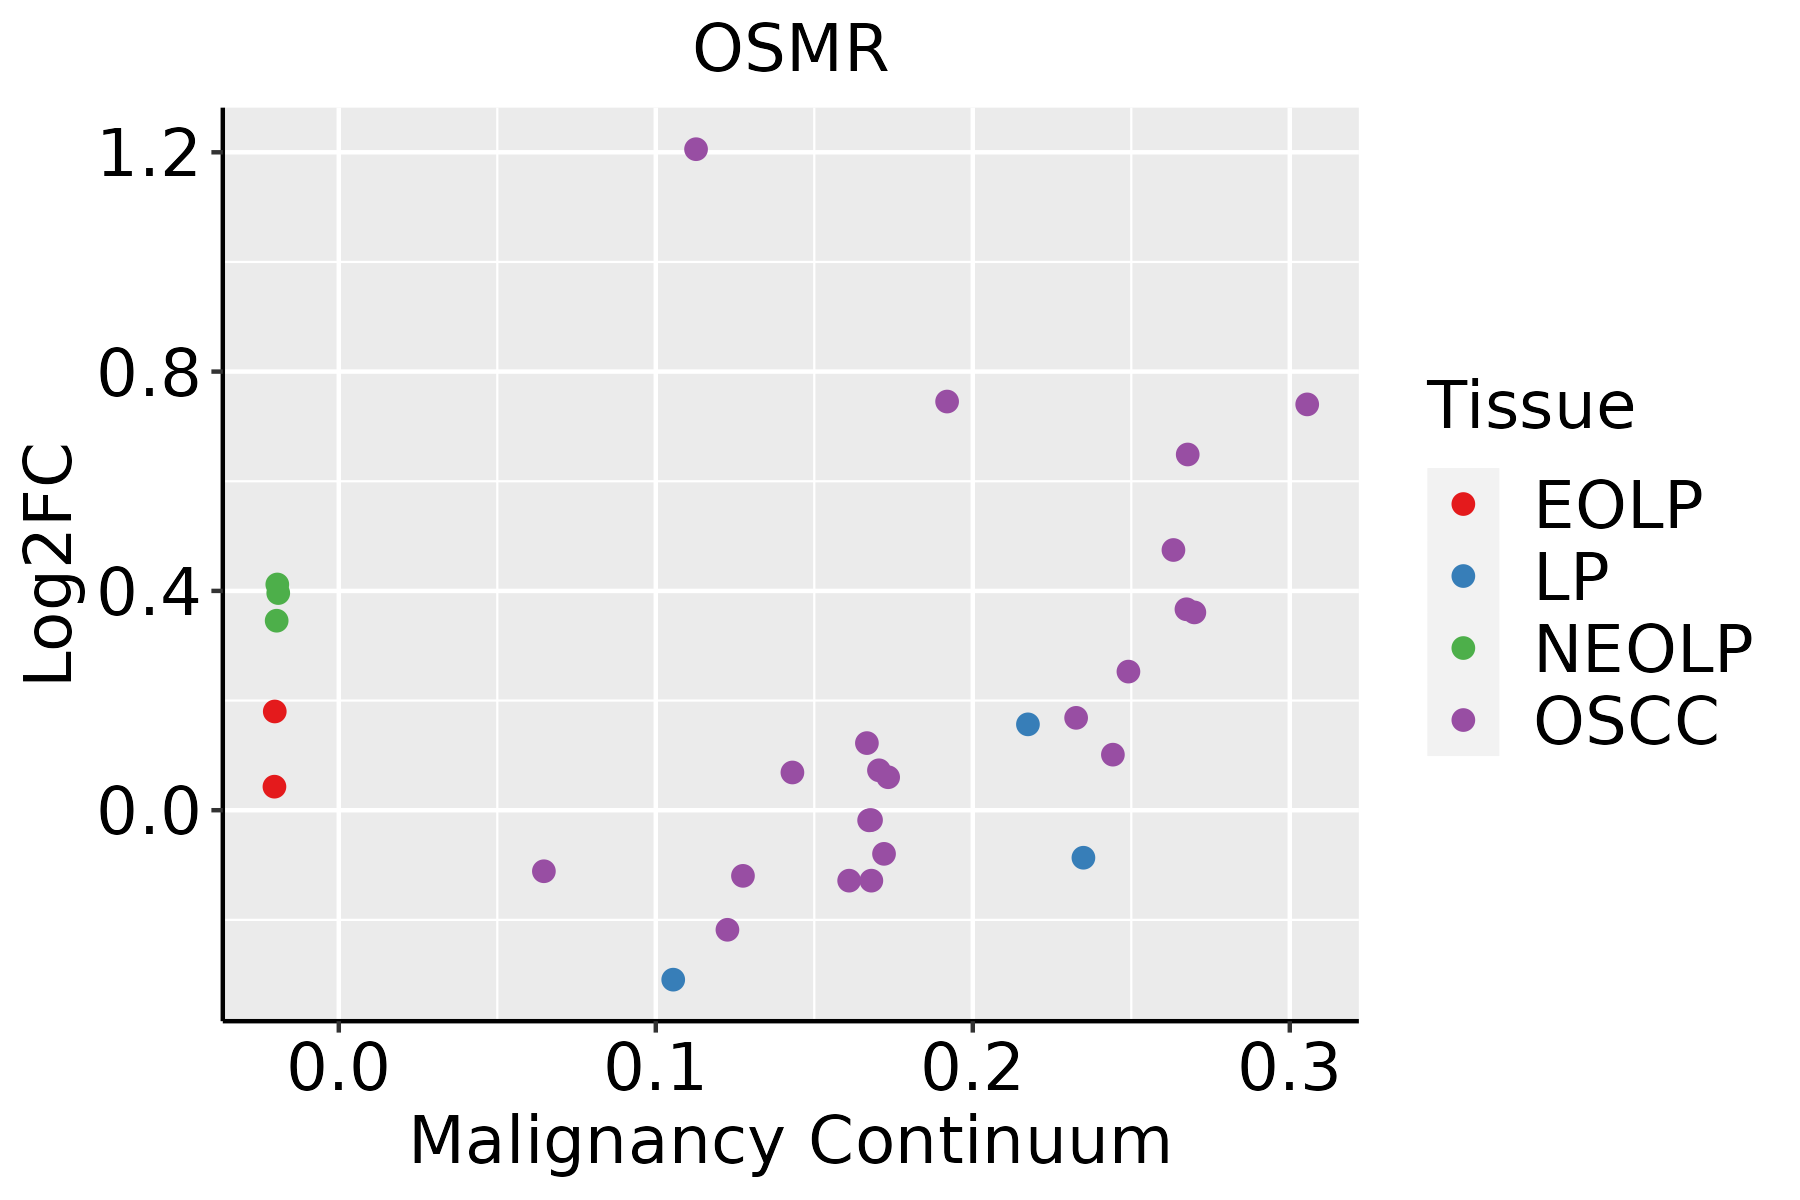 | EOLP: Erosive Oral lichen planus |
| LP: leukoplakia | ||
| NEOLP: Non-erosive oral lichen planus | ||
| OSCC: Oral squamous cell carcinoma | ||
| Skin | 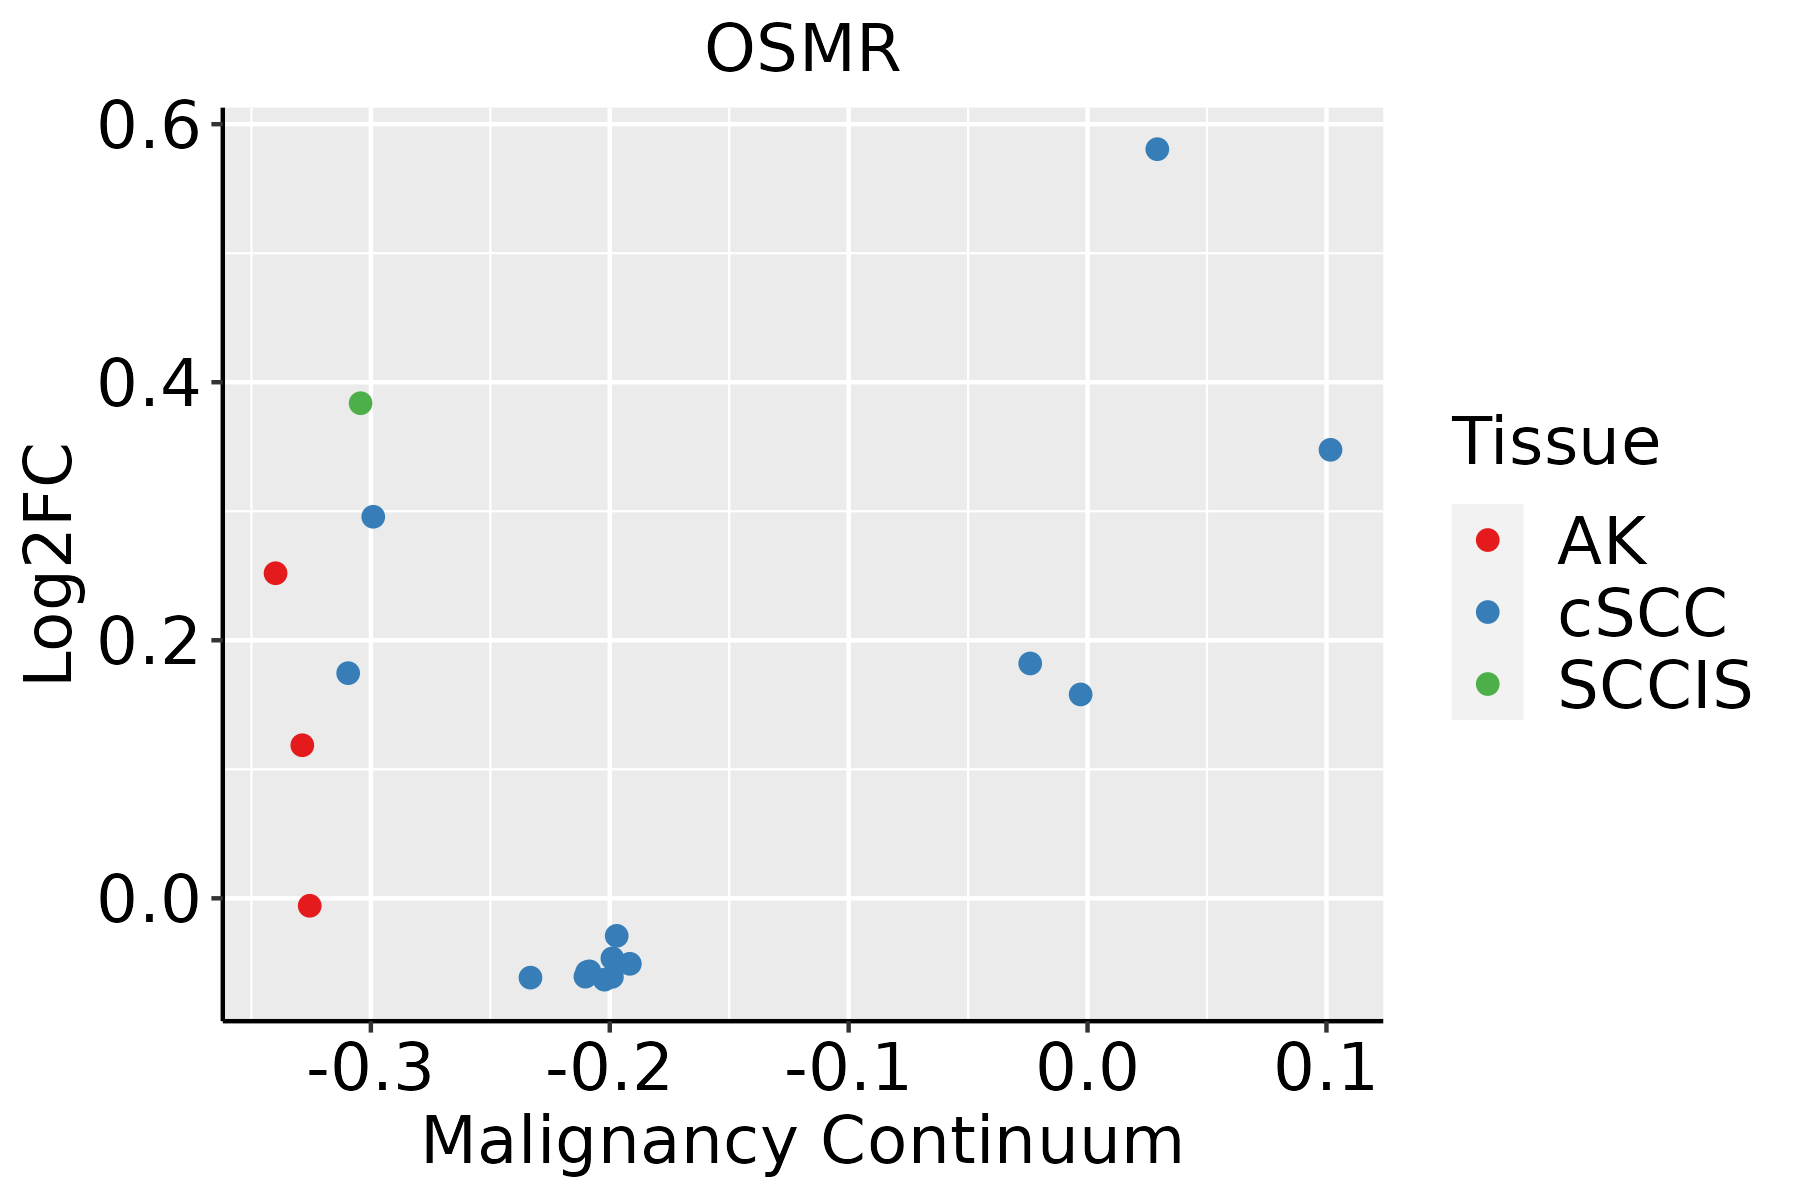 | AK: Actinic keratosis |
| cSCC: Cutaneous squamous cell carcinoma | ||
| SCCIS:squamous cell carcinoma in situ | ||
| Thyroid | 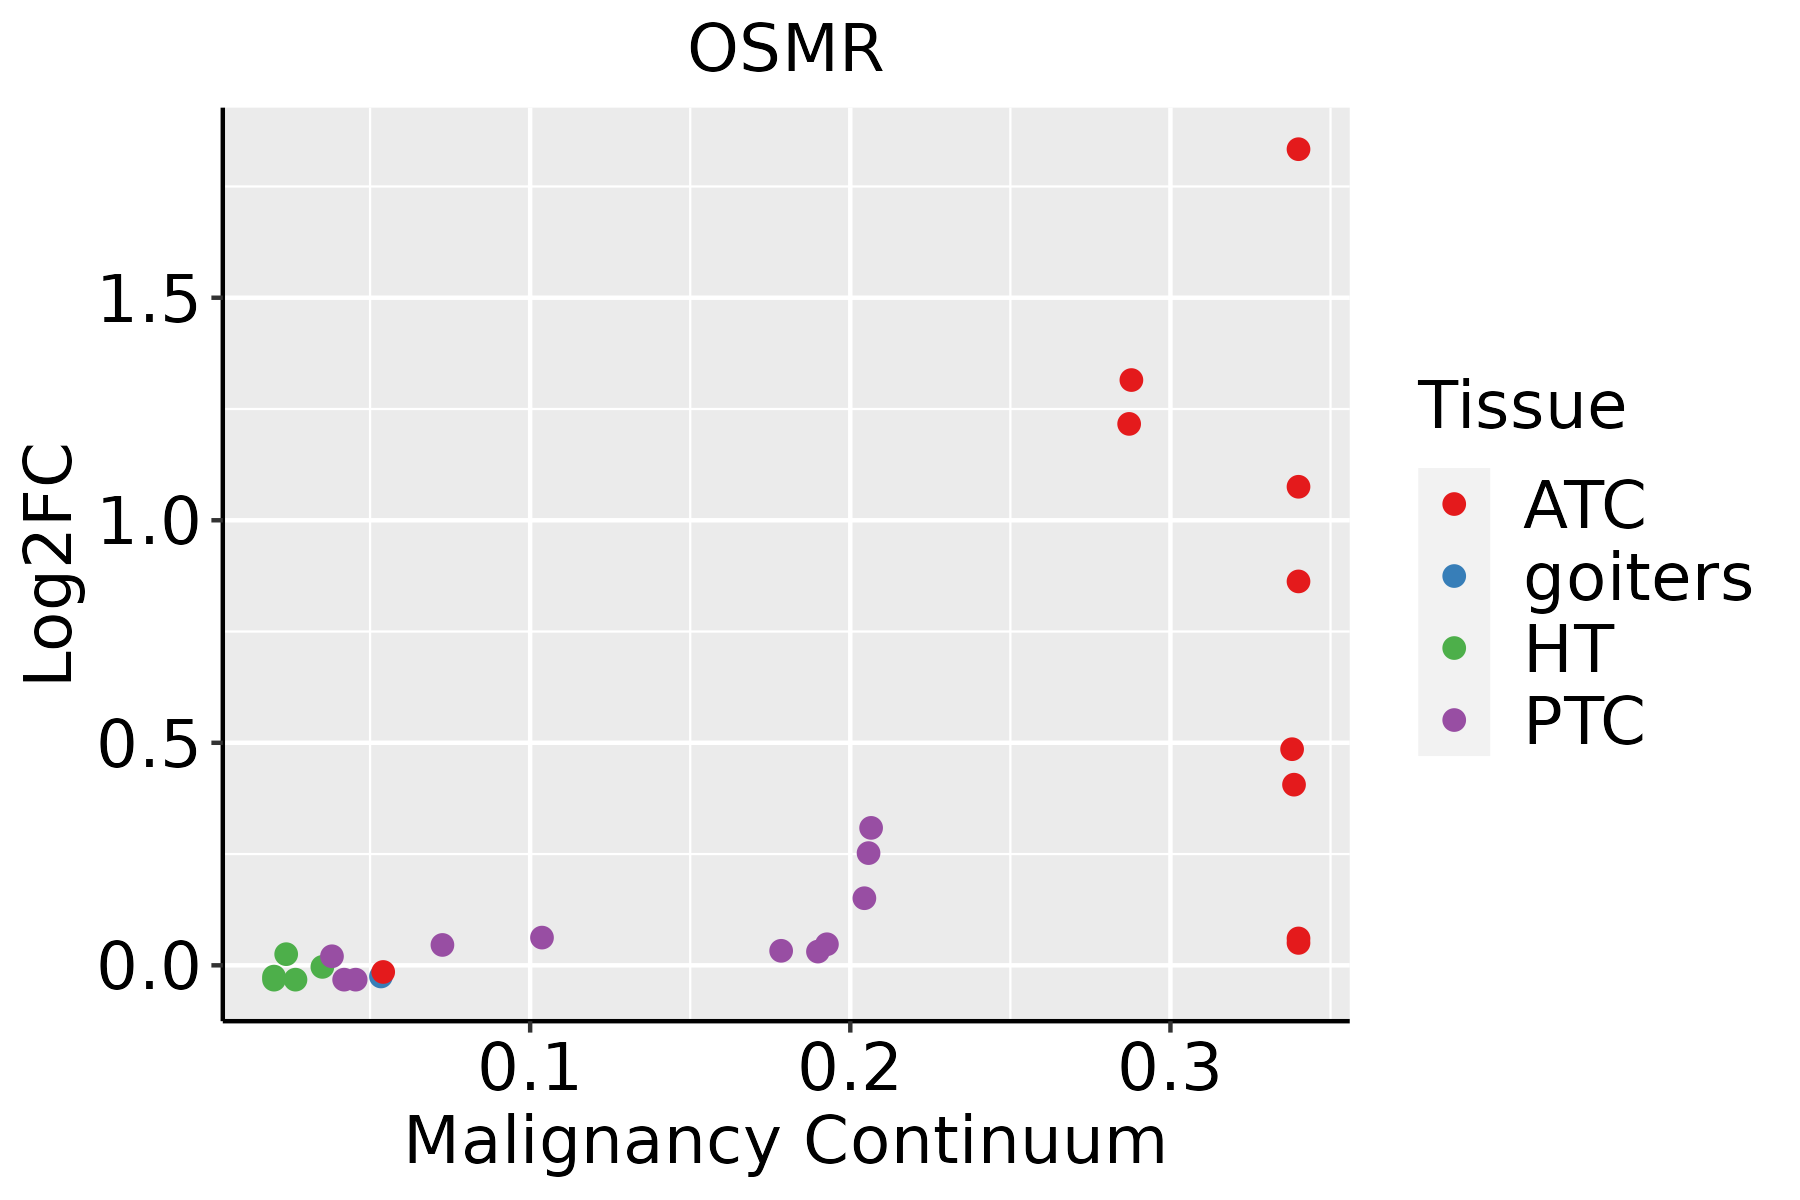 | ATC: Anaplastic thyroid cancer |
| HT: Hashimoto's thyroiditis | ||
| PTC: Papillary thyroid cancer |
| ∗log2FC in expression of this searched gene in stem-like cells from each diseased tissue sample relative to stem-like cells in normal samples in each tissue plotted against the malignancy continuum. Samples are colored based on if they are from different disease stage. |
Top |
Malignant transformation related pathway analysis |
| Find out the enriched GO biological processes and KEGG pathways involved in transition from healthy to precancer to cancer |
| Tissue | Disease Stage | Enriched GO biological Processes |
| Colorectum | AD |  |
| Colorectum | SER |  |
| Colorectum | MSS |  |
| Colorectum | MSI-H |  |
| Colorectum | FAP |  |
| ∗Top 15 enriched GO BP terms are showed in the bar plot of each disease state in each tissue. Each row represents a significant GO biological process which is colored according to the -log10(p.adjust). |
| Page: 1 2 3 4 5 6 7 8 9 |
| GO ID | Tissue | Disease Stage | Description | Gene Ratio | Bg Ratio | pvalue | p.adjust | Count |
| GO:00321035 | Cervix | CC | positive regulation of response to external stimulus | 95/2311 | 427/18723 | 5.44e-09 | 5.03e-07 | 95 |
| GO:00313494 | Cervix | CC | positive regulation of defense response | 60/2311 | 278/18723 | 9.38e-06 | 2.11e-04 | 60 |
| GO:00507273 | Cervix | CC | regulation of inflammatory response | 75/2311 | 386/18723 | 3.95e-05 | 6.18e-04 | 75 |
| GO:00507294 | Cervix | CC | positive regulation of inflammatory response | 34/2311 | 142/18723 | 9.51e-05 | 1.25e-03 | 34 |
| GO:00192213 | Cervix | CC | cytokine-mediated signaling pathway | 84/2311 | 472/18723 | 3.25e-04 | 3.44e-03 | 84 |
| GO:0002526 | Liver | NAFLD | acute inflammatory response | 26/1882 | 112/18723 | 3.68e-05 | 9.23e-04 | 26 |
| GO:00025262 | Liver | HCC | acute inflammatory response | 62/7958 | 112/18723 | 4.06e-03 | 1.77e-02 | 62 |
| GO:00321037 | Oral cavity | OSCC | positive regulation of response to external stimulus | 203/7305 | 427/18723 | 1.79e-04 | 1.22e-03 | 203 |
| GO:00192214 | Oral cavity | OSCC | cytokine-mediated signaling pathway | 222/7305 | 472/18723 | 2.02e-04 | 1.35e-03 | 222 |
| GO:00313495 | Oral cavity | OSCC | positive regulation of defense response | 127/7305 | 278/18723 | 1.32e-02 | 4.39e-02 | 127 |
| GO:001922112 | Oral cavity | EOLP | cytokine-mediated signaling pathway | 94/2218 | 472/18723 | 2.36e-07 | 7.37e-06 | 94 |
| GO:003210314 | Oral cavity | EOLP | positive regulation of response to external stimulus | 84/2218 | 427/18723 | 1.72e-06 | 3.99e-05 | 84 |
| GO:003134912 | Oral cavity | EOLP | positive regulation of defense response | 53/2218 | 278/18723 | 3.00e-04 | 2.81e-03 | 53 |
| GO:00507274 | Oral cavity | EOLP | regulation of inflammatory response | 66/2218 | 386/18723 | 1.34e-03 | 9.33e-03 | 66 |
| GO:001922122 | Oral cavity | NEOLP | cytokine-mediated signaling pathway | 88/2005 | 472/18723 | 1.37e-07 | 4.80e-06 | 88 |
| GO:003210323 | Oral cavity | NEOLP | positive regulation of response to external stimulus | 81/2005 | 427/18723 | 2.04e-07 | 6.74e-06 | 81 |
| GO:003134922 | Oral cavity | NEOLP | positive regulation of defense response | 47/2005 | 278/18723 | 1.05e-03 | 7.99e-03 | 47 |
| GO:00025265 | Oral cavity | NEOLP | acute inflammatory response | 23/2005 | 112/18723 | 1.59e-03 | 1.11e-02 | 23 |
| GO:005072712 | Oral cavity | NEOLP | regulation of inflammatory response | 60/2005 | 386/18723 | 1.99e-03 | 1.33e-02 | 60 |
| GO:00507295 | Oral cavity | NEOLP | positive regulation of inflammatory response | 25/2005 | 142/18723 | 8.58e-03 | 4.15e-02 | 25 |
| Page: 1 2 |
| Pathway ID | Tissue | Disease Stage | Description | Gene Ratio | Bg Ratio | pvalue | p.adjust | qvalue | Count |
| hsa041517 | Esophagus | ESCC | PI3K-Akt signaling pathway | 197/4205 | 354/8465 | 1.24e-02 | 2.83e-02 | 1.45e-02 | 197 |
| hsa0415114 | Esophagus | ESCC | PI3K-Akt signaling pathway | 197/4205 | 354/8465 | 1.24e-02 | 2.83e-02 | 1.45e-02 | 197 |
| hsa041516 | Oral cavity | OSCC | PI3K-Akt signaling pathway | 185/3704 | 354/8465 | 6.26e-04 | 1.86e-03 | 9.49e-04 | 185 |
| hsa0415113 | Oral cavity | OSCC | PI3K-Akt signaling pathway | 185/3704 | 354/8465 | 6.26e-04 | 1.86e-03 | 9.49e-04 | 185 |
| hsa0415123 | Oral cavity | EOLP | PI3K-Akt signaling pathway | 73/1218 | 354/8465 | 7.03e-04 | 2.69e-03 | 1.59e-03 | 73 |
| hsa04630 | Oral cavity | EOLP | JAK-STAT signaling pathway | 35/1218 | 166/8465 | 1.15e-02 | 3.07e-02 | 1.81e-02 | 35 |
| hsa0415133 | Oral cavity | EOLP | PI3K-Akt signaling pathway | 73/1218 | 354/8465 | 7.03e-04 | 2.69e-03 | 1.59e-03 | 73 |
| hsa046301 | Oral cavity | EOLP | JAK-STAT signaling pathway | 35/1218 | 166/8465 | 1.15e-02 | 3.07e-02 | 1.81e-02 | 35 |
| hsa0415141 | Oral cavity | NEOLP | PI3K-Akt signaling pathway | 79/1112 | 354/8465 | 8.42e-07 | 9.92e-06 | 6.24e-06 | 79 |
| hsa0415151 | Oral cavity | NEOLP | PI3K-Akt signaling pathway | 79/1112 | 354/8465 | 8.42e-07 | 9.92e-06 | 6.24e-06 | 79 |
| Page: 1 |
Top |
Cell-cell communication analysis |
| Identification of potential cell-cell interactions between two cell types and their ligand-receptor pairs for different disease states |
| Ligand | Receptor | LRpair | Pathway | Tissue | Disease Stage |
| OSM | OSMR_IL6ST | OSM_OSMR_IL6ST | OSM | Breast | DCIS |
| OSM | OSMR_IL6ST | OSM_OSMR_IL6ST | OSM | Breast | Healthy |
| OSM | OSMR_IL6ST | OSM_OSMR_IL6ST | OSM | Cervix | CC |
| OSM | OSMR_IL6ST | OSM_OSMR_IL6ST | OSM | Cervix | Healthy |
| OSM | OSMR_IL6ST | OSM_OSMR_IL6ST | OSM | Cervix | Precancer |
| OSM | OSMR_IL6ST | OSM_OSMR_IL6ST | OSM | Endometrium | ADJ |
| OSM | OSMR_IL6ST | OSM_OSMR_IL6ST | OSM | Endometrium | AEH |
| OSM | OSMR_IL6ST | OSM_OSMR_IL6ST | OSM | Endometrium | EEC |
| OSM | OSMR_IL6ST | OSM_OSMR_IL6ST | OSM | Endometrium | Healthy |
| OSM | OSMR_IL6ST | OSM_OSMR_IL6ST | OSM | Esophagus | ESCC |
| OSM | OSMR_IL6ST | OSM_OSMR_IL6ST | OSM | HNSCC | Healthy |
| OSM | OSMR_IL6ST | OSM_OSMR_IL6ST | OSM | HNSCC | OSCC |
| OSM | OSMR_IL6ST | OSM_OSMR_IL6ST | OSM | Liver | HCC |
| OSM | OSMR_IL6ST | OSM_OSMR_IL6ST | OSM | Lung | AAH |
| OSM | OSMR_IL6ST | OSM_OSMR_IL6ST | OSM | Lung | AIS |
| OSM | OSMR_IL6ST | OSM_OSMR_IL6ST | OSM | Lung | IAC |
| OSM | OSMR_IL6ST | OSM_OSMR_IL6ST | OSM | Lung | Precancer |
| OSM | OSMR_IL6ST | OSM_OSMR_IL6ST | OSM | Prostate | ADJ |
| OSM | OSMR_IL6ST | OSM_OSMR_IL6ST | OSM | Prostate | BPH |
| OSM | OSMR_IL6ST | OSM_OSMR_IL6ST | OSM | Skin | ADJ |
| Page: 1 |
Top |
Single-cell gene regulatory network inference analysis |
| Find out the significant the regulons (TFs) and the target genes of each regulon across cell types for different disease states |
| TF | Cell Type | Tissue | Disease Stage | Target Gene | RSS | Regulon Activity |
| ∗The dot plots of a searched regulon are shown for all cell subpopulations in each disease state of each tissue based on the regulon specific score inferred using pySCENIC and by calculating the average expression. |
| Page: 1 |
Top |
Somatic mutation of malignant transformation related genes |
| Annotation of somatic variants for genes involved in malignant transformation |
| Hugo Symbol | Variant Class | Variant Classification | dbSNP RS | HGVSc | HGVSp | HGVSp Short | SWISSPROT | BIOTYPE | SIFT | PolyPhen | Tumor Sample Barcode | Tissue | Histology | Sex | Age | Stage | Therapy Types | Drugs | Outcome |
| OSMR | SNV | Missense_Mutation | c.2782N>T | p.Asp928Tyr | p.D928Y | Q99650 | protein_coding | deleterious(0.02) | probably_damaging(0.978) | TCGA-A2-A25A-01 | Breast | breast invasive carcinoma | Female | <65 | I/II | Unspecific | Cytoxan | SD | |
| OSMR | SNV | Missense_Mutation | c.805A>C | p.Lys269Gln | p.K269Q | Q99650 | protein_coding | tolerated(0.59) | benign(0.009) | TCGA-AO-A03O-01 | Breast | breast invasive carcinoma | Female | >=65 | I/II | Chemotherapy | doxorubicin | SD | |
| OSMR | SNV | Missense_Mutation | c.604N>G | p.Ser202Gly | p.S202G | Q99650 | protein_coding | deleterious(0.02) | benign(0.01) | TCGA-B6-A0I6-01 | Breast | breast invasive carcinoma | Female | <65 | I/II | Unknown | Unknown | PD | |
| OSMR | SNV | Missense_Mutation | novel | c.523A>G | p.Asn175Asp | p.N175D | Q99650 | protein_coding | tolerated(0.64) | benign(0) | TCGA-B6-A0RS-01 | Breast | breast invasive carcinoma | Female | <65 | I/II | Unknown | Unknown | PD |
| OSMR | SNV | Missense_Mutation | c.1266N>A | p.Asn422Lys | p.N422K | Q99650 | protein_coding | tolerated(0.89) | benign(0.005) | TCGA-C8-A131-01 | Breast | breast invasive carcinoma | Female | >=65 | III/IV | Chemotherapy | 5-fluorouracil | CR | |
| OSMR | SNV | Missense_Mutation | c.1392G>C | p.Lys464Asn | p.K464N | Q99650 | protein_coding | deleterious(0.04) | possibly_damaging(0.617) | TCGA-D8-A13Z-01 | Breast | breast invasive carcinoma | Female | <65 | I/II | Chemotherapy | doxorubicine | SD | |
| OSMR | SNV | Missense_Mutation | novel | c.1431N>C | p.Lys477Asn | p.K477N | Q99650 | protein_coding | tolerated(0.36) | benign(0.003) | TCGA-EW-A1IX-01 | Breast | breast invasive carcinoma | Female | <65 | I/II | Hormone Therapy | femara | SD |
| OSMR | SNV | Missense_Mutation | novel | c.2719G>A | p.Glu907Lys | p.E907K | Q99650 | protein_coding | deleterious(0.02) | possibly_damaging(0.551) | TCGA-VS-A953-01 | Cervix | cervical & endocervical cancer | Female | <65 | I/II | Unknown | Unknown | PD |
| OSMR | SNV | Missense_Mutation | c.706G>T | p.Val236Leu | p.V236L | Q99650 | protein_coding | tolerated(0.15) | benign(0.123) | TCGA-A6-6650-01 | Colorectum | colon adenocarcinoma | Female | >=65 | I/II | Unknown | Unknown | SD | |
| OSMR | SNV | Missense_Mutation | rs145073771 | c.2254G>A | p.Val752Ile | p.V752I | Q99650 | protein_coding | tolerated(0.41) | benign(0.005) | TCGA-A6-6781-01 | Colorectum | colon adenocarcinoma | Male | <65 | III/IV | Chemotherapy | oxaliplatin | SD |
| Page: 1 2 3 4 5 6 7 8 9 10 11 |
Top |
Related drugs of malignant transformation related genes |
| Identification of chemicals and drugs interact with genes involved in malignant transfromation |
| (DGIdb 4.0) |
| Entrez ID | Symbol | Category | Interaction Types | Drug Claim Name | Drug Name | PMIDs |
| Page: 1 |

Copyright 2023-Present -The University of Texas Health Science Center at Houston |