
|
|||||
|
 | |
| |
| |
| |
| |
| |
|
Gene: OSGIN1 |
Gene summary for OSGIN1 |
| Gene information | Species | Human | Gene symbol | OSGIN1 | Gene ID | 29948 |
| Gene name | oxidative stress induced growth inhibitor 1 | |
| Gene Alias | BDGI | |
| Cytomap | 16q23.3 | |
| Gene Type | protein-coding | GO ID | GO:0001558 | UniProtAcc | Q9UJX0 |
Top |
Malignant transformation analysis |
| Identification of the aberrant gene expression in precancerous and cancerous lesions by comparing the gene expression of stem-like cells in diseased tissues with normal stem cells |
| Entrez ID | Symbol | Replicates | Species | Organ | Tissue | Adj P-value | Log2FC | Malignancy |
| 29948 | OSGIN1 | LZE2T | Human | Esophagus | ESCC | 5.44e-10 | 7.35e-01 | 0.082 |
| 29948 | OSGIN1 | LZE4T | Human | Esophagus | ESCC | 2.41e-27 | 1.01e+00 | 0.0811 |
| 29948 | OSGIN1 | LZE7T | Human | Esophagus | ESCC | 1.40e-08 | 3.98e-01 | 0.0667 |
| 29948 | OSGIN1 | LZE21D1 | Human | Esophagus | HGIN | 3.53e-05 | 5.13e-01 | 0.0632 |
| 29948 | OSGIN1 | LZE22T | Human | Esophagus | ESCC | 1.00e-09 | 4.64e-01 | 0.068 |
| 29948 | OSGIN1 | LZE24T | Human | Esophagus | ESCC | 4.15e-02 | 9.00e-02 | 0.0596 |
| 29948 | OSGIN1 | LZE21T | Human | Esophagus | ESCC | 2.14e-10 | 5.83e-01 | 0.0655 |
| 29948 | OSGIN1 | P1T-E | Human | Esophagus | ESCC | 4.62e-03 | 2.39e-01 | 0.0875 |
| 29948 | OSGIN1 | P4T-E | Human | Esophagus | ESCC | 6.14e-11 | 2.90e-01 | 0.1323 |
| 29948 | OSGIN1 | P9T-E | Human | Esophagus | ESCC | 4.38e-26 | 6.25e-01 | 0.1131 |
| 29948 | OSGIN1 | P11T-E | Human | Esophagus | ESCC | 6.74e-09 | 4.13e-01 | 0.1426 |
| 29948 | OSGIN1 | P12T-E | Human | Esophagus | ESCC | 3.06e-13 | 3.98e-01 | 0.1122 |
| 29948 | OSGIN1 | P15T-E | Human | Esophagus | ESCC | 5.99e-45 | 9.79e-01 | 0.1149 |
| 29948 | OSGIN1 | P19T-E | Human | Esophagus | ESCC | 7.48e-03 | 2.15e-01 | 0.1662 |
| 29948 | OSGIN1 | P20T-E | Human | Esophagus | ESCC | 3.97e-02 | 1.06e-01 | 0.1124 |
| 29948 | OSGIN1 | P21T-E | Human | Esophagus | ESCC | 2.42e-09 | 2.45e-01 | 0.1617 |
| 29948 | OSGIN1 | P22T-E | Human | Esophagus | ESCC | 5.44e-16 | 4.09e-01 | 0.1236 |
| 29948 | OSGIN1 | P23T-E | Human | Esophagus | ESCC | 2.13e-09 | 2.55e-01 | 0.108 |
| 29948 | OSGIN1 | P24T-E | Human | Esophagus | ESCC | 1.73e-03 | 2.09e-01 | 0.1287 |
| 29948 | OSGIN1 | P26T-E | Human | Esophagus | ESCC | 6.78e-09 | 2.42e-01 | 0.1276 |
| Page: 1 2 3 |
| Tissue | Expression Dynamics | Abbreviation |
| Esophagus | 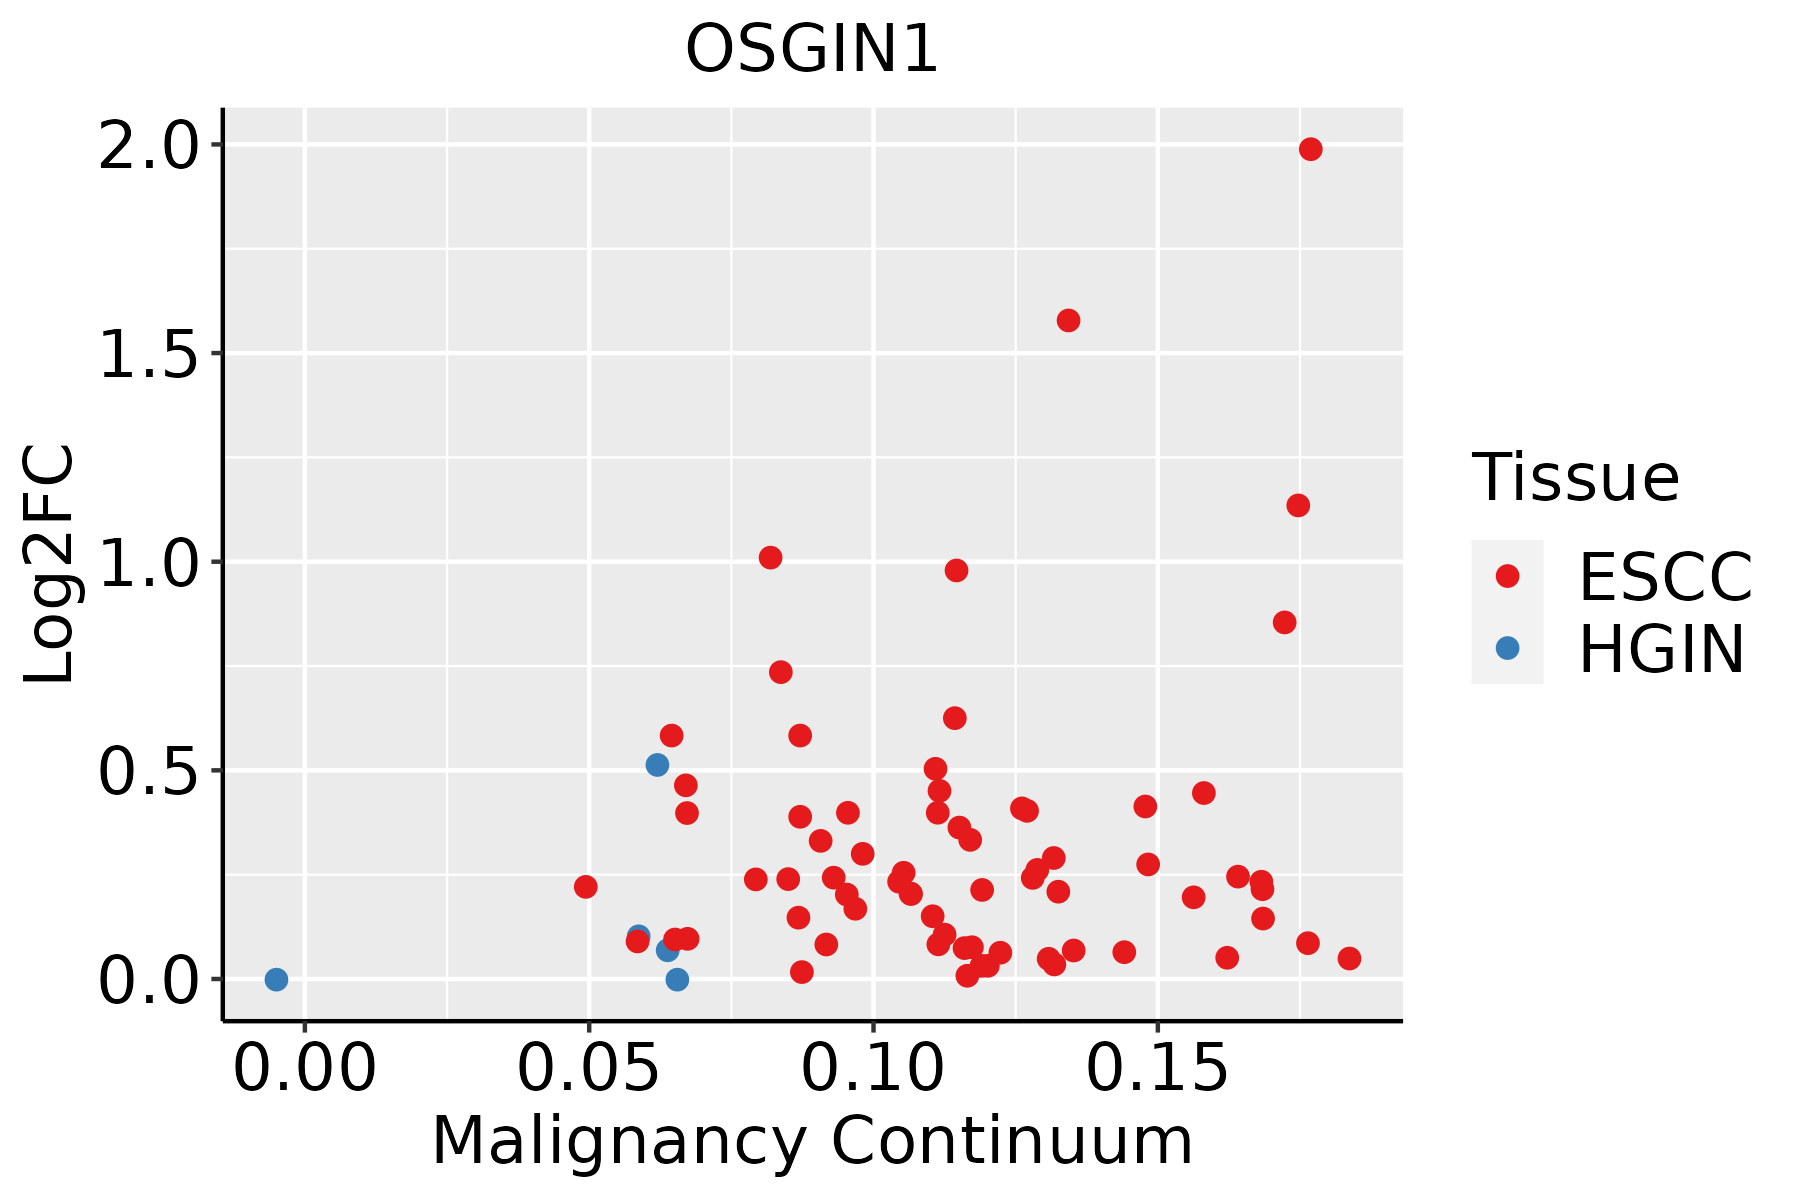 | ESCC: Esophageal squamous cell carcinoma |
| HGIN: High-grade intraepithelial neoplasias | ||
| LGIN: Low-grade intraepithelial neoplasias | ||
| Liver |  | HCC: Hepatocellular carcinoma |
| NAFLD: Non-alcoholic fatty liver disease |
| ∗log2FC in expression of this searched gene in stem-like cells from each diseased tissue sample relative to stem-like cells in normal samples in each tissue plotted against the malignancy continuum. Samples are colored based on if they are from different disease stage. |
Top |
Malignant transformation related pathway analysis |
| Find out the enriched GO biological processes and KEGG pathways involved in transition from healthy to precancer to cancer |
| Tissue | Disease Stage | Enriched GO biological Processes |
| Colorectum | AD |  |
| Colorectum | SER |  |
| Colorectum | MSS |  |
| Colorectum | MSI-H |  |
| Colorectum | FAP |  |
| ∗Top 15 enriched GO BP terms are showed in the bar plot of each disease state in each tissue. Each row represents a significant GO biological process which is colored according to the -log10(p.adjust). |
| Page: 1 2 3 4 5 6 7 8 9 |
| GO ID | Tissue | Disease Stage | Description | Gene Ratio | Bg Ratio | pvalue | p.adjust | Count |
| GO:001604919 | Esophagus | HGIN | cell growth | 93/2587 | 482/18723 | 4.49e-04 | 6.62e-03 | 93 |
| GO:000155818 | Esophagus | HGIN | regulation of cell growth | 76/2587 | 414/18723 | 5.40e-03 | 4.42e-02 | 76 |
| GO:0016049110 | Esophagus | ESCC | cell growth | 289/8552 | 482/18723 | 1.29e-10 | 3.77e-09 | 289 |
| GO:000155819 | Esophagus | ESCC | regulation of cell growth | 248/8552 | 414/18723 | 2.97e-09 | 6.45e-08 | 248 |
| GO:00459267 | Esophagus | ESCC | negative regulation of growth | 148/8552 | 249/18723 | 7.88e-06 | 7.73e-05 | 148 |
| GO:00303085 | Esophagus | ESCC | negative regulation of cell growth | 108/8552 | 188/18723 | 7.46e-04 | 3.87e-03 | 108 |
| GO:001604921 | Liver | HCC | cell growth | 269/7958 | 482/18723 | 1.84e-09 | 5.35e-08 | 269 |
| GO:000155821 | Liver | HCC | regulation of cell growth | 228/7958 | 414/18723 | 1.34e-07 | 2.55e-06 | 228 |
| GO:00459263 | Liver | HCC | negative regulation of growth | 129/7958 | 249/18723 | 1.81e-03 | 9.37e-03 | 129 |
| GO:0030308 | Liver | HCC | negative regulation of cell growth | 98/7958 | 188/18723 | 4.74e-03 | 2.02e-02 | 98 |
| Page: 1 |
| Pathway ID | Tissue | Disease Stage | Description | Gene Ratio | Bg Ratio | pvalue | p.adjust | qvalue | Count |
| Page: 1 |
Top |
Cell-cell communication analysis |
| Identification of potential cell-cell interactions between two cell types and their ligand-receptor pairs for different disease states |
| Ligand | Receptor | LRpair | Pathway | Tissue | Disease Stage |
| Page: 1 |
Top |
Single-cell gene regulatory network inference analysis |
| Find out the significant the regulons (TFs) and the target genes of each regulon across cell types for different disease states |
| TF | Cell Type | Tissue | Disease Stage | Target Gene | RSS | Regulon Activity |
| ∗The dot plots of a searched regulon are shown for all cell subpopulations in each disease state of each tissue based on the regulon specific score inferred using pySCENIC and by calculating the average expression. |
| Page: 1 |
Top |
Somatic mutation of malignant transformation related genes |
| Annotation of somatic variants for genes involved in malignant transformation |
| Hugo Symbol | Variant Class | Variant Classification | dbSNP RS | HGVSc | HGVSp | HGVSp Short | SWISSPROT | BIOTYPE | SIFT | PolyPhen | Tumor Sample Barcode | Tissue | Histology | Sex | Age | Stage | Therapy Types | Drugs | Outcome |
| OSGIN1 | SNV | Missense_Mutation | novel | c.8C>G | p.Ser3Cys | p.S3C | Q9UJX0 | protein_coding | deleterious_low_confidence(0.04) | benign(0.334) | TCGA-3C-AALI-01 | Breast | breast invasive carcinoma | Female | <65 | I/II | Unspecific | Poly E | Complete Response |
| OSGIN1 | SNV | Missense_Mutation | rs199961380 | c.485N>A | p.Arg162Gln | p.R162Q | Q9UJX0 | protein_coding | tolerated(0.08) | possibly_damaging(0.632) | TCGA-EW-A6S9-01 | Breast | breast invasive carcinoma | Female | <65 | I/II | Unknown | Unknown | SD |
| OSGIN1 | SNV | Missense_Mutation | novel | c.583G>T | p.Gly195Cys | p.G195C | Q9UJX0 | protein_coding | deleterious(0.01) | probably_damaging(0.995) | TCGA-RA-A741-01 | Cervix | cervical & endocervical cancer | Female | <65 | I/II | Chemotherapy | cisplatin | SD |
| OSGIN1 | SNV | Missense_Mutation | novel | c.1416N>C | p.Glu472Asp | p.E472D | Q9UJX0 | protein_coding | tolerated(0.25) | benign(0.112) | TCGA-VS-A9V3-01 | Cervix | cervical & endocervical cancer | Female | <65 | I/II | Chemotherapy | cisplatin | PD |
| OSGIN1 | SNV | Missense_Mutation | novel | c.1018G>A | p.Val340Met | p.V340M | Q9UJX0 | protein_coding | deleterious(0) | probably_damaging(0.921) | TCGA-A6-3809-01 | Colorectum | colon adenocarcinoma | Female | >=65 | I/II | Unknown | Unknown | SD |
| OSGIN1 | SNV | Missense_Mutation | c.319N>A | p.Leu107Ile | p.L107I | Q9UJX0 | protein_coding | tolerated(0.06) | probably_damaging(0.991) | TCGA-AA-3833-01 | Colorectum | colon adenocarcinoma | Female | <65 | I/II | Unknown | Unknown | SD | |
| OSGIN1 | SNV | Missense_Mutation | c.1081C>A | p.Leu361Ile | p.L361I | Q9UJX0 | protein_coding | tolerated(0.09) | possibly_damaging(0.696) | TCGA-F4-6703-01 | Colorectum | colon adenocarcinoma | Male | <65 | I/II | Unknown | Unknown | SD | |
| OSGIN1 | SNV | Missense_Mutation | c.1003C>T | p.Pro335Ser | p.P335S | Q9UJX0 | protein_coding | deleterious(0) | probably_damaging(0.999) | TCGA-G4-6628-01 | Colorectum | colon adenocarcinoma | Male | >=65 | I/II | Unknown | Unknown | SD | |
| OSGIN1 | SNV | Missense_Mutation | c.890C>T | p.Ala297Val | p.A297V | Q9UJX0 | protein_coding | deleterious(0) | probably_damaging(0.999) | TCGA-NH-A5IV-01 | Colorectum | colon adenocarcinoma | Female | >=65 | I/II | Unknown | Unknown | SD | |
| OSGIN1 | SNV | Missense_Mutation | rs751178429 | c.1201G>A | p.Asp401Asn | p.D401N | Q9UJX0 | protein_coding | tolerated(1) | benign(0.003) | TCGA-NH-A6GB-01 | Colorectum | colon adenocarcinoma | Female | >=65 | III/IV | Chemotherapy | oxaliplatin | SD |
| Page: 1 2 3 4 5 |
Top |
Related drugs of malignant transformation related genes |
| Identification of chemicals and drugs interact with genes involved in malignant transfromation |
| (DGIdb 4.0) |
| Entrez ID | Symbol | Category | Interaction Types | Drug Claim Name | Drug Name | PMIDs |
| Page: 1 |

Copyright 2023-Present -The University of Texas Health Science Center at Houston |