
|
|||||
|
 | |
| |
| |
| |
| |
| |
|
Gene: OSCP1 |
Gene summary for OSCP1 |
| Gene information | Species | Human | Gene symbol | OSCP1 | Gene ID | 127700 |
| Gene name | organic solute carrier partner 1 | |
| Gene Alias | C1orf102 | |
| Cytomap | 1p34.3 | |
| Gene Type | protein-coding | GO ID | GO:0006810 | UniProtAcc | Q8WVF1 |
Top |
Malignant transformation analysis |
| Identification of the aberrant gene expression in precancerous and cancerous lesions by comparing the gene expression of stem-like cells in diseased tissues with normal stem cells |
| Entrez ID | Symbol | Replicates | Species | Organ | Tissue | Adj P-value | Log2FC | Malignancy |
| 127700 | OSCP1 | C21 | Human | Oral cavity | OSCC | 4.87e-10 | 3.08e-01 | 0.2678 |
| 127700 | OSCP1 | C30 | Human | Oral cavity | OSCC | 6.96e-18 | 6.26e-01 | 0.3055 |
| 127700 | OSCP1 | C51 | Human | Oral cavity | OSCC | 4.40e-02 | 2.15e-01 | 0.2674 |
| 127700 | OSCP1 | SYSMH2 | Human | Oral cavity | OSCC | 1.15e-02 | 1.18e-01 | 0.2326 |
| Page: 1 |
| Tissue | Expression Dynamics | Abbreviation |
| Oral Cavity | 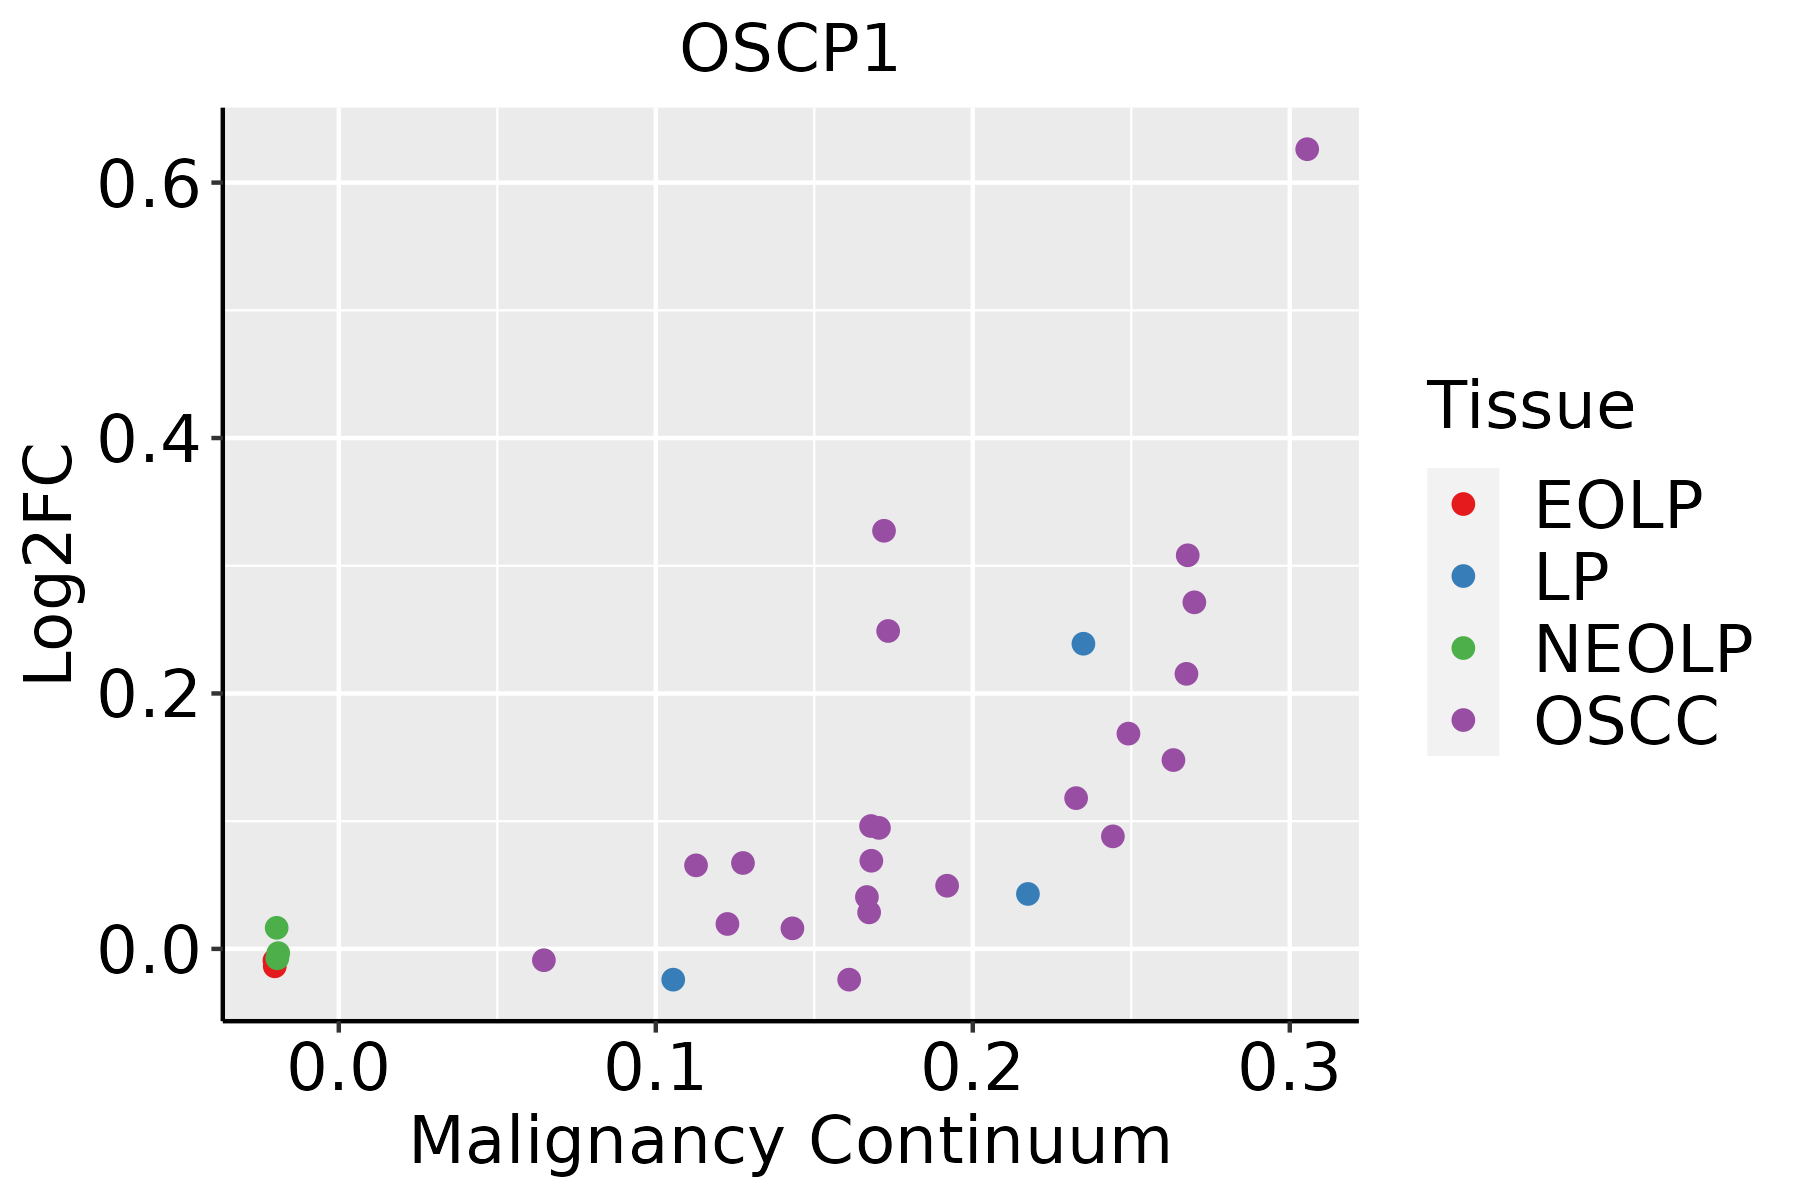 | EOLP: Erosive Oral lichen planus |
| LP: leukoplakia | ||
| NEOLP: Non-erosive oral lichen planus | ||
| OSCC: Oral squamous cell carcinoma |
| ∗log2FC in expression of this searched gene in stem-like cells from each diseased tissue sample relative to stem-like cells in normal samples in each tissue plotted against the malignancy continuum. Samples are colored based on if they are from different disease stage. |
Top |
Malignant transformation related pathway analysis |
| Find out the enriched GO biological processes and KEGG pathways involved in transition from healthy to precancer to cancer |
| Tissue | Disease Stage | Enriched GO biological Processes |
| Colorectum | AD |  |
| Colorectum | SER |  |
| Colorectum | MSS |  |
| Colorectum | MSI-H |  |
| Colorectum | FAP |  |
| ∗Top 15 enriched GO BP terms are showed in the bar plot of each disease state in each tissue. Each row represents a significant GO biological process which is colored according to the -log10(p.adjust). |
| Page: 1 2 3 4 5 6 7 8 9 |
| GO ID | Tissue | Disease Stage | Description | Gene Ratio | Bg Ratio | pvalue | p.adjust | Count |
| GO:000963618 | Oral cavity | OSCC | response to toxic substance | 137/7305 | 262/18723 | 7.94e-06 | 8.52e-05 | 137 |
| GO:009875418 | Oral cavity | OSCC | detoxification | 75/7305 | 152/18723 | 5.99e-03 | 2.28e-02 | 75 |
| Page: 1 |
| Pathway ID | Tissue | Disease Stage | Description | Gene Ratio | Bg Ratio | pvalue | p.adjust | qvalue | Count |
| Page: 1 |
Top |
Cell-cell communication analysis |
| Identification of potential cell-cell interactions between two cell types and their ligand-receptor pairs for different disease states |
| Ligand | Receptor | LRpair | Pathway | Tissue | Disease Stage |
| Page: 1 |
Top |
Single-cell gene regulatory network inference analysis |
| Find out the significant the regulons (TFs) and the target genes of each regulon across cell types for different disease states |
| TF | Cell Type | Tissue | Disease Stage | Target Gene | RSS | Regulon Activity |
| ∗The dot plots of a searched regulon are shown for all cell subpopulations in each disease state of each tissue based on the regulon specific score inferred using pySCENIC and by calculating the average expression. |
| Page: 1 |
Top |
Somatic mutation of malignant transformation related genes |
| Annotation of somatic variants for genes involved in malignant transformation |
| Hugo Symbol | Variant Class | Variant Classification | dbSNP RS | HGVSc | HGVSp | HGVSp Short | SWISSPROT | BIOTYPE | SIFT | PolyPhen | Tumor Sample Barcode | Tissue | Histology | Sex | Age | Stage | Therapy Types | Drugs | Outcome |
| OSCP1 | SNV | Missense_Mutation | c.810N>G | p.His270Gln | p.H270Q | Q8WVF1 | protein_coding | tolerated(0.29) | benign(0.001) | TCGA-A8-A0A4-01 | Breast | breast invasive carcinoma | Female | >=65 | I/II | Hormone Therapy | tamoxiphen | CR | |
| OSCP1 | SNV | Missense_Mutation | c.1099N>C | p.Glu367Gln | p.E367Q | Q8WVF1 | protein_coding | tolerated(0.14) | benign(0.017) | TCGA-AN-A0AR-01 | Breast | breast invasive carcinoma | Female | <65 | I/II | Unknown | Unknown | SD | |
| OSCP1 | SNV | Missense_Mutation | novel | c.982G>A | p.Glu328Lys | p.E328K | Q8WVF1 | protein_coding | deleterious(0.01) | possibly_damaging(0.864) | TCGA-BH-A0B0-01 | Breast | breast invasive carcinoma | Female | <65 | I/II | Chemotherapy | adriamycin | CR |
| OSCP1 | SNV | Missense_Mutation | c.97G>C | p.Asp33His | p.D33H | Q8WVF1 | protein_coding | deleterious(0) | probably_damaging(0.972) | TCGA-BH-A0E1-01 | Breast | breast invasive carcinoma | Female | <65 | I/II | Chemotherapy | cytoxan | SD | |
| OSCP1 | SNV | Missense_Mutation | rs141201826 | c.452N>A | p.Arg151Gln | p.R151Q | Q8WVF1 | protein_coding | tolerated(0.26) | benign(0.015) | TCGA-S3-AA0Z-01 | Breast | breast invasive carcinoma | Female | <65 | I/II | Ancillary | neulasta | CR |
| OSCP1 | SNV | Missense_Mutation | novel | c.256N>T | p.His86Tyr | p.H86Y | Q8WVF1 | protein_coding | deleterious(0) | probably_damaging(1) | TCGA-C5-A2LZ-01 | Cervix | cervical & endocervical cancer | Female | >=65 | III/IV | Unknown | Unknown | PD |
| OSCP1 | SNV | Missense_Mutation | c.1072G>C | p.Glu358Gln | p.E358Q | Q8WVF1 | protein_coding | tolerated(0.08) | benign(0.232) | TCGA-EA-A3HU-01 | Cervix | cervical & endocervical cancer | Female | <65 | I/II | Unknown | Unknown | SD | |
| OSCP1 | SNV | Missense_Mutation | c.215N>G | p.Tyr72Cys | p.Y72C | Q8WVF1 | protein_coding | deleterious(0) | probably_damaging(0.997) | TCGA-AA-3672-01 | Colorectum | colon adenocarcinoma | Female | >=65 | III/IV | Unknown | Unknown | SD | |
| OSCP1 | SNV | Missense_Mutation | novel | c.121A>G | p.Thr41Ala | p.T41A | Q8WVF1 | protein_coding | deleterious_low_confidence(0.04) | benign(0.415) | TCGA-AA-A00N-01 | Colorectum | colon adenocarcinoma | Male | >=65 | I/II | Unknown | Unknown | PD |
| OSCP1 | SNV | Missense_Mutation | c.895T>A | p.Leu299Met | p.L299M | Q8WVF1 | protein_coding | deleterious(0) | probably_damaging(1) | TCGA-AA-A022-01 | Colorectum | colon adenocarcinoma | Female | >=65 | I/II | Unknown | Unknown | SD |
| Page: 1 2 3 4 |
Top |
Related drugs of malignant transformation related genes |
| Identification of chemicals and drugs interact with genes involved in malignant transfromation |
| (DGIdb 4.0) |
| Entrez ID | Symbol | Category | Interaction Types | Drug Claim Name | Drug Name | PMIDs |
| Page: 1 |

Copyright 2023-Present -The University of Texas Health Science Center at Houston |