| Tissue | Expression Dynamics | Abbreviation |
| Cervix | 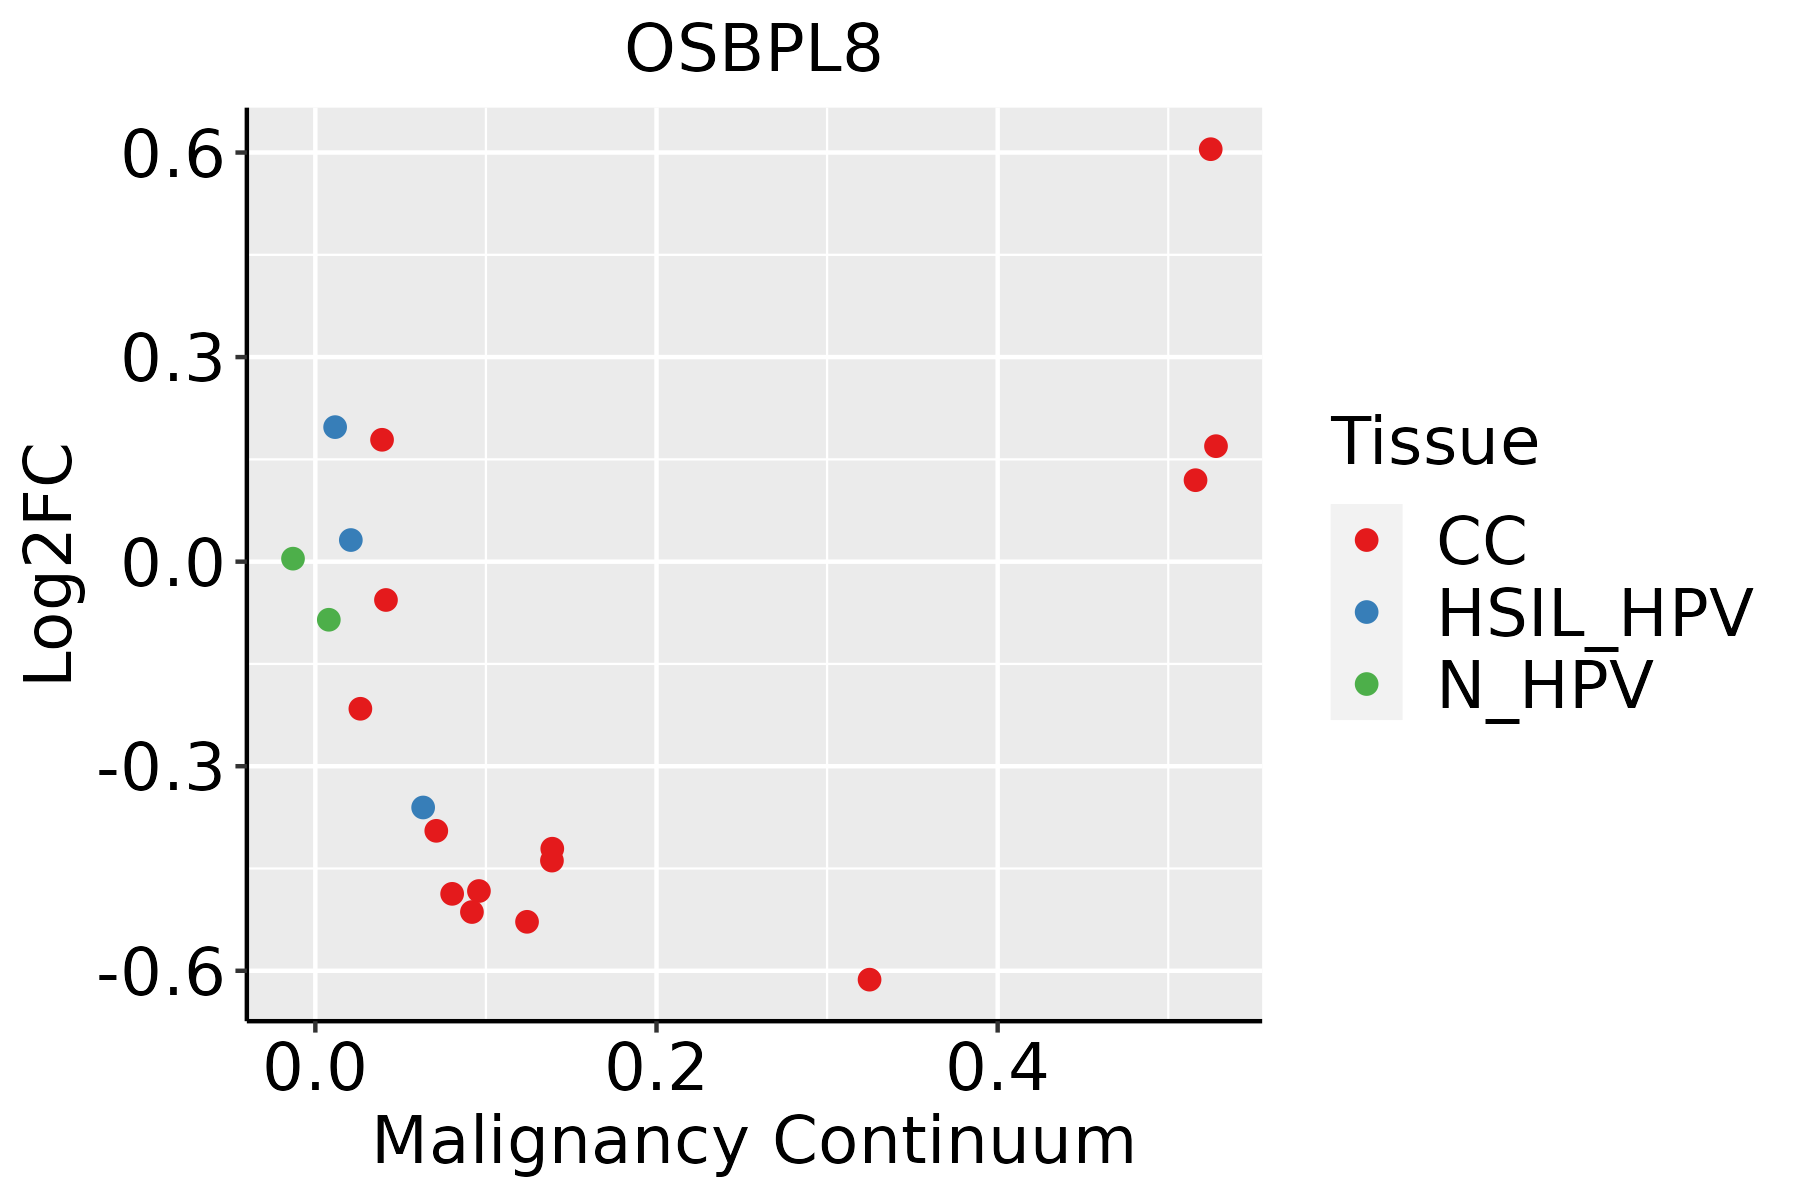 | CC: Cervix cancer |
| HSIL_HPV: HPV-infected high-grade squamous intraepithelial lesions |
| N_HPV: HPV-infected normal cervix |
| Esophagus | 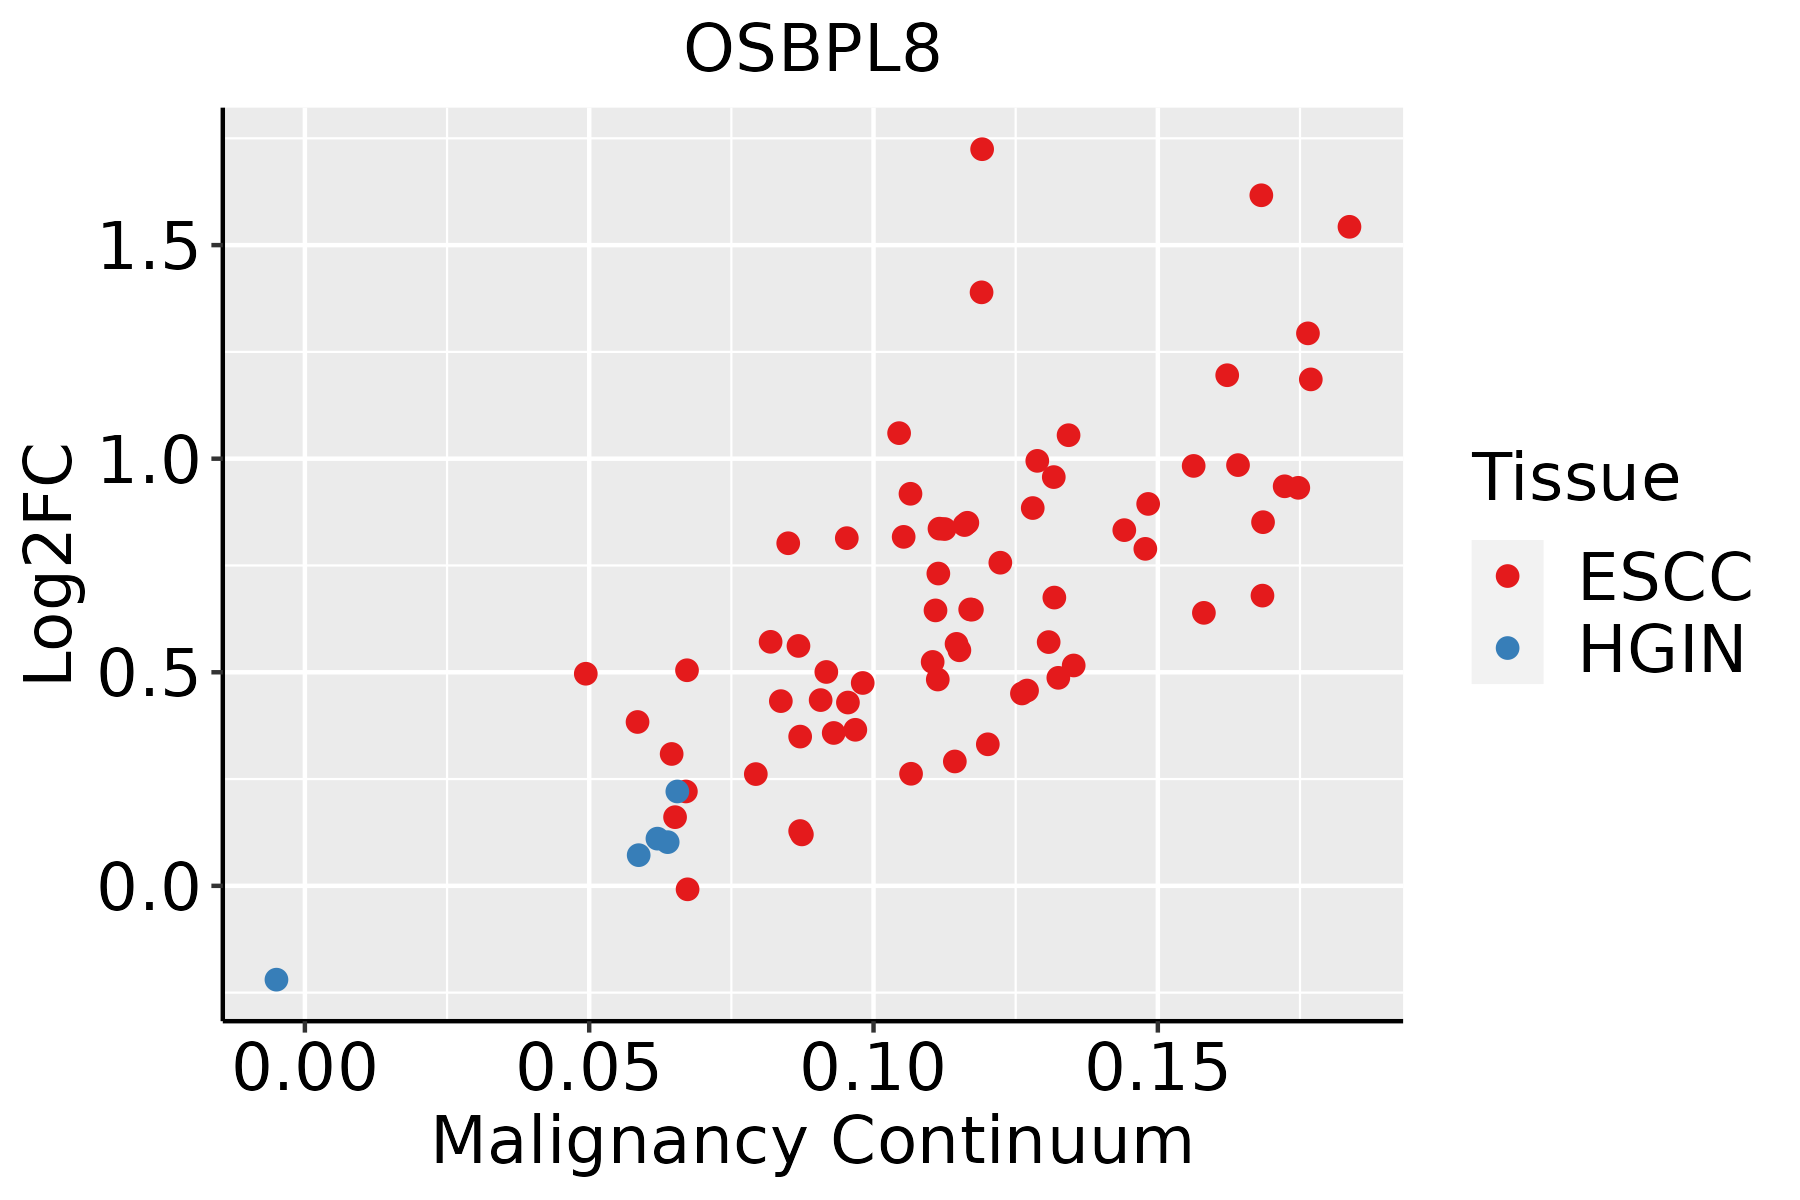 | ESCC: Esophageal squamous cell carcinoma |
| HGIN: High-grade intraepithelial neoplasias |
| LGIN: Low-grade intraepithelial neoplasias |
| Liver | 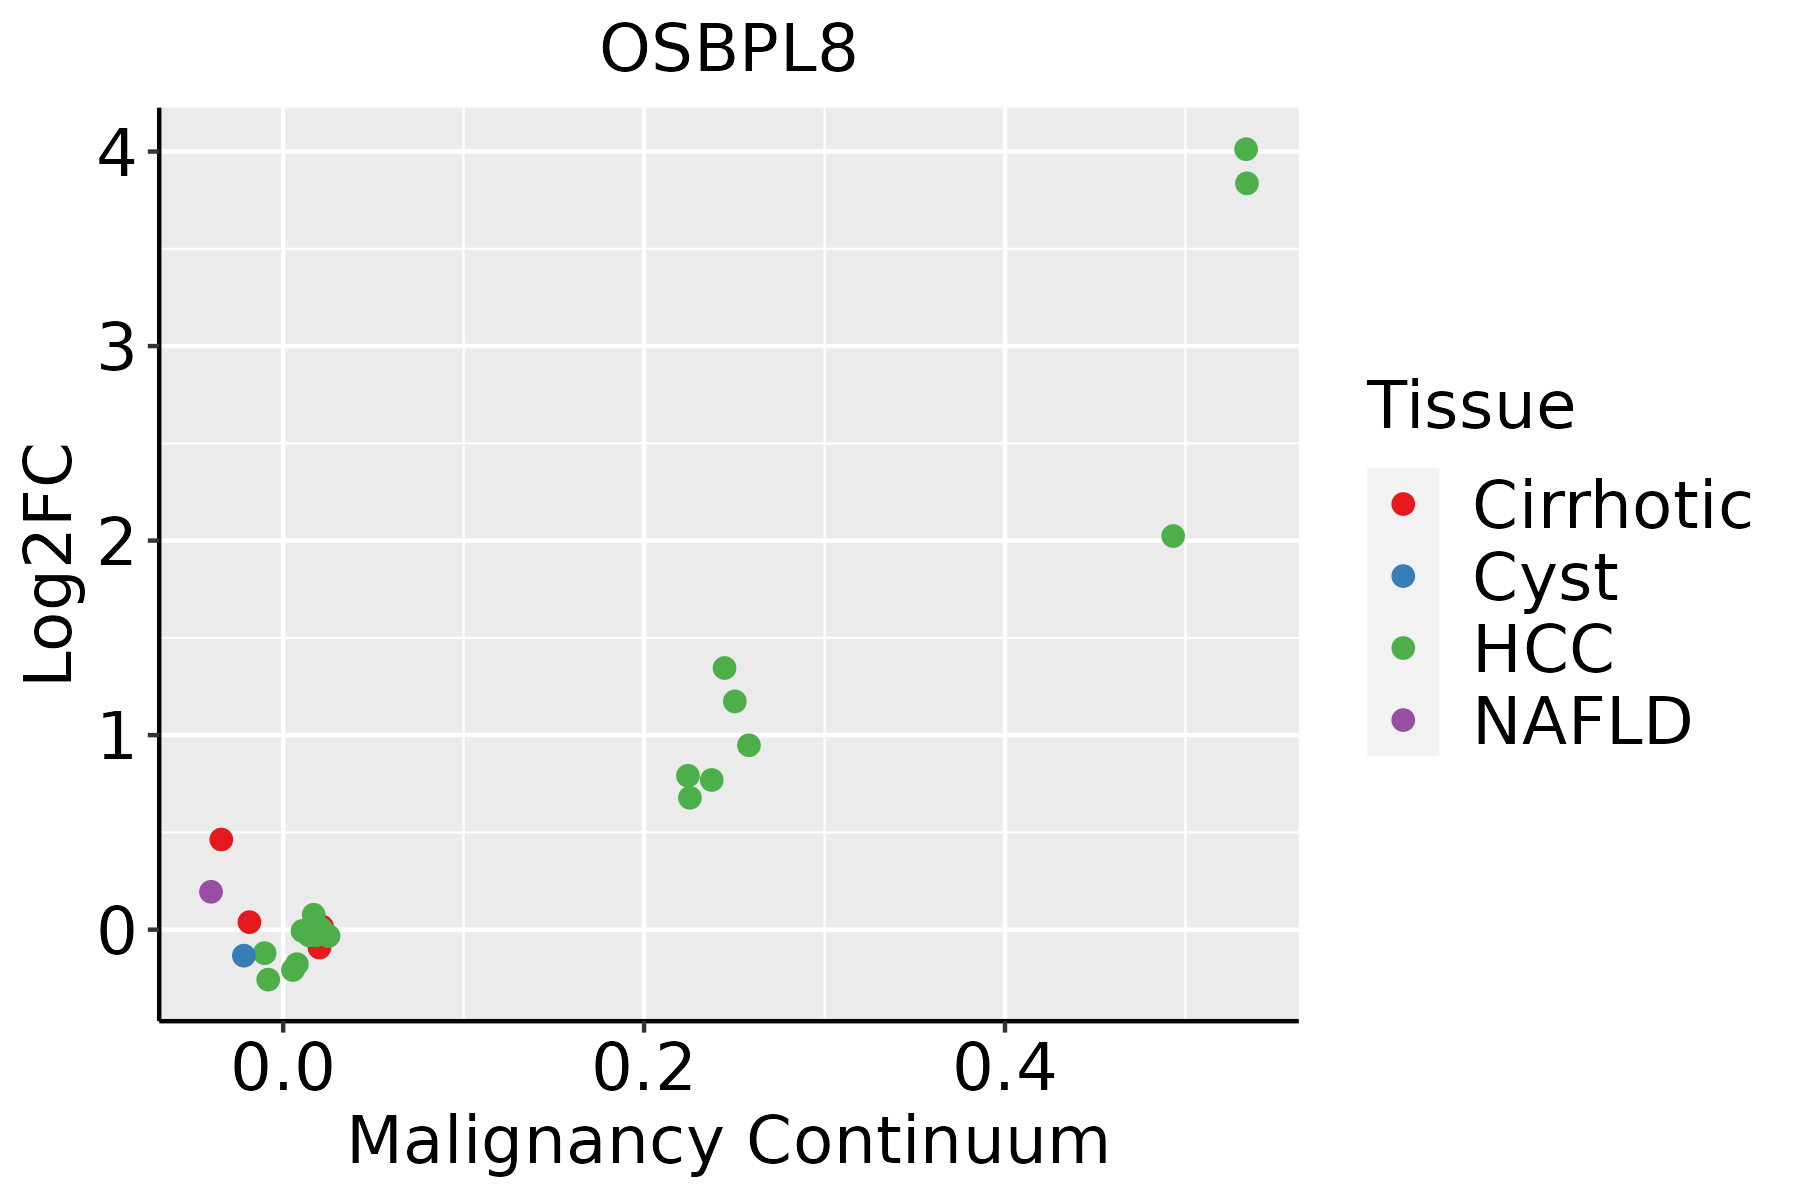 | HCC: Hepatocellular carcinoma |
| NAFLD: Non-alcoholic fatty liver disease |
| Lung |  | AAH: Atypical adenomatous hyperplasia |
| AIS: Adenocarcinoma in situ |
| IAC: Invasive lung adenocarcinoma |
| MIA: Minimally invasive adenocarcinoma |
| Oral Cavity | 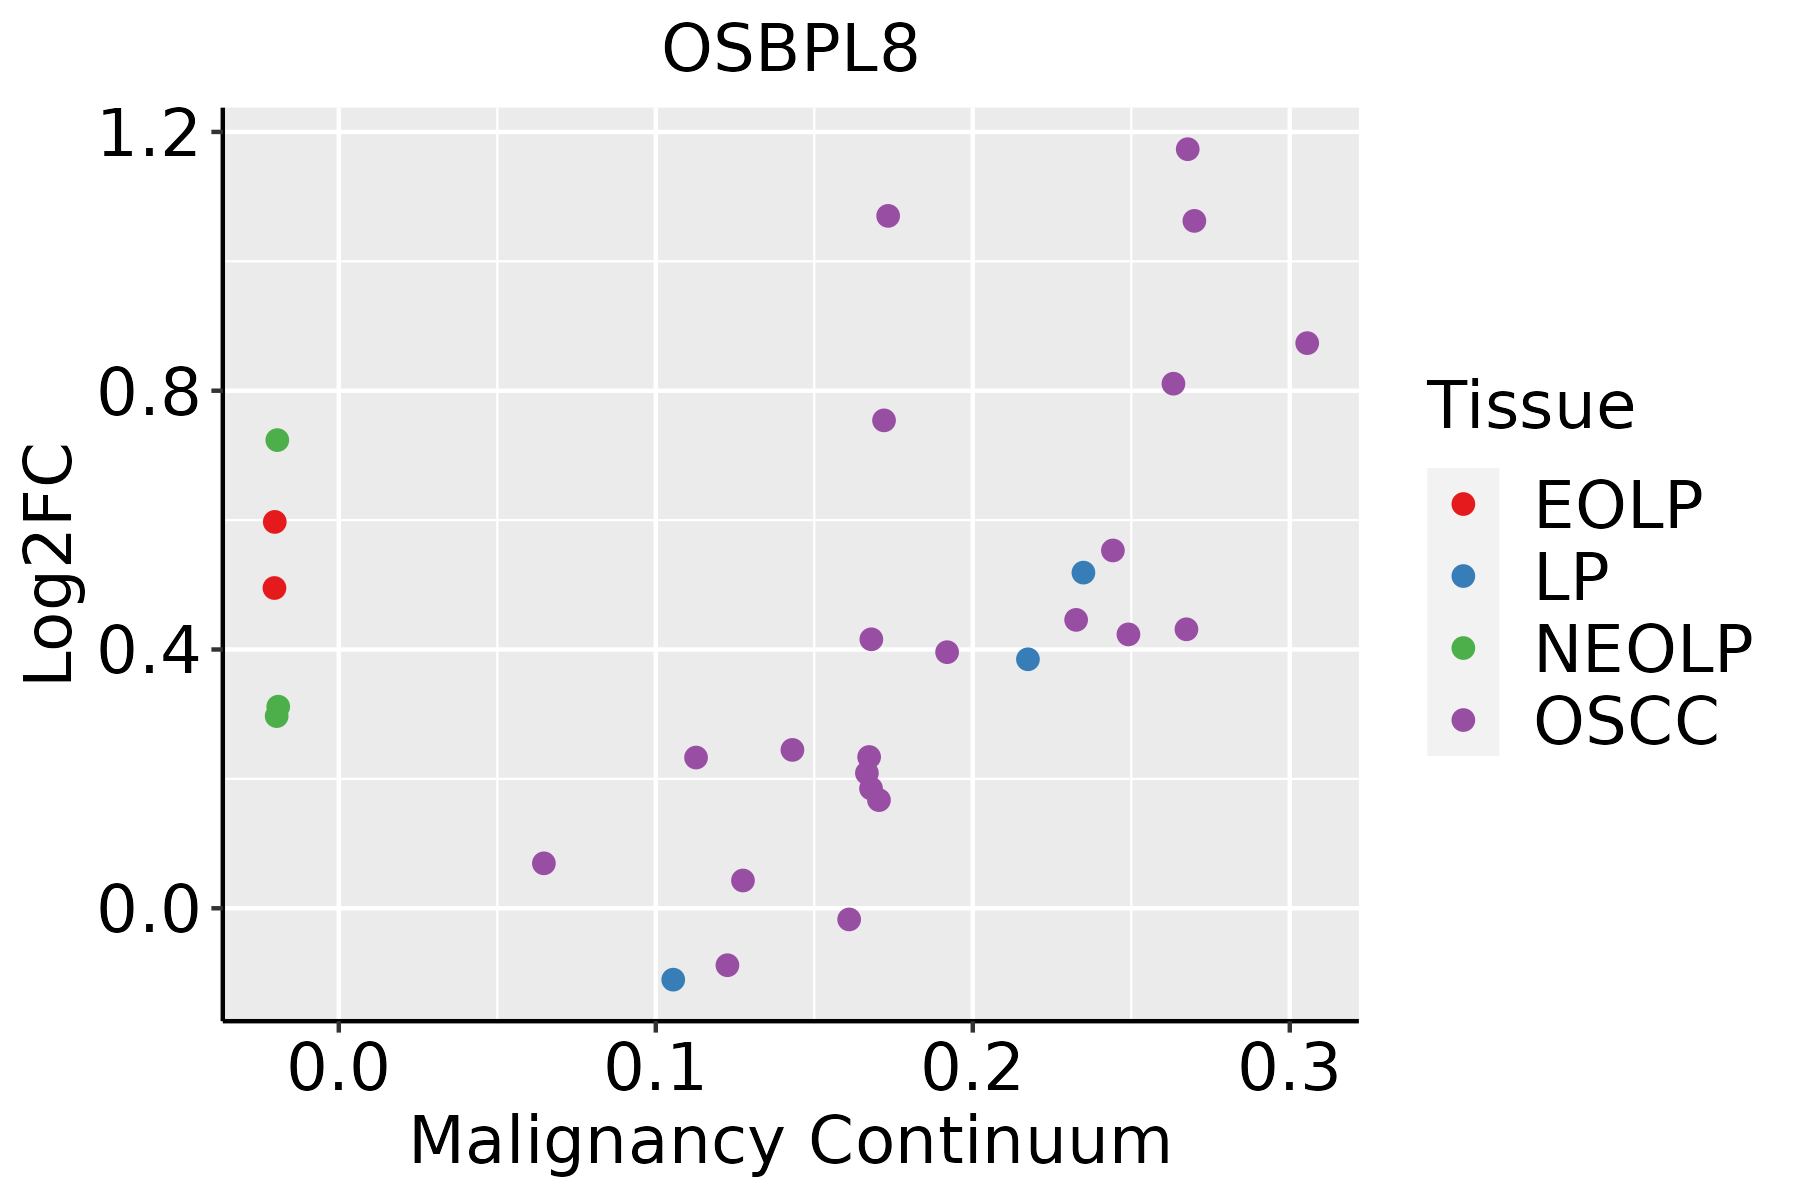 | EOLP: Erosive Oral lichen planus |
| LP: leukoplakia |
| NEOLP: Non-erosive oral lichen planus |
| OSCC: Oral squamous cell carcinoma |
| Prostate |  | BPH: Benign Prostatic Hyperplasia |
| Skin |  | AK: Actinic keratosis |
| cSCC: Cutaneous squamous cell carcinoma |
| SCCIS:squamous cell carcinoma in situ |
| Thyroid |  | ATC: Anaplastic thyroid cancer |
| HT: Hashimoto's thyroiditis |
| PTC: Papillary thyroid cancer |
| GO ID | Tissue | Disease Stage | Description | Gene Ratio | Bg Ratio | pvalue | p.adjust | Count |
| GO:00512359 | Cervix | CC | maintenance of location | 78/2311 | 327/18723 | 5.18e-09 | 4.92e-07 | 78 |
| GO:003367410 | Cervix | CC | positive regulation of kinase activity | 101/2311 | 467/18723 | 8.66e-09 | 7.22e-07 | 101 |
| GO:00458608 | Cervix | CC | positive regulation of protein kinase activity | 85/2311 | 386/18723 | 5.61e-08 | 3.29e-06 | 85 |
| GO:00345048 | Cervix | CC | protein localization to nucleus | 68/2311 | 290/18723 | 9.91e-08 | 5.25e-06 | 68 |
| GO:00454445 | Cervix | CC | fat cell differentiation | 53/2311 | 229/18723 | 3.72e-06 | 9.75e-05 | 53 |
| GO:19016538 | Cervix | CC | cellular response to peptide | 72/2311 | 359/18723 | 1.89e-05 | 3.48e-04 | 72 |
| GO:00512713 | Cervix | CC | negative regulation of cellular component movement | 73/2311 | 367/18723 | 2.22e-05 | 3.95e-04 | 73 |
| GO:00400133 | Cervix | CC | negative regulation of locomotion | 76/2311 | 391/18723 | 3.47e-05 | 5.60e-04 | 76 |
| GO:20001463 | Cervix | CC | negative regulation of cell motility | 71/2311 | 359/18723 | 3.47e-05 | 5.60e-04 | 71 |
| GO:00303363 | Cervix | CC | negative regulation of cell migration | 68/2311 | 344/18723 | 5.11e-05 | 7.70e-04 | 68 |
| GO:00434349 | Cervix | CC | response to peptide hormone | 77/2311 | 414/18723 | 1.40e-04 | 1.70e-03 | 77 |
| GO:00713757 | Cervix | CC | cellular response to peptide hormone stimulus | 57/2311 | 290/18723 | 2.32e-04 | 2.59e-03 | 57 |
| GO:00328698 | Cervix | CC | cellular response to insulin stimulus | 42/2311 | 203/18723 | 4.95e-04 | 4.83e-03 | 42 |
| GO:00518964 | Cervix | CC | regulation of protein kinase B signaling | 39/2311 | 185/18723 | 5.25e-04 | 5.10e-03 | 39 |
| GO:00518973 | Cervix | CC | positive regulation of protein kinase B signaling | 28/2311 | 120/18723 | 5.90e-04 | 5.59e-03 | 28 |
| GO:00434913 | Cervix | CC | protein kinase B signaling | 43/2311 | 211/18723 | 5.95e-04 | 5.60e-03 | 43 |
| GO:00328688 | Cervix | CC | response to insulin | 50/2311 | 264/18723 | 1.28e-03 | 1.02e-02 | 50 |
| GO:00108834 | Cervix | CC | regulation of lipid storage | 15/2311 | 57/18723 | 3.13e-03 | 2.05e-02 | 15 |
| GO:00082865 | Cervix | CC | insulin receptor signaling pathway | 25/2311 | 116/18723 | 3.59e-03 | 2.30e-02 | 25 |
| GO:00347645 | Cervix | CC | positive regulation of transmembrane transport | 40/2311 | 219/18723 | 6.97e-03 | 3.76e-02 | 40 |
| Hugo Symbol | Variant Class | Variant Classification | dbSNP RS | HGVSc | HGVSp | HGVSp Short | SWISSPROT | BIOTYPE | SIFT | PolyPhen | Tumor Sample Barcode | Tissue | Histology | Sex | Age | Stage | Therapy Types | Drugs | Outcome |
| OSBPL8 | SNV | Missense_Mutation | | c.1103C>A | p.Pro368His | p.P368H | Q9BZF1 | protein_coding | tolerated(0.09) | benign(0.416) | TCGA-A7-A0DB-01 | Breast | breast invasive carcinoma | Female | <65 | I/II | Hormone Therapy | arimidex | SD |
| OSBPL8 | SNV | Missense_Mutation | rs201177828 | c.1601N>T | p.Gly534Val | p.G534V | Q9BZF1 | protein_coding | deleterious(0) | probably_damaging(0.939) | TCGA-A8-A07P-01 | Breast | breast invasive carcinoma | Female | >=65 | I/II | Chemotherapy | 5-fluorouracil | SD |
| OSBPL8 | SNV | Missense_Mutation | rs201177828 | c.1601G>T | p.Gly534Val | p.G534V | Q9BZF1 | protein_coding | deleterious(0) | probably_damaging(0.939) | TCGA-A8-A081-01 | Breast | breast invasive carcinoma | Female | >=65 | I/II | Unknown | Unknown | SD |
| OSBPL8 | SNV | Missense_Mutation | rs201177828 | c.1601N>T | p.Gly534Val | p.G534V | Q9BZF1 | protein_coding | deleterious(0) | probably_damaging(0.939) | TCGA-A8-A094-01 | Breast | breast invasive carcinoma | Female | >=65 | I/II | Unknown | Unknown | SD |
| OSBPL8 | SNV | Missense_Mutation | | c.1654N>C | p.Glu552Gln | p.E552Q | Q9BZF1 | protein_coding | deleterious(0.01) | benign(0.061) | TCGA-AC-A23H-01 | Breast | breast invasive carcinoma | Female | >=65 | I/II | Unknown | Unknown | PD |
| OSBPL8 | SNV | Missense_Mutation | novel | c.386N>A | p.Arg129Gln | p.R129Q | Q9BZF1 | protein_coding | deleterious(0.02) | probably_damaging(0.957) | TCGA-AR-A5QQ-01 | Breast | breast invasive carcinoma | Female | >=65 | III/IV | Chemotherapy | carboplatin | PD |
| OSBPL8 | SNV | Missense_Mutation | rs201177828 | c.1601G>T | p.Gly534Val | p.G534V | Q9BZF1 | protein_coding | deleterious(0) | probably_damaging(0.939) | TCGA-BH-A0BD-01 | Breast | breast invasive carcinoma | Female | <65 | I/II | Chemotherapy | doxorubicin | SD |
| OSBPL8 | SNV | Missense_Mutation | | c.442G>A | p.Val148Ile | p.V148I | Q9BZF1 | protein_coding | tolerated(0.09) | possibly_damaging(0.562) | TCGA-BH-A0BM-01 | Breast | breast invasive carcinoma | Female | <65 | I/II | Chemotherapy | adriamycin | SD |
| OSBPL8 | SNV | Missense_Mutation | novel | c.2608N>C | p.Asp870His | p.D870H | Q9BZF1 | protein_coding | tolerated(0.58) | benign(0.001) | TCGA-BH-A2L8-01 | Breast | breast invasive carcinoma | Female | <65 | I/II | Chemotherapy | cytoxan | CR |
| OSBPL8 | SNV | Missense_Mutation | | c.602N>A | p.Arg201His | p.R201H | Q9BZF1 | protein_coding | deleterious(0) | probably_damaging(0.997) | TCGA-D8-A1XF-01 | Breast | breast invasive carcinoma | Female | <65 | I/II | Chemotherapy | adriamycin+cyclophosphamide | SD |


