
|
|||||
|
 | |
| |
| |
| |
| |
| |
|
Gene: OSBPL3 |
Gene summary for OSBPL3 |
| Gene information | Species | Human | Gene symbol | OSBPL3 | Gene ID | 26031 |
| Gene name | oxysterol binding protein like 3 | |
| Gene Alias | ORP-3 | |
| Cytomap | 7p15.3 | |
| Gene Type | protein-coding | GO ID | GO:0006082 | UniProtAcc | Q9H4L5 |
Top |
Malignant transformation analysis |
| Identification of the aberrant gene expression in precancerous and cancerous lesions by comparing the gene expression of stem-like cells in diseased tissues with normal stem cells |
| Entrez ID | Symbol | Replicates | Species | Organ | Tissue | Adj P-value | Log2FC | Malignancy |
| 26031 | OSBPL3 | CCI_1 | Human | Cervix | CC | 2.20e-05 | 1.05e+00 | 0.528 |
| 26031 | OSBPL3 | CCI_2 | Human | Cervix | CC | 4.39e-09 | 1.13e+00 | 0.5249 |
| 26031 | OSBPL3 | CCI_3 | Human | Cervix | CC | 4.68e-13 | 8.41e-01 | 0.516 |
| 26031 | OSBPL3 | H2 | Human | Cervix | HSIL_HPV | 4.84e-04 | 3.11e-01 | 0.0632 |
| 26031 | OSBPL3 | AEH-subject1 | Human | Endometrium | AEH | 1.50e-25 | 5.71e-01 | -0.3059 |
| 26031 | OSBPL3 | AEH-subject2 | Human | Endometrium | AEH | 1.01e-13 | 4.72e-01 | -0.2525 |
| 26031 | OSBPL3 | AEH-subject3 | Human | Endometrium | AEH | 4.19e-07 | 3.07e-01 | -0.2576 |
| 26031 | OSBPL3 | AEH-subject4 | Human | Endometrium | AEH | 3.42e-19 | 6.75e-01 | -0.2657 |
| 26031 | OSBPL3 | AEH-subject5 | Human | Endometrium | AEH | 5.10e-21 | 5.03e-01 | -0.2953 |
| 26031 | OSBPL3 | EEC-subject2 | Human | Endometrium | EEC | 5.20e-06 | 3.19e-01 | -0.2607 |
| 26031 | OSBPL3 | EEC-subject5 | Human | Endometrium | EEC | 3.06e-11 | 4.14e-01 | -0.249 |
| 26031 | OSBPL3 | GSM6177620_NYU_UCEC1_lib2_lib2 | Human | Endometrium | EEC | 4.50e-05 | 1.54e-01 | -0.1875 |
| 26031 | OSBPL3 | GSM6177622_NYU_UCEC3_lib2_lib2 | Human | Endometrium | EEC | 5.76e-03 | 1.29e-01 | -0.1916 |
| 26031 | OSBPL3 | GSM6177623_NYU_UCEC3_Vis | Human | Endometrium | EEC | 1.40e-13 | 4.50e-01 | -0.1269 |
| 26031 | OSBPL3 | LZE4T | Human | Esophagus | ESCC | 3.31e-07 | 1.06e-01 | 0.0811 |
| 26031 | OSBPL3 | LZE7T | Human | Esophagus | ESCC | 1.42e-05 | 1.26e-01 | 0.0667 |
| 26031 | OSBPL3 | LZE20T | Human | Esophagus | ESCC | 1.51e-04 | 1.42e-01 | 0.0662 |
| 26031 | OSBPL3 | LZE24T | Human | Esophagus | ESCC | 3.67e-12 | 1.65e-01 | 0.0596 |
| 26031 | OSBPL3 | LZE6T | Human | Esophagus | ESCC | 1.08e-04 | 1.64e-01 | 0.0845 |
| 26031 | OSBPL3 | P1T-E | Human | Esophagus | ESCC | 3.51e-06 | 2.78e-01 | 0.0875 |
| Page: 1 2 3 4 5 |
| Tissue | Expression Dynamics | Abbreviation |
| Cervix | 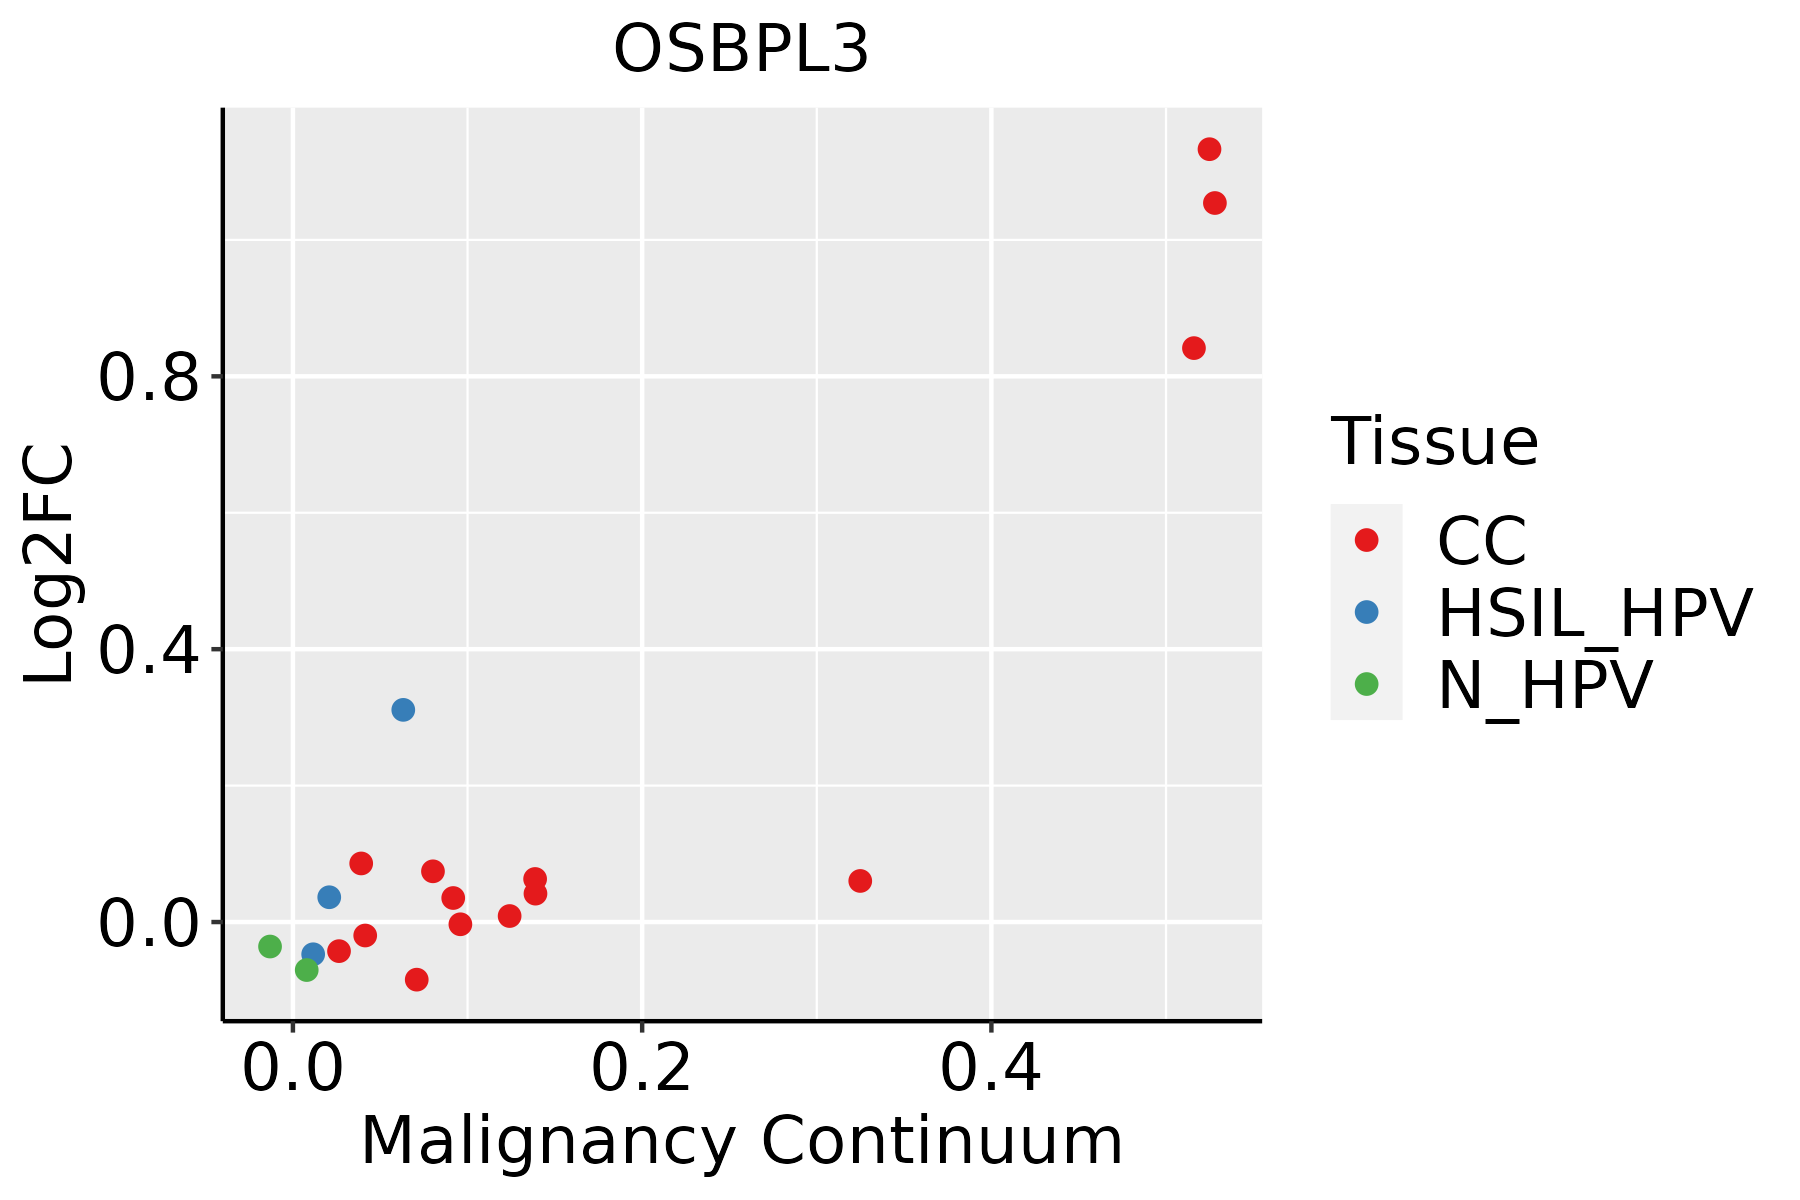 | CC: Cervix cancer |
| HSIL_HPV: HPV-infected high-grade squamous intraepithelial lesions | ||
| N_HPV: HPV-infected normal cervix | ||
| Endometrium | 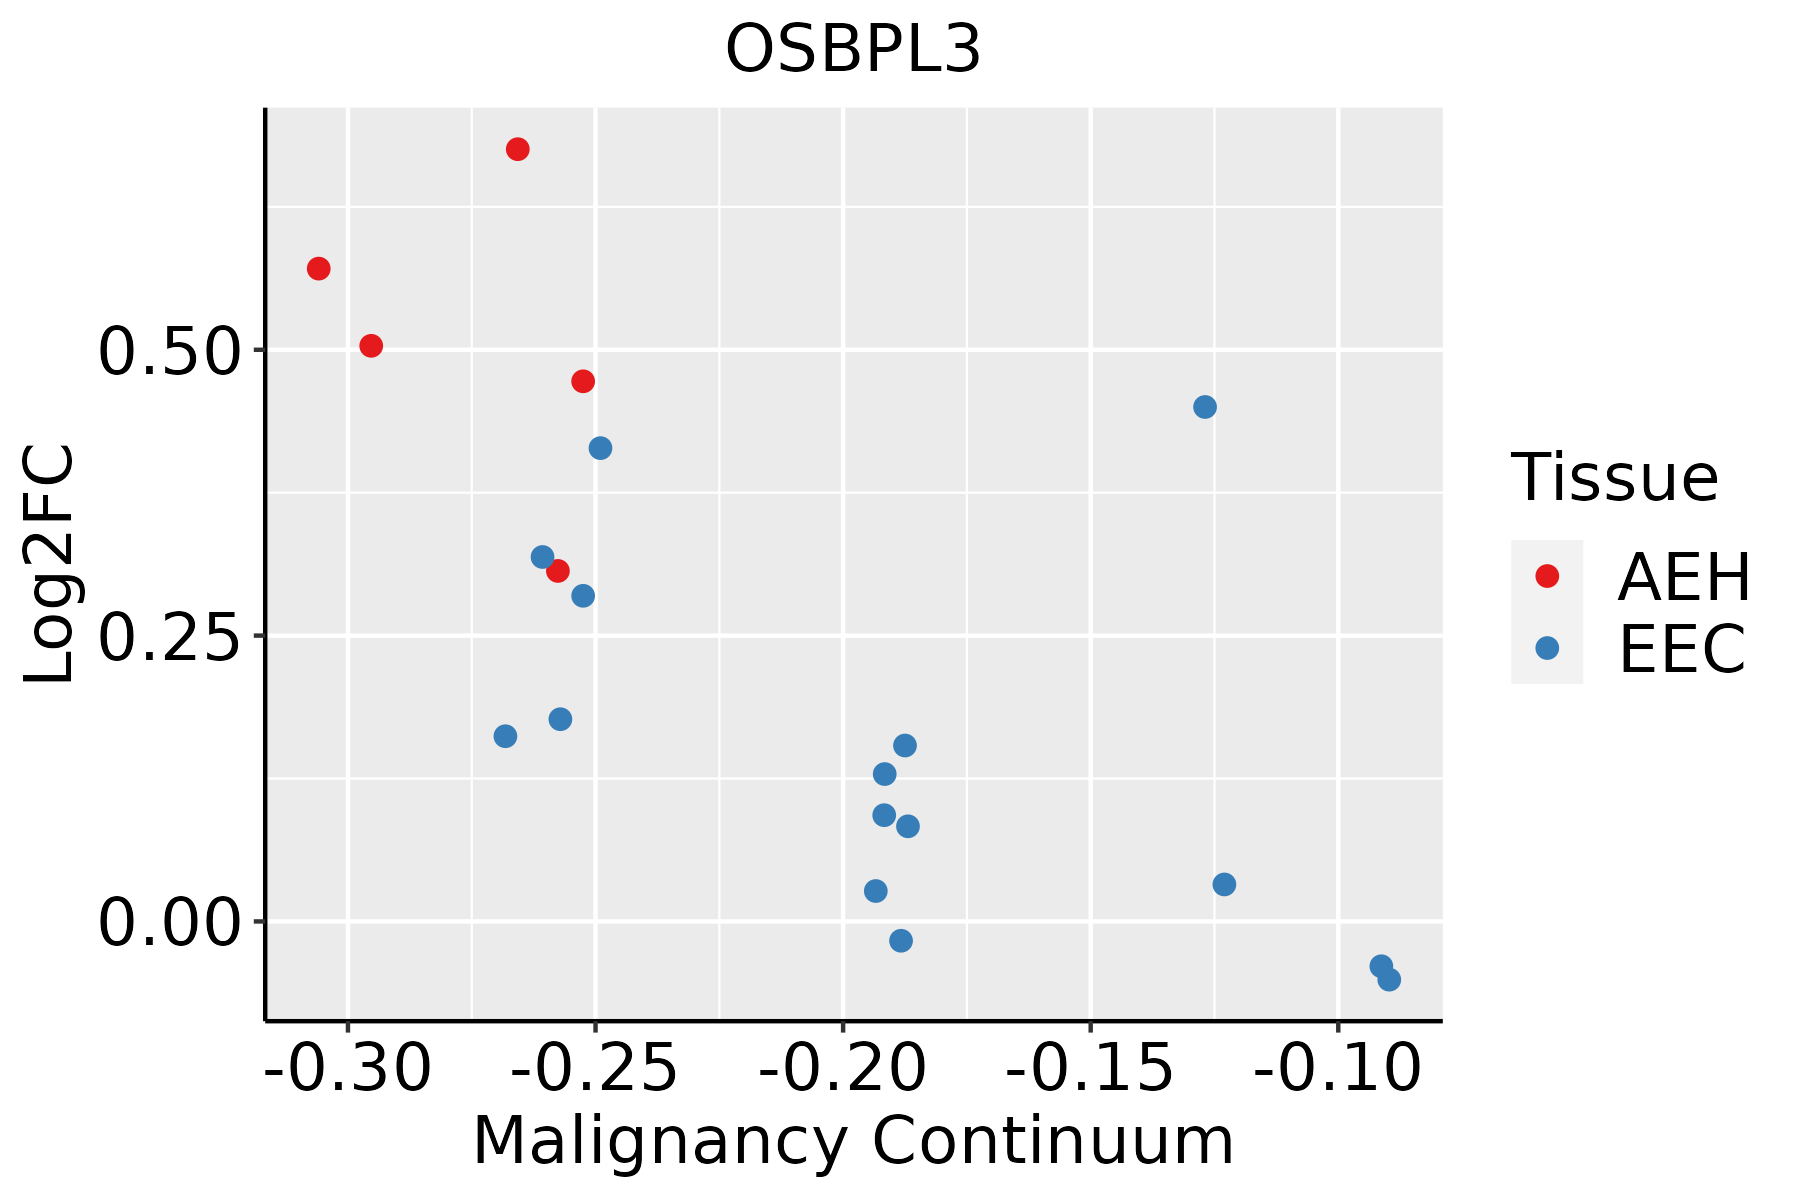 | AEH: Atypical endometrial hyperplasia |
| EEC: Endometrioid Cancer | ||
| Esophagus | 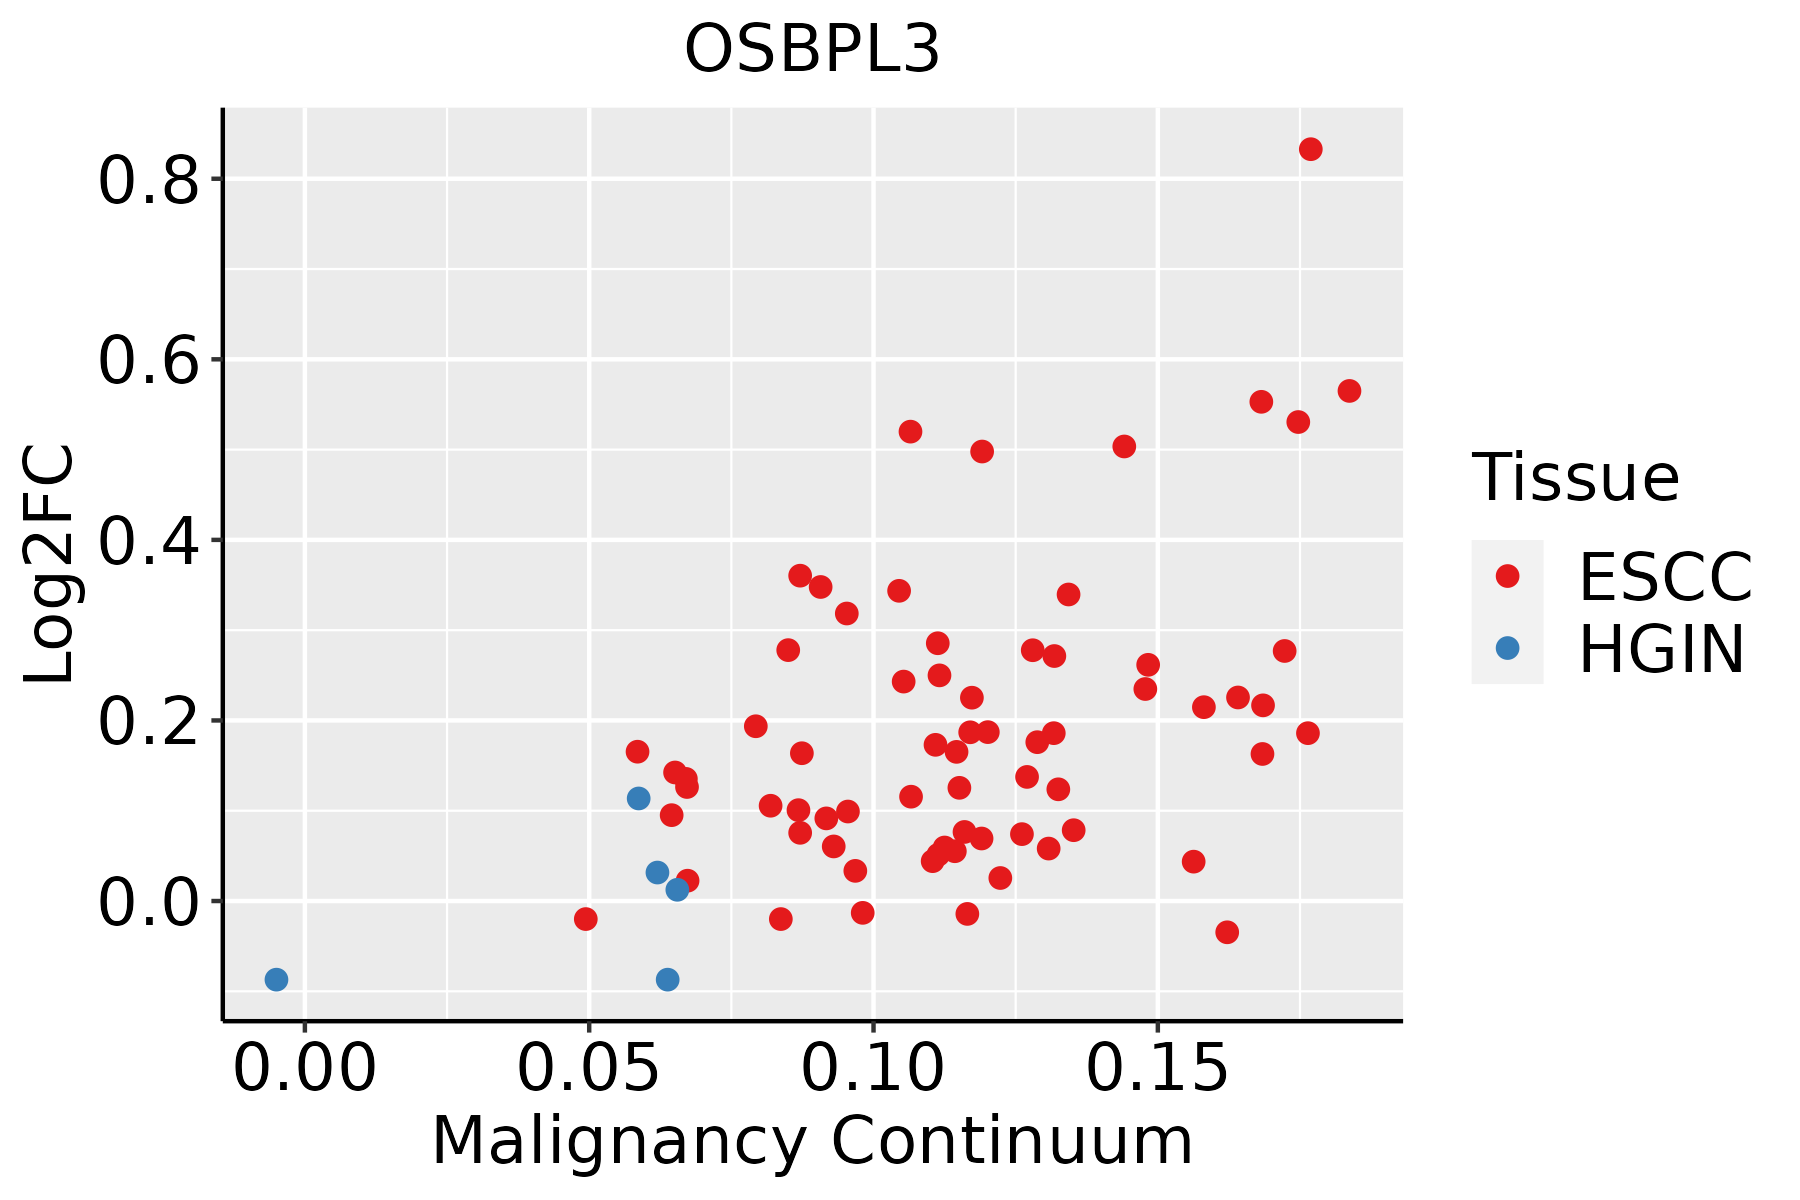 | ESCC: Esophageal squamous cell carcinoma |
| HGIN: High-grade intraepithelial neoplasias | ||
| LGIN: Low-grade intraepithelial neoplasias | ||
| Lung | 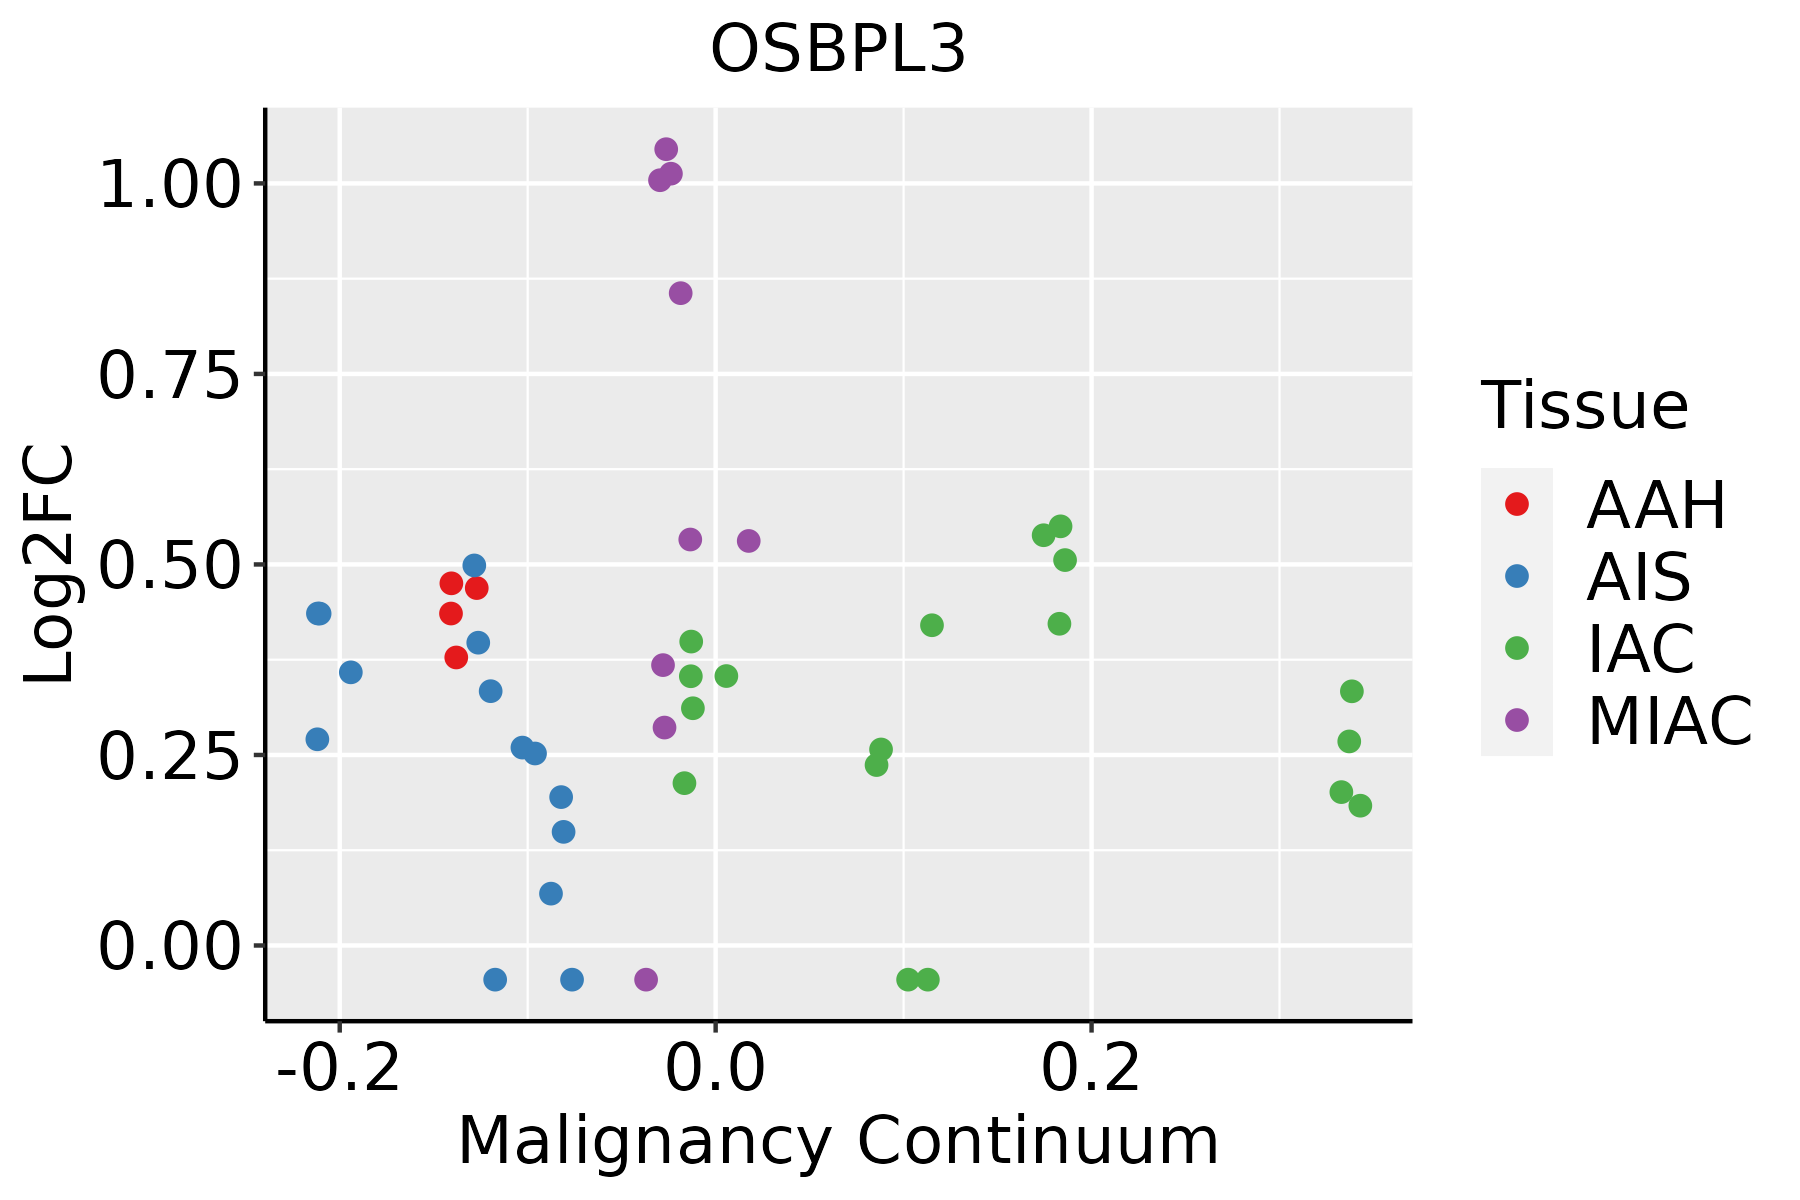 | AAH: Atypical adenomatous hyperplasia |
| AIS: Adenocarcinoma in situ | ||
| IAC: Invasive lung adenocarcinoma | ||
| MIA: Minimally invasive adenocarcinoma | ||
| Thyroid | 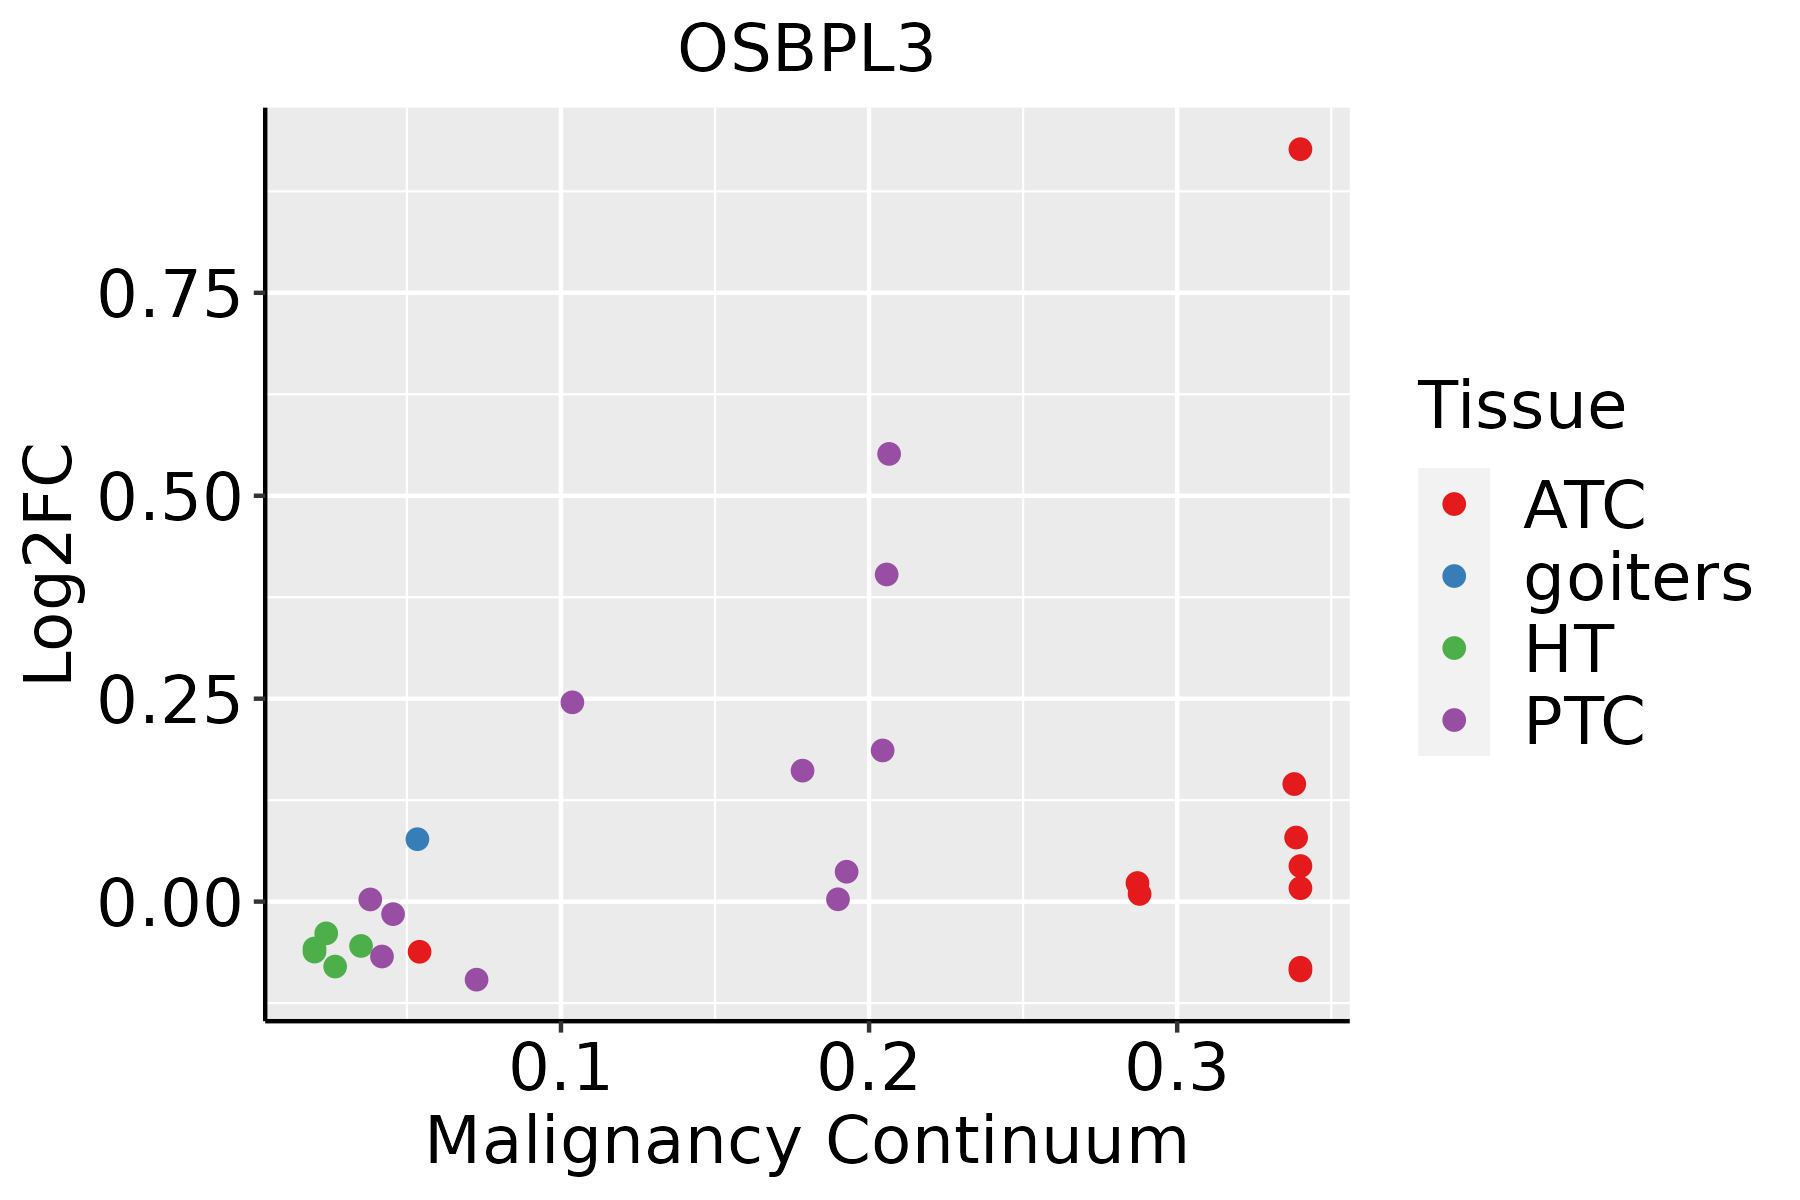 | ATC: Anaplastic thyroid cancer |
| HT: Hashimoto's thyroiditis | ||
| PTC: Papillary thyroid cancer |
| ∗log2FC in expression of this searched gene in stem-like cells from each diseased tissue sample relative to stem-like cells in normal samples in each tissue plotted against the malignancy continuum. Samples are colored based on if they are from different disease stage. |
Top |
Malignant transformation related pathway analysis |
| Find out the enriched GO biological processes and KEGG pathways involved in transition from healthy to precancer to cancer |
| Tissue | Disease Stage | Enriched GO biological Processes |
| Colorectum | AD |  |
| Colorectum | SER |  |
| Colorectum | MSS |  |
| Colorectum | MSI-H |  |
| Colorectum | FAP |  |
| ∗Top 15 enriched GO BP terms are showed in the bar plot of each disease state in each tissue. Each row represents a significant GO biological process which is colored according to the -log10(p.adjust). |
| Page: 1 2 3 4 5 6 7 8 9 |
| GO ID | Tissue | Disease Stage | Description | Gene Ratio | Bg Ratio | pvalue | p.adjust | Count |
| GO:00463948 | Esophagus | ESCC | carboxylic acid biosynthetic process | 175/8552 | 314/18723 | 1.98e-04 | 1.26e-03 | 175 |
| GO:00160538 | Esophagus | ESCC | organic acid biosynthetic process | 175/8552 | 316/18723 | 3.04e-04 | 1.82e-03 | 175 |
| GO:00066946 | Esophagus | ESCC | steroid biosynthetic process | 98/8552 | 173/18723 | 2.34e-03 | 1.03e-02 | 98 |
| GO:19016174 | Esophagus | ESCC | organic hydroxy compound biosynthetic process | 128/8552 | 237/18723 | 5.86e-03 | 2.16e-02 | 128 |
| Page: 1 |
| Pathway ID | Tissue | Disease Stage | Description | Gene Ratio | Bg Ratio | pvalue | p.adjust | qvalue | Count |
| Page: 1 |
Top |
Cell-cell communication analysis |
| Identification of potential cell-cell interactions between two cell types and their ligand-receptor pairs for different disease states |
| Ligand | Receptor | LRpair | Pathway | Tissue | Disease Stage |
| Page: 1 |
Top |
Single-cell gene regulatory network inference analysis |
| Find out the significant the regulons (TFs) and the target genes of each regulon across cell types for different disease states |
| TF | Cell Type | Tissue | Disease Stage | Target Gene | RSS | Regulon Activity |
| ∗The dot plots of a searched regulon are shown for all cell subpopulations in each disease state of each tissue based on the regulon specific score inferred using pySCENIC and by calculating the average expression. |
| Page: 1 |
Top |
Somatic mutation of malignant transformation related genes |
| Annotation of somatic variants for genes involved in malignant transformation |
| Hugo Symbol | Variant Class | Variant Classification | dbSNP RS | HGVSc | HGVSp | HGVSp Short | SWISSPROT | BIOTYPE | SIFT | PolyPhen | Tumor Sample Barcode | Tissue | Histology | Sex | Age | Stage | Therapy Types | Drugs | Outcome |
| OSBPL3 | SNV | Missense_Mutation | novel | c.2493N>C | p.Arg831Ser | p.R831S | Q9H4L5 | protein_coding | deleterious(0) | possibly_damaging(0.882) | TCGA-AC-A3W6-01 | Breast | breast invasive carcinoma | Female | >=65 | III/IV | Unknown | Unknown | SD |
| OSBPL3 | SNV | Missense_Mutation | c.632N>C | p.Leu211Ser | p.L211S | Q9H4L5 | protein_coding | tolerated(0.45) | benign(0) | TCGA-AN-A0AK-01 | Breast | breast invasive carcinoma | Female | >=65 | I/II | Unknown | Unknown | SD | |
| OSBPL3 | SNV | Missense_Mutation | novel | c.2525N>G | p.Val842Gly | p.V842G | Q9H4L5 | protein_coding | tolerated(0.13) | possibly_damaging(0.47) | TCGA-AO-A1KP-01 | Breast | breast invasive carcinoma | Female | >=65 | I/II | Chemotherapy | fluorouracil | SD |
| OSBPL3 | SNV | Missense_Mutation | c.819C>A | p.His273Gln | p.H273Q | Q9H4L5 | protein_coding | tolerated(0.68) | benign(0.001) | TCGA-AR-A0U2-01 | Breast | breast invasive carcinoma | Female | <65 | III/IV | Hormone Therapy | tamoxiphen | PD | |
| OSBPL3 | SNV | Missense_Mutation | c.2550N>G | p.His850Gln | p.H850Q | Q9H4L5 | protein_coding | deleterious(0.02) | possibly_damaging(0.882) | TCGA-AR-A24Q-01 | Breast | breast invasive carcinoma | Female | <65 | I/II | Chemotherapy | doxorubicin | SD | |
| OSBPL3 | SNV | Missense_Mutation | novel | c.556N>T | p.Ser186Cys | p.S186C | Q9H4L5 | protein_coding | deleterious(0.05) | benign(0.013) | TCGA-S3-AA10-01 | Breast | breast invasive carcinoma | Female | >=65 | I/II | Chemotherapy | cytoxan | CR |
| OSBPL3 | insertion | Nonsense_Mutation | novel | c.1757_1758insTCAAAGGAAAGTGAATATACAGTAACCCAAAGCACACTGTCAGTA | p.Ala586_Ala587insGlnArgLysValAsnIleGlnTerProLysAlaHisCysGlnTer | p.A586_A587insQRKVNIQ*PKAHCQ* | Q9H4L5 | protein_coding | TCGA-A7-A0CJ-01 | Breast | breast invasive carcinoma | Female | <65 | I/II | Chemotherapy | cytoxan | SD | ||
| OSBPL3 | SNV | Missense_Mutation | rs377411746 | c.1664C>T | p.Thr555Met | p.T555M | Q9H4L5 | protein_coding | deleterious(0.05) | possibly_damaging(0.527) | TCGA-2W-A8YY-01 | Cervix | cervical & endocervical cancer | Female | <65 | I/II | Chemotherapy | cisplatin | CR |
| OSBPL3 | SNV | Missense_Mutation | rs746997753 | c.1234G>A | p.Ala412Thr | p.A412T | Q9H4L5 | protein_coding | tolerated(0.19) | benign(0.003) | TCGA-2W-A8YY-01 | Cervix | cervical & endocervical cancer | Female | <65 | I/II | Chemotherapy | cisplatin | CR |
| OSBPL3 | SNV | Missense_Mutation | c.332C>T | p.Ser111Leu | p.S111L | Q9H4L5 | protein_coding | deleterious(0) | possibly_damaging(0.842) | TCGA-Q1-A73O-01 | Cervix | cervical & endocervical cancer | Female | <65 | I/II | Chemotherapy | cisplatin | CR |
| Page: 1 2 3 4 5 6 7 8 9 10 |
Top |
Related drugs of malignant transformation related genes |
| Identification of chemicals and drugs interact with genes involved in malignant transfromation |
| (DGIdb 4.0) |
| Entrez ID | Symbol | Category | Interaction Types | Drug Claim Name | Drug Name | PMIDs |
| Page: 1 |

Copyright 2023-Present -The University of Texas Health Science Center at Houston |