
|
|||||
|
 | |
| |
| |
| |
| |
| |
|
Gene: OSBPL2 |
Gene summary for OSBPL2 |
| Gene information | Species | Human | Gene symbol | OSBPL2 | Gene ID | 9885 |
| Gene name | oxysterol binding protein like 2 | |
| Gene Alias | DFNA67 | |
| Cytomap | 20q13.33 | |
| Gene Type | protein-coding | GO ID | GO:0006082 | UniProtAcc | B4DKJ8 |
Top |
Malignant transformation analysis |
| Identification of the aberrant gene expression in precancerous and cancerous lesions by comparing the gene expression of stem-like cells in diseased tissues with normal stem cells |
| Entrez ID | Symbol | Replicates | Species | Organ | Tissue | Adj P-value | Log2FC | Malignancy |
| 9885 | OSBPL2 | LZE4T | Human | Esophagus | ESCC | 1.89e-11 | 3.27e-01 | 0.0811 |
| 9885 | OSBPL2 | LZE5T | Human | Esophagus | ESCC | 1.26e-02 | 2.14e-01 | 0.0514 |
| 9885 | OSBPL2 | LZE7T | Human | Esophagus | ESCC | 1.04e-05 | 2.13e-01 | 0.0667 |
| 9885 | OSBPL2 | LZE8T | Human | Esophagus | ESCC | 1.54e-03 | 1.12e-01 | 0.067 |
| 9885 | OSBPL2 | LZE20T | Human | Esophagus | ESCC | 3.03e-08 | 2.78e-01 | 0.0662 |
| 9885 | OSBPL2 | LZE24T | Human | Esophagus | ESCC | 6.65e-09 | 3.80e-01 | 0.0596 |
| 9885 | OSBPL2 | P1T-E | Human | Esophagus | ESCC | 3.34e-12 | 4.92e-01 | 0.0875 |
| 9885 | OSBPL2 | P2T-E | Human | Esophagus | ESCC | 2.60e-24 | 2.59e-01 | 0.1177 |
| 9885 | OSBPL2 | P4T-E | Human | Esophagus | ESCC | 3.12e-09 | 1.45e-01 | 0.1323 |
| 9885 | OSBPL2 | P5T-E | Human | Esophagus | ESCC | 4.01e-30 | 1.55e-01 | 0.1327 |
| 9885 | OSBPL2 | P8T-E | Human | Esophagus | ESCC | 3.22e-19 | 1.78e-01 | 0.0889 |
| 9885 | OSBPL2 | P9T-E | Human | Esophagus | ESCC | 1.41e-13 | 1.44e-01 | 0.1131 |
| 9885 | OSBPL2 | P10T-E | Human | Esophagus | ESCC | 4.62e-22 | 3.81e-01 | 0.116 |
| 9885 | OSBPL2 | P11T-E | Human | Esophagus | ESCC | 2.57e-09 | 5.52e-01 | 0.1426 |
| 9885 | OSBPL2 | P12T-E | Human | Esophagus | ESCC | 7.56e-22 | 4.84e-01 | 0.1122 |
| 9885 | OSBPL2 | P15T-E | Human | Esophagus | ESCC | 1.08e-20 | 3.22e-01 | 0.1149 |
| 9885 | OSBPL2 | P16T-E | Human | Esophagus | ESCC | 1.20e-12 | 3.39e-01 | 0.1153 |
| 9885 | OSBPL2 | P17T-E | Human | Esophagus | ESCC | 1.53e-05 | 1.17e-01 | 0.1278 |
| 9885 | OSBPL2 | P20T-E | Human | Esophagus | ESCC | 2.89e-27 | 6.96e-01 | 0.1124 |
| 9885 | OSBPL2 | P21T-E | Human | Esophagus | ESCC | 2.94e-22 | 3.97e-01 | 0.1617 |
| Page: 1 2 3 4 5 6 |
| Tissue | Expression Dynamics | Abbreviation |
| Esophagus | 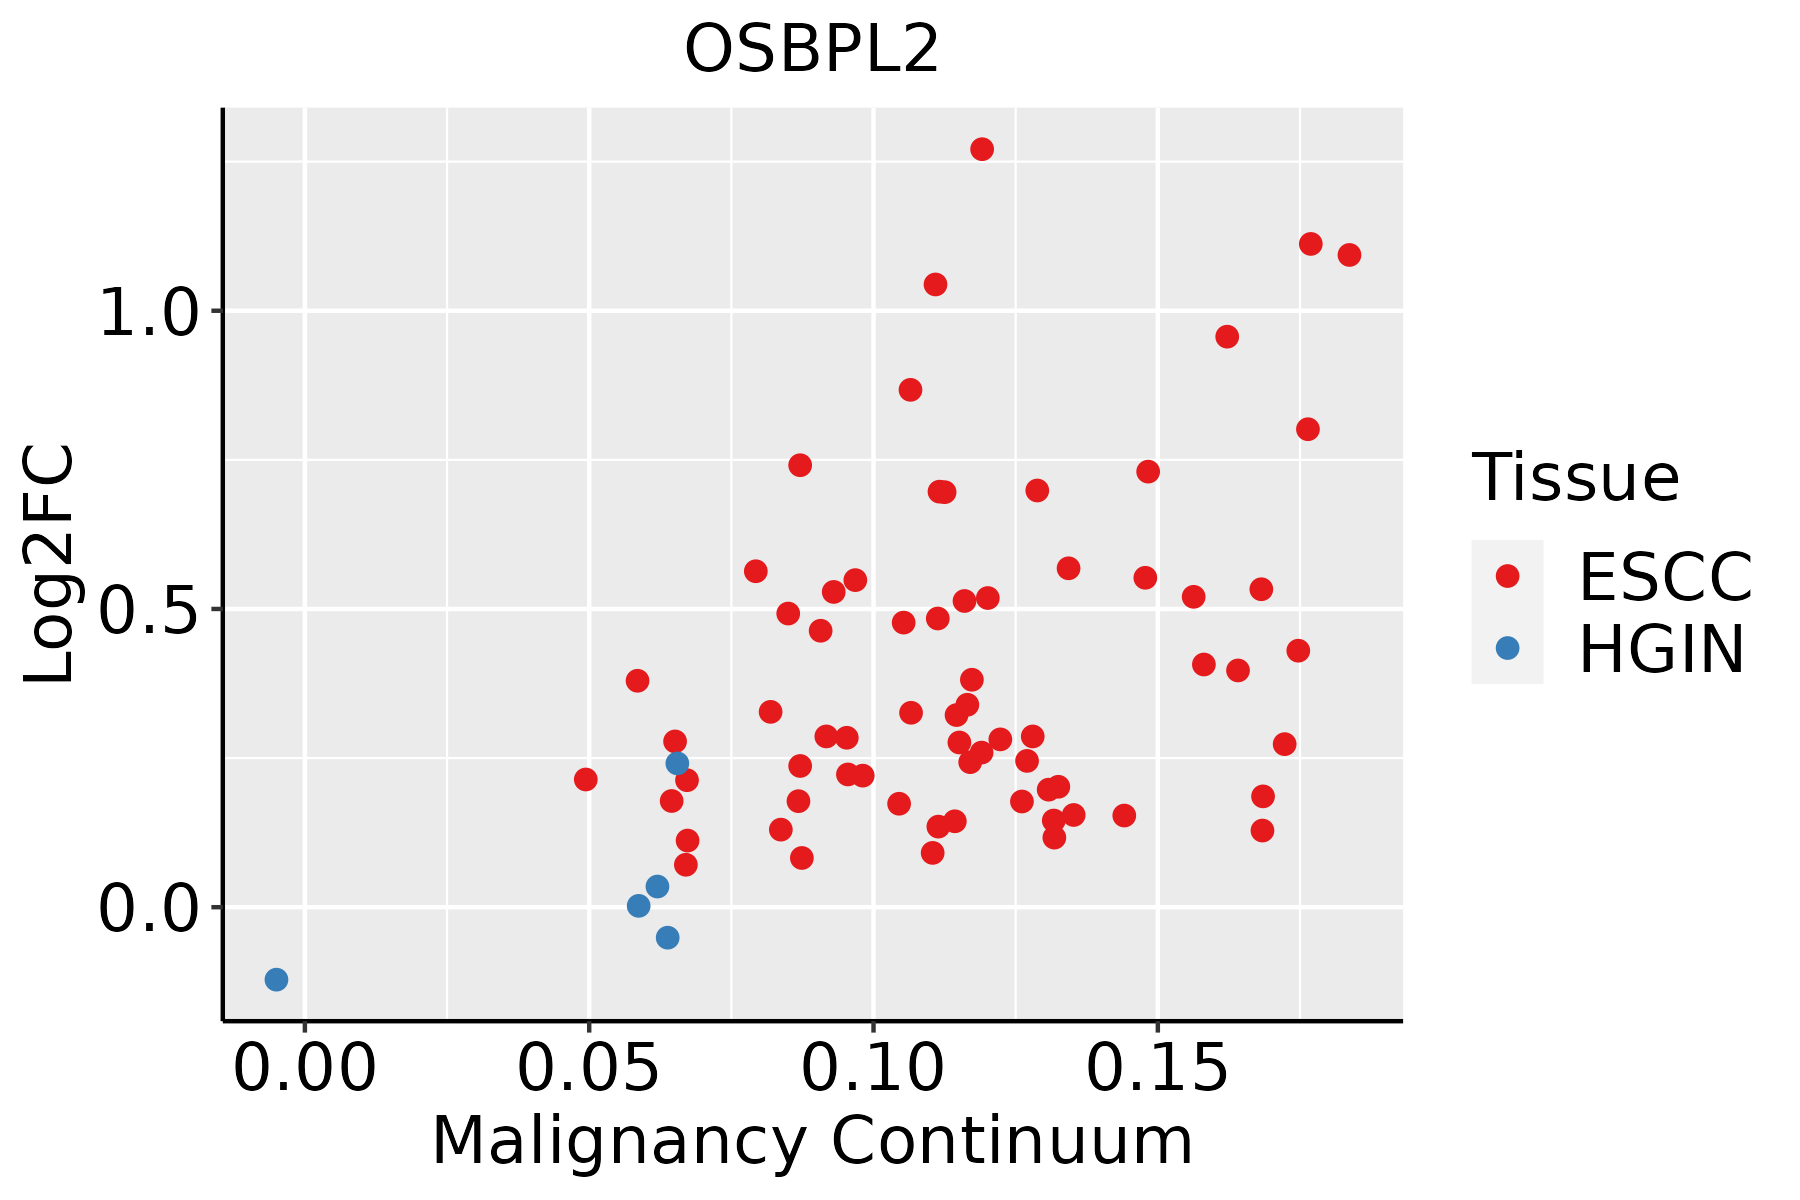 | ESCC: Esophageal squamous cell carcinoma |
| HGIN: High-grade intraepithelial neoplasias | ||
| LGIN: Low-grade intraepithelial neoplasias | ||
| Liver |  | HCC: Hepatocellular carcinoma |
| NAFLD: Non-alcoholic fatty liver disease | ||
| Oral Cavity | 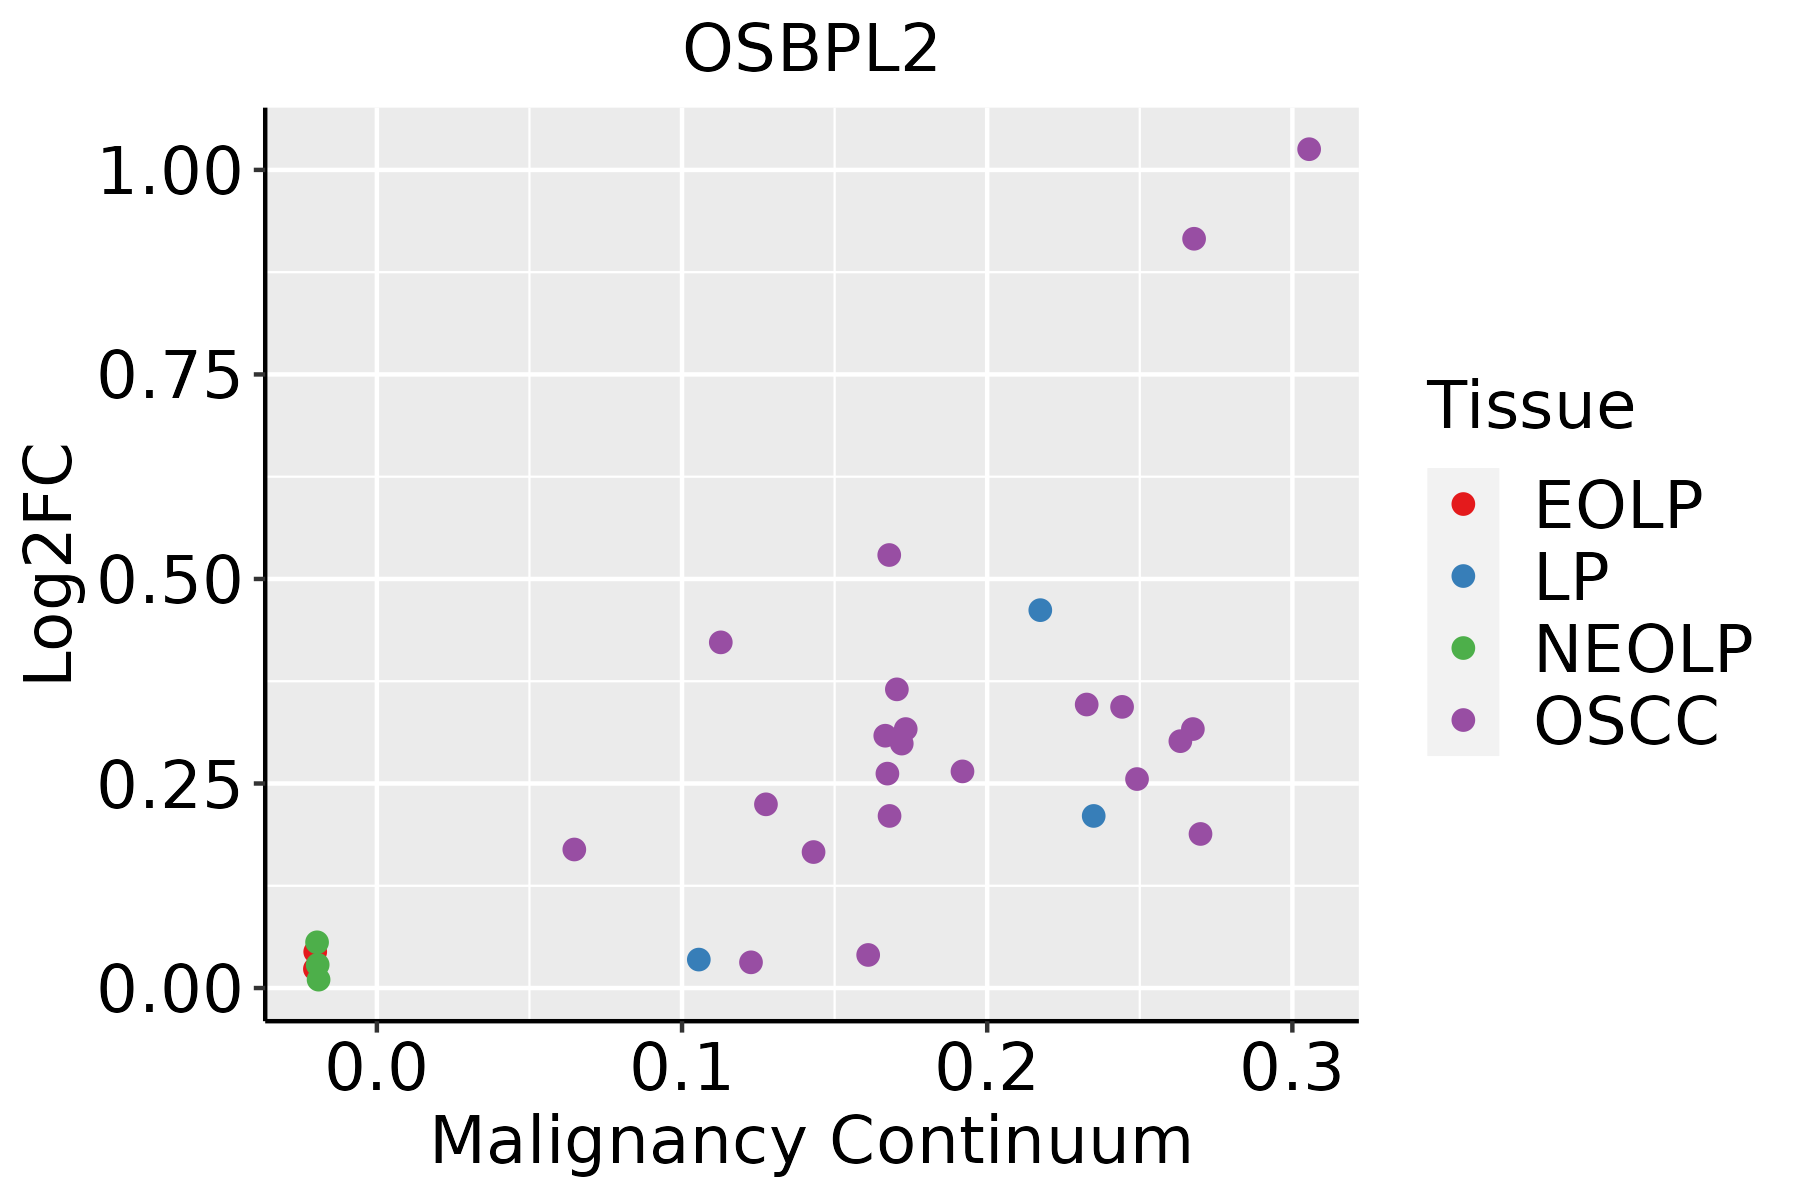 | EOLP: Erosive Oral lichen planus |
| LP: leukoplakia | ||
| NEOLP: Non-erosive oral lichen planus | ||
| OSCC: Oral squamous cell carcinoma | ||
| Skin | 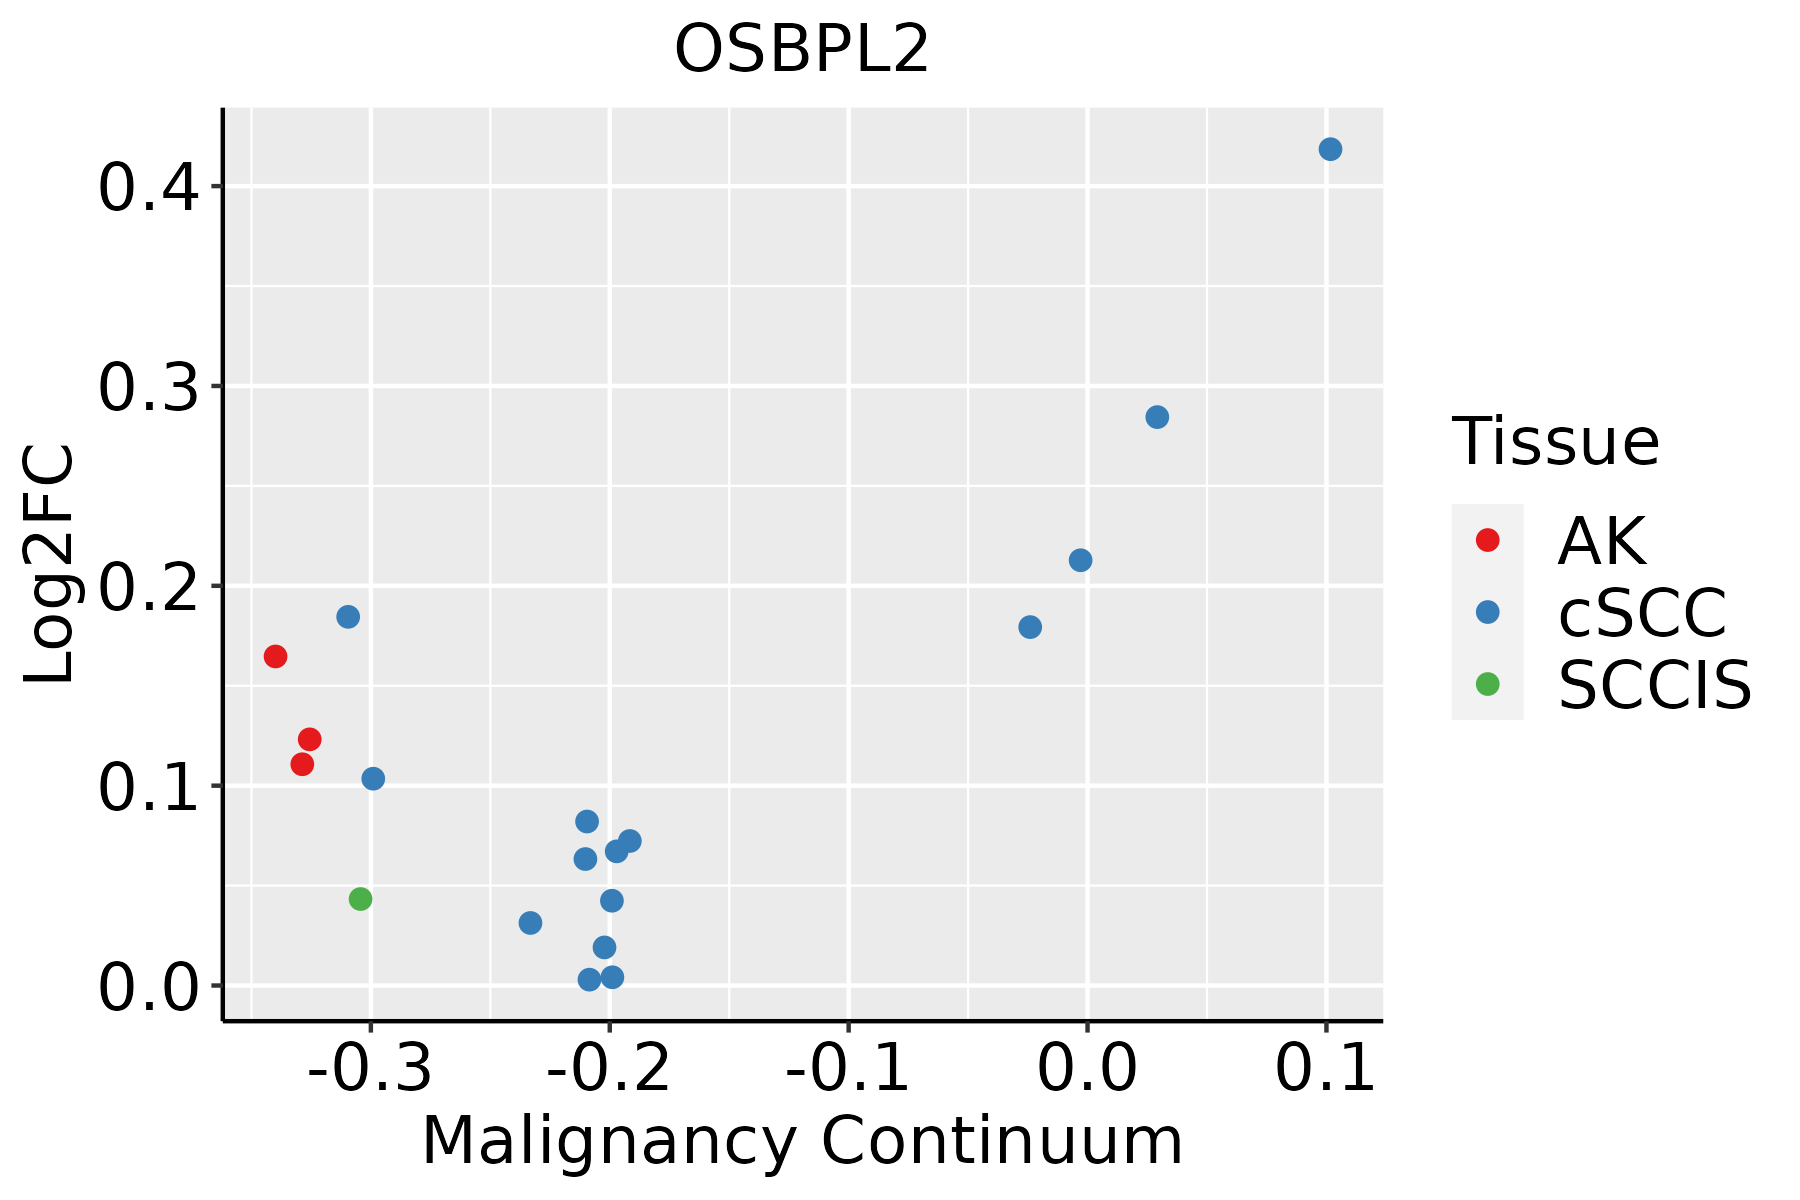 | AK: Actinic keratosis |
| cSCC: Cutaneous squamous cell carcinoma | ||
| SCCIS:squamous cell carcinoma in situ | ||
| Thyroid | 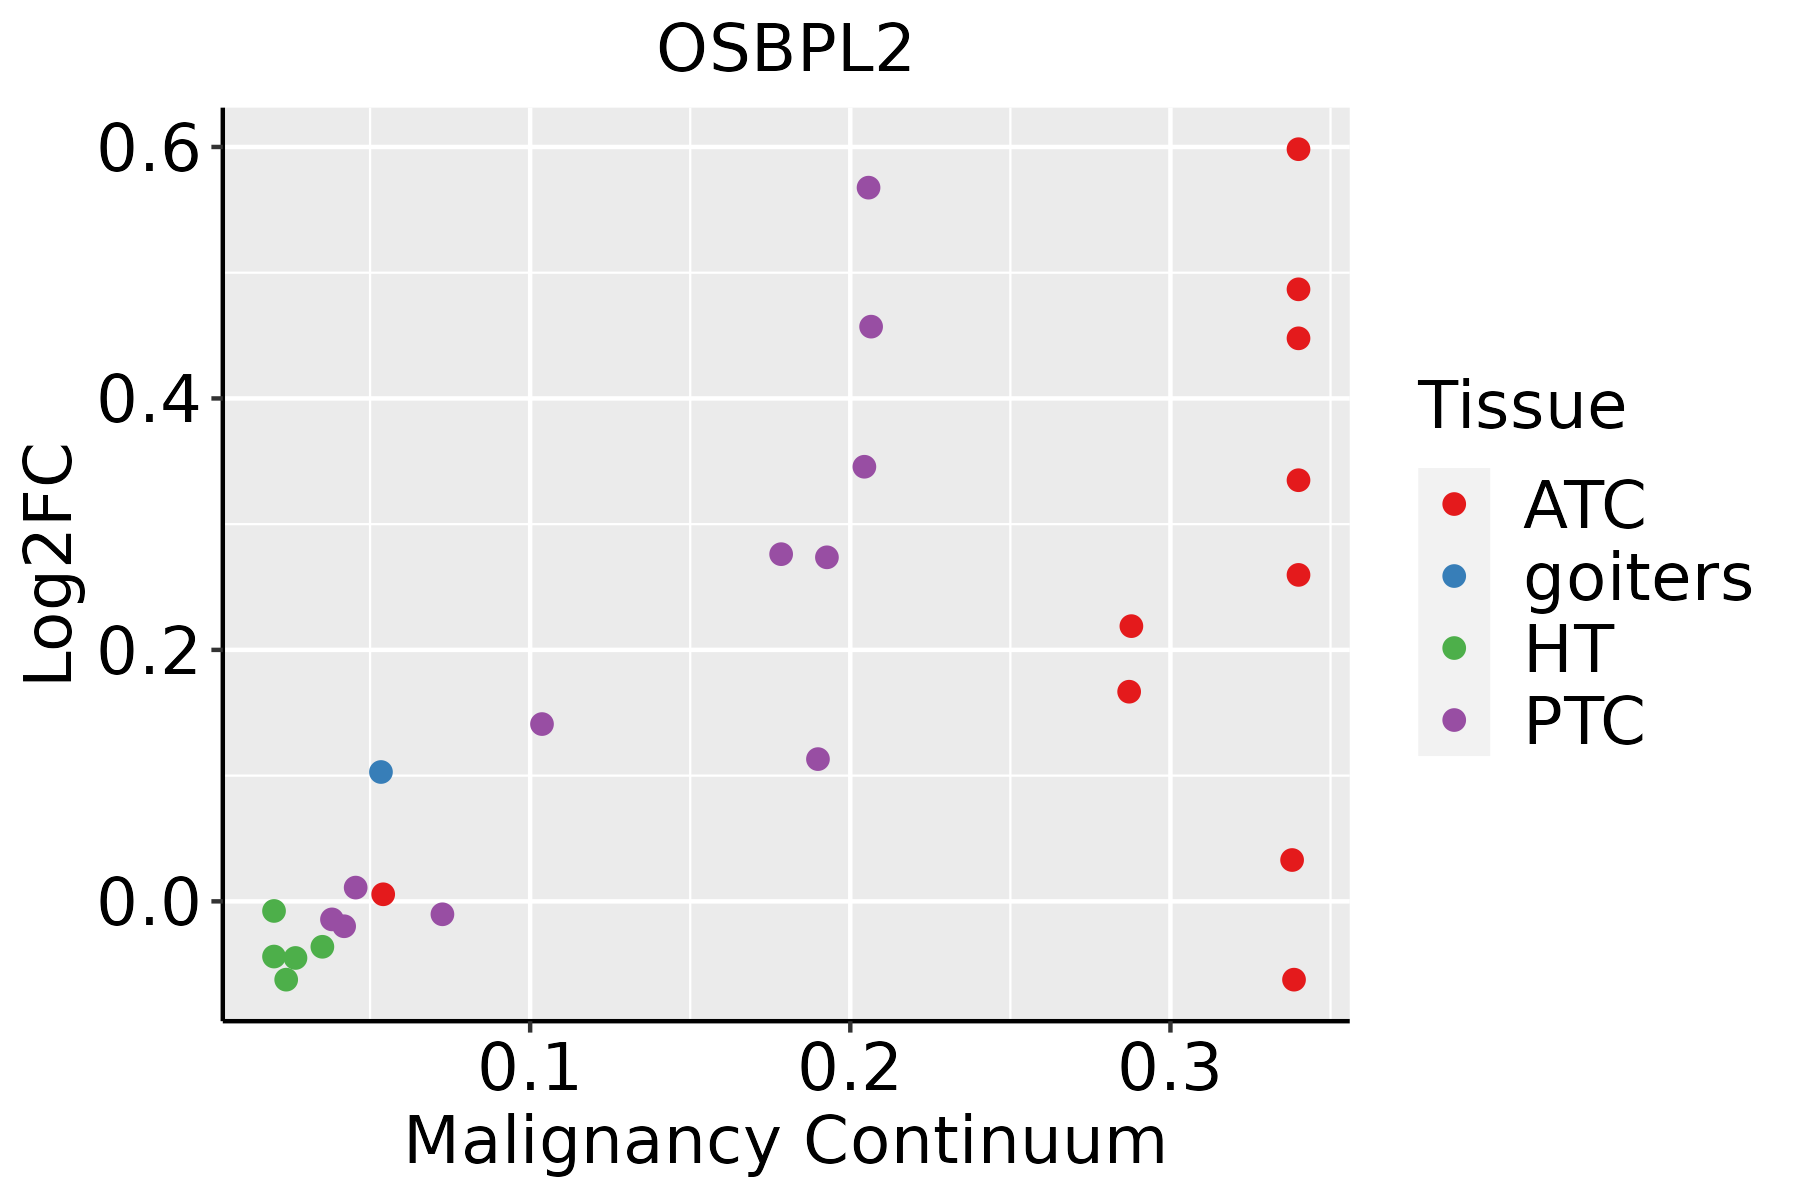 | ATC: Anaplastic thyroid cancer |
| HT: Hashimoto's thyroiditis | ||
| PTC: Papillary thyroid cancer |
| ∗log2FC in expression of this searched gene in stem-like cells from each diseased tissue sample relative to stem-like cells in normal samples in each tissue plotted against the malignancy continuum. Samples are colored based on if they are from different disease stage. |
Top |
Malignant transformation related pathway analysis |
| Find out the enriched GO biological processes and KEGG pathways involved in transition from healthy to precancer to cancer |
| Tissue | Disease Stage | Enriched GO biological Processes |
| Colorectum | AD |  |
| Colorectum | SER |  |
| Colorectum | MSS |  |
| Colorectum | MSI-H |  |
| Colorectum | FAP |  |
| ∗Top 15 enriched GO BP terms are showed in the bar plot of each disease state in each tissue. Each row represents a significant GO biological process which is colored according to the -log10(p.adjust). |
| Page: 1 2 3 4 5 6 7 8 9 |
| GO ID | Tissue | Disease Stage | Description | Gene Ratio | Bg Ratio | pvalue | p.adjust | Count |
| GO:00463948 | Esophagus | ESCC | carboxylic acid biosynthetic process | 175/8552 | 314/18723 | 1.98e-04 | 1.26e-03 | 175 |
| GO:00160538 | Esophagus | ESCC | organic acid biosynthetic process | 175/8552 | 316/18723 | 3.04e-04 | 1.82e-03 | 175 |
| GO:00512623 | Esophagus | ESCC | protein tetramerization | 54/8552 | 87/18723 | 1.50e-03 | 7.06e-03 | 54 |
| GO:00066946 | Esophagus | ESCC | steroid biosynthetic process | 98/8552 | 173/18723 | 2.34e-03 | 1.03e-02 | 98 |
| GO:00512592 | Esophagus | ESCC | protein complex oligomerization | 130/8552 | 238/18723 | 3.29e-03 | 1.36e-02 | 130 |
| GO:19016174 | Esophagus | ESCC | organic hydroxy compound biosynthetic process | 128/8552 | 237/18723 | 5.86e-03 | 2.16e-02 | 128 |
| GO:00323661 | Esophagus | ESCC | intracellular sterol transport | 20/8552 | 29/18723 | 9.66e-03 | 3.34e-02 | 20 |
| GO:00323671 | Esophagus | ESCC | intracellular cholesterol transport | 20/8552 | 29/18723 | 9.66e-03 | 3.34e-02 | 20 |
| GO:001605321 | Liver | HCC | organic acid biosynthetic process | 200/7958 | 316/18723 | 5.24e-14 | 3.22e-12 | 200 |
| GO:004639421 | Liver | HCC | carboxylic acid biosynthetic process | 198/7958 | 314/18723 | 1.19e-13 | 6.78e-12 | 198 |
| GO:00082022 | Liver | HCC | steroid metabolic process | 188/7958 | 319/18723 | 1.96e-09 | 5.63e-08 | 188 |
| GO:007233021 | Liver | HCC | monocarboxylic acid biosynthetic process | 129/7958 | 214/18723 | 1.08e-07 | 2.09e-06 | 129 |
| GO:00066942 | Liver | HCC | steroid biosynthetic process | 104/7958 | 173/18723 | 2.13e-06 | 2.91e-05 | 104 |
| GO:00082062 | Liver | HCC | bile acid metabolic process | 34/7958 | 49/18723 | 1.28e-04 | 1.06e-03 | 34 |
| GO:19016172 | Liver | HCC | organic hydroxy compound biosynthetic process | 129/7958 | 237/18723 | 1.32e-04 | 1.08e-03 | 129 |
| GO:001087621 | Liver | HCC | lipid localization | 228/7958 | 448/18723 | 1.80e-04 | 1.41e-03 | 228 |
| GO:01200092 | Liver | HCC | intermembrane lipid transfer | 33/7958 | 48/18723 | 2.12e-04 | 1.63e-03 | 33 |
| GO:00066992 | Liver | HCC | bile acid biosynthetic process | 26/7958 | 36/18723 | 2.93e-04 | 2.10e-03 | 26 |
| GO:000686921 | Liver | HCC | lipid transport | 198/7958 | 398/18723 | 1.92e-03 | 9.78e-03 | 198 |
| GO:00303012 | Liver | HCC | cholesterol transport | 65/7958 | 117/18723 | 2.95e-03 | 1.38e-02 | 65 |
| Page: 1 2 |
| Pathway ID | Tissue | Disease Stage | Description | Gene Ratio | Bg Ratio | pvalue | p.adjust | qvalue | Count |
| Page: 1 |
Top |
Cell-cell communication analysis |
| Identification of potential cell-cell interactions between two cell types and their ligand-receptor pairs for different disease states |
| Ligand | Receptor | LRpair | Pathway | Tissue | Disease Stage |
| Page: 1 |
Top |
Single-cell gene regulatory network inference analysis |
| Find out the significant the regulons (TFs) and the target genes of each regulon across cell types for different disease states |
| TF | Cell Type | Tissue | Disease Stage | Target Gene | RSS | Regulon Activity |
| ∗The dot plots of a searched regulon are shown for all cell subpopulations in each disease state of each tissue based on the regulon specific score inferred using pySCENIC and by calculating the average expression. |
| Page: 1 |
Top |
Somatic mutation of malignant transformation related genes |
| Annotation of somatic variants for genes involved in malignant transformation |
| Hugo Symbol | Variant Class | Variant Classification | dbSNP RS | HGVSc | HGVSp | HGVSp Short | SWISSPROT | BIOTYPE | SIFT | PolyPhen | Tumor Sample Barcode | Tissue | Histology | Sex | Age | Stage | Therapy Types | Drugs | Outcome |
| OSBPL2 | SNV | Missense_Mutation | c.1225C>G | p.Arg409Gly | p.R409G | Q9H1P3 | protein_coding | deleterious(0) | probably_damaging(0.976) | TCGA-AR-A1AH-01 | Breast | breast invasive carcinoma | Female | <65 | I/II | Unspecific | PD | ||
| OSBPL2 | SNV | Missense_Mutation | c.937T>G | p.Ser313Ala | p.S313A | Q9H1P3 | protein_coding | tolerated(0.86) | benign(0) | TCGA-C8-A12U-01 | Breast | breast invasive carcinoma | Female | <65 | I/II | Unknown | Unknown | SD | |
| OSBPL2 | SNV | Missense_Mutation | c.841N>G | p.His281Asp | p.H281D | Q9H1P3 | protein_coding | deleterious(0) | probably_damaging(1) | TCGA-DS-A0VN-01 | Cervix | cervical & endocervical cancer | Female | <65 | I/II | Chemotherapy | cisplatin | SD | |
| OSBPL2 | SNV | Missense_Mutation | rs773593916 | c.1225C>T | p.Arg409Cys | p.R409C | Q9H1P3 | protein_coding | deleterious(0.01) | probably_damaging(0.992) | TCGA-EA-A3HU-01 | Cervix | cervical & endocervical cancer | Female | <65 | I/II | Unknown | Unknown | SD |
| OSBPL2 | SNV | Missense_Mutation | rs748904630 | c.1412N>A | p.Arg471Gln | p.R471Q | Q9H1P3 | protein_coding | deleterious(0) | probably_damaging(1) | TCGA-AA-3811-01 | Colorectum | colon adenocarcinoma | Female | >=65 | III/IV | Unknown | Unknown | PD |
| OSBPL2 | SNV | Missense_Mutation | rs776496055 | c.1273C>T | p.Arg425Trp | p.R425W | Q9H1P3 | protein_coding | deleterious(0) | probably_damaging(1) | TCGA-AA-A00N-01 | Colorectum | colon adenocarcinoma | Male | >=65 | I/II | Unknown | Unknown | PD |
| OSBPL2 | SNV | Missense_Mutation | c.662T>C | p.Leu221Pro | p.L221P | Q9H1P3 | protein_coding | deleterious(0) | possibly_damaging(0.766) | TCGA-AU-6004-01 | Colorectum | colon adenocarcinoma | Female | >=65 | I/II | Unknown | Unknown | SD | |
| OSBPL2 | SNV | Missense_Mutation | novel | c.817N>G | p.Cys273Gly | p.C273G | Q9H1P3 | protein_coding | deleterious(0.05) | probably_damaging(0.964) | TCGA-AZ-4315-01 | Colorectum | colon adenocarcinoma | Male | <65 | I/II | Unknown | Unknown | SD |
| OSBPL2 | SNV | Missense_Mutation | c.1213N>T | p.Arg405Cys | p.R405C | Q9H1P3 | protein_coding | deleterious(0) | probably_damaging(1) | TCGA-D5-7000-01 | Colorectum | colon adenocarcinoma | Female | >=65 | I/II | Unknown | Unknown | SD | |
| OSBPL2 | SNV | Missense_Mutation | c.323N>T | p.Thr108Met | p.T108M | Q9H1P3 | protein_coding | deleterious(0) | probably_damaging(0.988) | TCGA-WS-AB45-01 | Colorectum | colon adenocarcinoma | Female | <65 | I/II | Unknown | Unknown | SD |
| Page: 1 2 3 4 5 |
Top |
Related drugs of malignant transformation related genes |
| Identification of chemicals and drugs interact with genes involved in malignant transfromation |
| (DGIdb 4.0) |
| Entrez ID | Symbol | Category | Interaction Types | Drug Claim Name | Drug Name | PMIDs |
| Page: 1 |

Copyright 2023-Present -The University of Texas Health Science Center at Houston |